Along with the industrial revolution of the last century, several tragic poisoning episodes distinguished Hg as one of the most hazardous environmental contaminants. Due to its chemical nature, Hg is ubiquitous in the biosphere. In the environment, Hg exists in various chemical forms, the sources, transportation and fate of which are diverse(Reference Choi and Grandjean1). The most hazardous chemical form of Hg is methylmercury (MeHg), which has high lipid solubility and high affinity towards the sulfhydryl (–SH) groups of amino acids. Therefore, it accumulates efficiently in ecosystems. Food and especially large predatory fish at the top of the aquatic food chain are the main source of MeHg for man.
When considering low and chronic exposure to MeHg, fetuses, infants and young children are the most vulnerable groups. In epidemiological studies, fetal exposure to moderate levels of MeHg has been associated with impaired neurological development, as deficits in cognitive, attention, motor and verbal tests(Reference Crump, Kjellström and Shipp2–Reference Debes, Budtz-Jørgensen and Weihe4). In addition to the neurotoxic effects, high exposure to Hg has been associated with adverse cardiovascular effects among adults(Reference Salonen, Seppänen and Nyyssönen5). To describe the level of exposure without recognized adverse effects during a lifetime, the US Environmental Protection Agency (EPA) has set a reference dose (RfD) of 0·1 μg/kg body weight per d(6), corresponding to a level of 3·5 μg MeHg/l in mother’s blood(Reference Stern and Smith7).
The health risk associated with exposure to MeHg has usually been assessed merely by measuring seafood consumption. However, the contribution of seafood to total MeHg burden varies between 20 % and 85 % in different countries, other sources being e.g. cereals and meat(Reference Galal-Gorchev8). Furthermore, certain nutritional factors, such as Se or dietary fibre, may modify MeHg metabolism(Reference Chapman and Chan9–Reference Rice11). Ignoring exposure through other foods and not taking into account the modifying effects of nutrients may explain the somewhat inconsistent findings in epidemiological studies, i.e. that adverse health effects have been associated with prenatal exposure to MeHg in some studies but not all(12–Reference Spurgeon14).
In the present study, a population of Finnish professional fishermen and their family members was studied. Owing to very high fish consumption, this population is exposed to exceptionally high levels of fish-derived contaminants(Reference Turunen, Verkasalo and Kiviranta15) and offers a unique resource to assess MeHg exposure. The objective was to assess the association between blood MeHg and the consumption of different foods among the fishermen and their family members and to identify potential dietary sources of MeHg.
Materials and methods
Study population, sampling and dietary assessment
The Fishermen Study Cohort consisted of all Finnish professional fishermen as well as their spouses and other family members living at the southern and south-western Baltic Sea coast of Finland(Reference Turunen, Verkasalo and Kiviranta15). From this cohort, a sub-sample of 309 participants attended a health examination study (the Fishermen Sub-study) between August 2004 and May 2005.
The health examination included blood sampling and a validated(Reference Männisto, Virtanen and Mikkonen16, Reference Paalanen, Männisto and Virtanen17), self-administered, 128-item FFQ, including ten fish items. The FFQ was designed to cover the whole diet over the preceding 12 months. The participants were asked to indicate the frequency of consumption of each food item with nine frequency categories ranging from ‘never’ to ‘six or more times per day’ (for more information, see Appendix in Turunen et al.(Reference Turunen, Männistö and Kiviranta18)). Portion sizes were specified using commonly used units (e.g. glass, slice or serving). The FFQ data were processed using the national Fineli® Finnish Food Composition Database (National Institute for Health and Welfare)(19) and the food consumption frequencies were converted into amounts of ingredients eaten (g/d).
In addition to the FFQ on whole diet, the participants completed a separate health questionnaire which included more detailed questions on the consumption of different fish species (servings/month). In the health questionnaire, the participants were asked to indicate the frequency of use of frozen fish (e.g. coalfish, cod, redfish, fish sticks); canned ocean fish (e.g. tuna, sardine, herring, mackerel); rainbow trout (e.g. fresh, frozen, canned); Baltic herring (e.g. fresh, frozen, canned); predatory fish from inland waters (e.g. pike, perch, burbot, pike-perch); vendace; other fish from inland waters (e.g. whitefish, bream, roach); Baltic salmon and trout; other Baltic fish; and other ocean fish (e.g. smoked mackerel, Norwegian salmon). There were six possible frequency categories, ranging from ‘never’ to ‘almost every day’, and portion sizes were not specified.
Complete data from the blood sampling, FFQ on whole diet and the separate health questionnaire were obtained from 301 participants. The majority (80 %) of the male participants were professional fishermen and most (68 %) of the female participants were fishermen’s wives. Blood MeHg concentrations were analysed at the National Institute for Health and Welfare, Chemical Exposure Unit, which is an accredited testing laboratory (Code T077, EN ISO/IEC 17025).
Sample preparation and quantification using isotope-dilution GC/high-resolution MS
Sodium citrate was used as an anticoagulant and the blood samples were stored at –70°C prior to analysis. An isotope dilution method was developed for the present study in order to accurately measure low concentrations of MeHg from the blood samples and the method is therefore described here in detail. Methylmercury chloride of natural isotopic abundances of Hg and an isotopically enriched (to 96·41 % in the CH3200HgCl isotopomer) spike solution of methylmercury chloride in methanol were purchased from Applied Isotope Technologies Inc. (Sunnyvale, CA, USA). The method used for the quantification of MeHg from whole blood sample was modified from the method of Baxter et al.(Reference Baxter, Rodushkin and Engström20). In brief, 5 ng of enriched CH3200HgCl spike in 165 μl of methanol was added to 1 ml blood sample in a 12 ml screw-capped test-tube and the sample shaken for 4 h in order to allow the enriched methylmercury to equilibrate. Three ml of 1·4 m-NaBr in 0·9 m-H2SO4 and 1 ml of 1 m-CuSO4 were added to the sample to release the CH3Hg+ cation from protein-binding sites and to form a stable methylmercury–bromide complex. The methylmercury–bromide complex was extracted into 6 ml of hexane. The hexane phase was separated and 1 ml of 0·1 m-NaHCO3 buffer solution and 2 ml of sodium tetraphenylborate derivatization reagent (0·25 % w/v in water) were added to form the volatile phenyl derivative of methylmercury (CH3HgC6H5). The aqueous phase was discarded and hexane was changed to 0·5 ml of toluene as the final solvent. The phenyl derivative of methylmercury was analysed with an HP 6890 gas chromatograph (Agilent Technologies, Inc., Wilmington, DE, USA) connected to an Autospec Ultima high-resolution mass spectrometer (HRMS; Waters, Manchester, UK) operating in the selected-ion monitoring mode using a resolution of 8000. The column used was a DB-5MS capillary column (12 m, 0·25 mm internal diameter, 0·25 μm film; Agilent Technologies, Inc.). The areas of molecular ions m/z 292·0311 and 294·0334 were monitored. Theoretical relative abundances of these ions in the HRMS spectra for both natural and enriched spike solution were calculated using the isotope pattern calculator(Reference Yan21). From the theoretical and observed ion ratios and the mass of enriched spike added to the samples, the original concentration MeHg in the blood samples was calculated using the principles and equations presented by Yang et al.(Reference Yang, Colombini and Maxwell22).
Quality control and assurance
To avoid contamination, all glassware was rinsed with 0·01 m-HCl–EtOH solution, soaked overnight in 1 m-HNO3 and heated at 500°C for 8 h. With each series of samples, a blank sample and two internal control samples (bovine and human blood with known additions of MeHg) were analysed. The limit of quantification was 0·15 μg/l. For bovine blood (n 13), percentage recovery was 108 and the percentage relative standard deviation (%RSD) was 7·5. For human blood (n 13), percentage recovery was 94 and the %RSD was 4·2. During each GC–HRMS sample series, an ion intensity ratio control solution (50 ng natural abundance phenylated methylmercury/ml solution) was measured three times to correct for the mass bias of the HRMS instrument. Two participants were excluded from the statistical analyses since their blood MeHg concentrations (48 and 60 μg/l) were above the measurement range of the analytical method.
Statistical analyses
In order to determine the potential dietary sources of MeHg, age- and energy-adjusted consumption of foods by MeHg quartiles were calculated and tested for linear trend across quartiles. Since fish consumption was strongly associated with the consumption of certain other foods (data not shown) and very significantly associated with blood MeHg, the consumption of other foods was further adjusted for fish consumption. To study the foods with very low consumption frequency more precisely, the statistical analysis was repeated only among those participants who reported to have consumed each food at least once during the last 12 months, i.e. non-users were excluded (data not shown). A P value of 0·05 was selected as the threshold of statistical significance.
Results
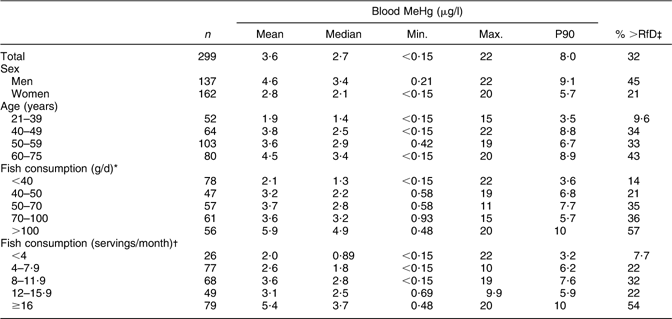
The final number of participants in the present study was 299, of whom 137 were men and 162 were women. Mean blood MeHg concentration was 4·6 μg/l among men and 2·8 μg/l among women (Table 1). In total, 32 % of the participants exceeded the US EPA RfD-derived MeHg concentration of 3·5 μg/l. The blood MeHg concentration as well as the percentage of the participants exceeding 3·5 μg/l increased with increasing age and fish consumption. The mean (range) blood MeHg concentrations by MeHg quartiles among men were 1·1 (0·21–1·9) μg/l, 2·7 (2·0–3·3) μg/l, 4·5 (3·4–6·4) μg/l and 10 (6·5–22) μg/l. Among women, the respective concentrations were 0·71 (0–1·2) μg/l, 1·7 (1·3–2·0) μg/l, 2·8 (2·1–3·3) μg/l and 6·0 (3·4–20) μg/l.
Table 1 Blood MeHg concentration (unadjusted, μg/l) according to sex, age and fish consumptionFootnote *,Footnote † and the percentage of participants exceeding the US EPA RfDFootnote ‡: Fishermen Sub-study, Finland, August 2004–May 2005
MeHg, methylmercury; EPA, Environmental Protection Agency; RfD, reference dose.
* Based on the FFQ.
† Based on the additional health questionnaire frequencies on consumption of specified fish species.
‡ 3·5 μg/l, derived from US EPA RfD of 0·1 μg/kg body weight per d.
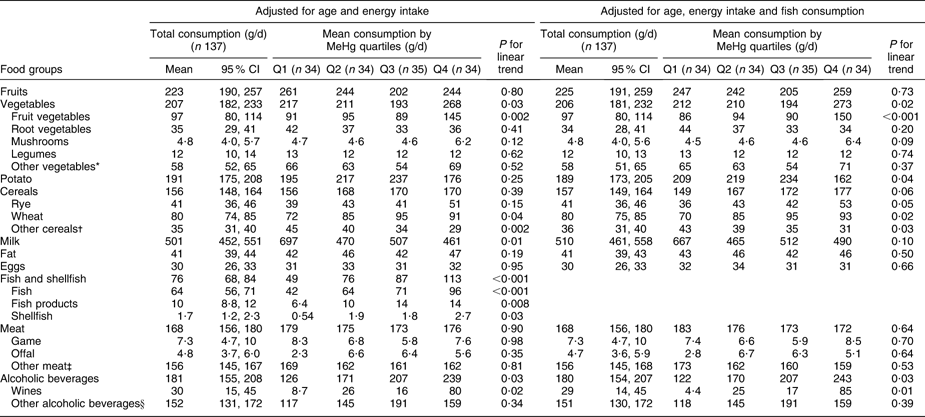
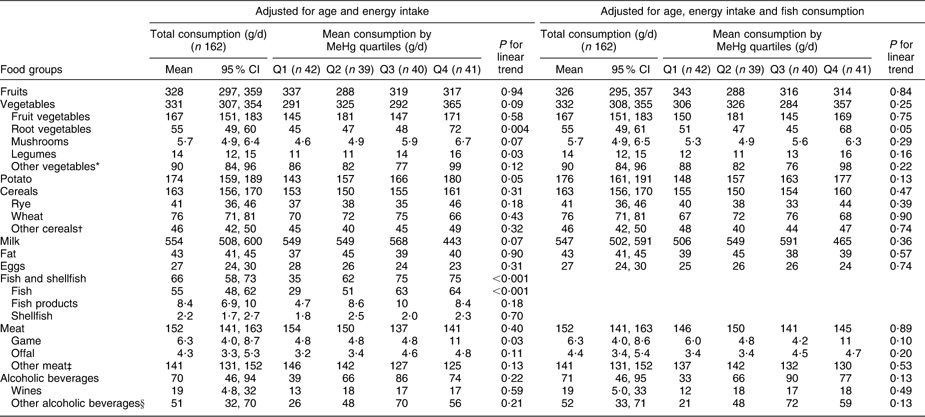
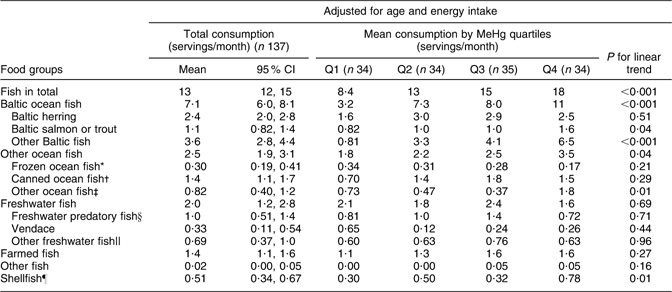
Fish consumption had the strongest association with blood MeHg (FFQ on whole diet): those who had the highest blood MeHg concentration had the highest fish consumption among both men and women (P < 0·001; Tables 2 and 3). With regard to fish species (frequency questions on fish consumption), the strongest associations with MeHg were observed for Baltic fish: herring (P = 0·51 among men and 0·002 among women), salmon or trout (P = 0·04 and 0·84) and other Baltic fish (P < 0·001 and 0·01, including e.g. Baltic pike, perch, burbot, pike-perch, whitefish and bream; Tables 4 and 5). Among men, other ocean fish (P = 0·04, including e.g. smoked mackerel and Norwegian salmon) and shellfish (P = 0·01) also had a statistically significant positive trend across quartiles. Among women, freshwater predatory fish (P = 0·007) had a strong positive trend across MeHg quartiles, but no trend was observed for either other ocean fish or shellfish.
Table 2 Adjusted means for consumption of selected foods (FFQ, g/d) across blood MeHg quartiles for men: Fishermen Sub-study, Finland, August 2004–May 2005
MeHg, methylmercury.
*Leaf vegetables, cabbage, onions, nuts, seeds and soya products.
†Oats, barley, rice, starch and other miscellaneous cereals.
‡Beef, pork, mutton, poultry and other miscellaneous meat products.
§Beers, spirits and other miscellaneous alcoholic beverages.
Table 3 Adjusted means for consumption of selected foods (FFQ, g/d) across blood MeHg quartiles for women: Fishermen Sub-study, Finland, August 2004–May 2005
MeHg, methylmercury.
*Leaf vegetables, cabbage, onions, nuts, seeds and soya products.
†Oats, barley, rice, starch and other miscellaneous cereals.
‡Beef, pork, mutton, poultry and other miscellaneous meat products.
§Beers, spirits and other miscellaneous alcoholic beverages.
Table 4 Adjusted means for consumption of specified fish species (separate health questionnaire, servings/month) across blood MeHg quartiles for men: Fishermen Sub-study, Finland, August 2004–May 2005
MeHg, methylmercury.
*Coalfish, cod, redfish, fish sticks.
†Tuna, sardine, herring, mackerel.
‡Smoked mackerel, Norwegian salmon.
§Pike, perch, burbot, pike-perch.
||Whitefish, bream, roach,
¶Shrimp, mussel, crab.
Table 5 Adjusted means for consumption of specified fish species (separate health questionnaire, servings/month) across blood MeHg quartiles for women: Fishermen Sub-study, Finland, August 2004–May 2005
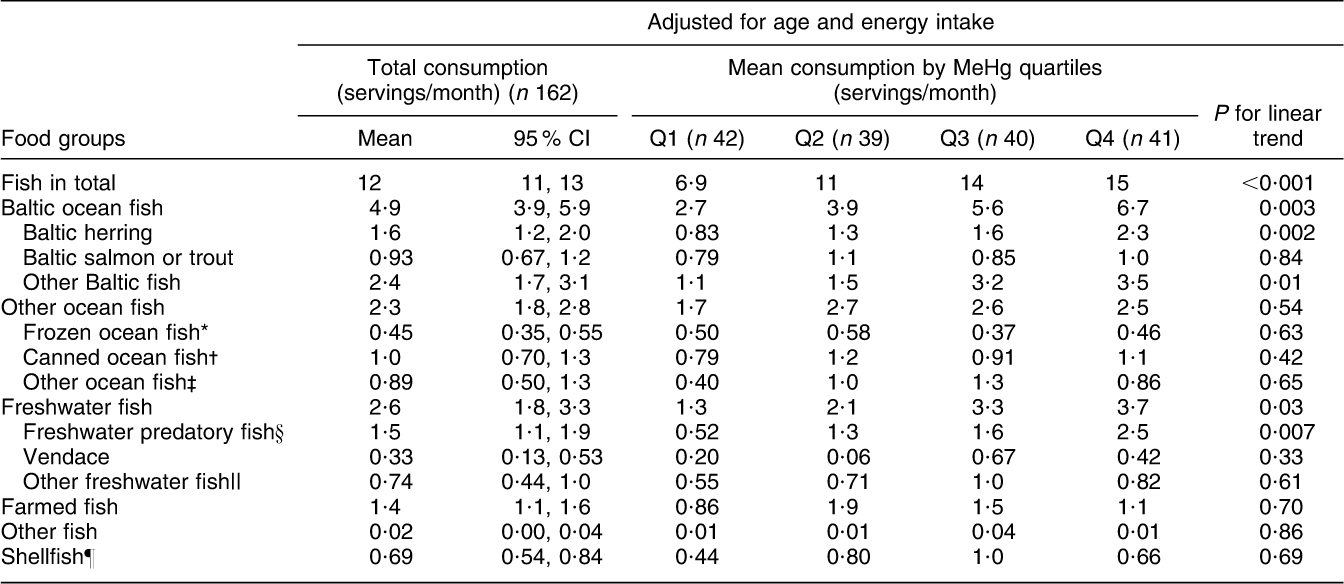
MeHg, methylmercury.
*Coalfish, cod, redfish, fish sticks.
†Tuna, sardine, herring, mackerel.
‡Smoked mackerel, Norwegian salmon.
§Pike, perch, burbot, pike-perch.
||Whitefish, bream, roach,
¶Shrimp, mussel, crab.
Total vegetable consumption (FFQ on whole diet, Tables 2 and 3) was positively associated with blood MeHg (P = 0·03 among men and 0·09 among women). Among men, the association was largely due to fruit vegetables, which had a statistically significant positive trend across quartiles (P = 0·002) also after adjustment for fish consumption (P < 0·001). Fruit vegetables include the most popular Finnish salad vegetables: tomato, sweet pepper, cucumber and courgette. Among women, no trend across quartiles was observed for fruit vegetables. Instead, a positive trend was observed for root vegetables (P = 0·004), legumes (P = 0·03) and mushrooms (P = 0·07). However, the trend for root vegetables attenuated to borderline significant (P = 0·05) and the trends for legumes and mushrooms did not remain statistically significant after adjustment for fish consumption (P = 0·16 and 0·29, respectively).
Potato had a borderline significant positive trend across quartiles among women (P = 0·05), but adjustment for fish consumption attenuated the trend to non-significant (P = 0·13; Table 3). Among men, the consumption of potato increased up to the third quartile after declining, and the linear trend test was statistically non-significant (Table 2).
Wheat (P = 0·04) and rye (P = 0·15) had a positive trend across MeHg quartiles among men (Table 2), also after adjustment for fish consumption (P = 0·02 for wheat and P = 0·05 for rye). Among women, no trend across quartiles was observed for cereals (Table 3).
Total meat consumption did not differ across MeHg quartiles (Tables 2 and 3). Among women, game consumption (P = 0·03) had a statistically significant positive trend, but the trend was attenuated by adjustment for fish consumption (P = 0·10; Table 3). Among men, the respective trends were not statistically significant (P = 0·98 and 0·70; Table 2), but when non-users were excluded, a statistically significant positive trend was observed for the consumption of offal (P = 0·03 with adjustment for age and energy, P = 0·05 with further adjustment for fish consumption). For other foods, excluding the non-users did not affect the results among men or women (data not shown).
Alcoholic beverages (P = 0·03) and especially wine (P = 0·02) had a statistically significant positive trend across MeHg quartiles among men (Table 2). Further adjustment for fish consumption did not change the associations (P = 0·03 and 0·01, respectively). There was a similar, but statistically non-significant trend among women (Table 3). It should be noted that the units are given in grams of alcoholic beverages, not in grams of ethanol.
Discussion
The average blood MeHg concentration was high (<0·15–22 μg/l) in the study population. Among men, the concentration was twice as high as among women. The MeHg concentration was in line with the participants’ high fish consumption. In the present study, mean fish and shellfish consumption was 76 g/d among men and 66 g/d among women, while the average Finnish fish consumption is approximately 48 and 42 g/d among men and women, respectively(Reference Paturi, Tapanainen and Reinivuo23). To our knowledge, MeHg has not previously been measured from blood in Finland. However, in a previous Finnish study in a population with fish consumption closer to the national average, hair concentration of Hg was lower than the blood concentration of MeHg found in the present study, when a hair-to-blood ratio of 250:1 was applied(Reference Salonen, Seppänen and Nyyssönen5).
Worldwide, varied Hg concentrations have been measured from whole blood among populations with equally high fish consumption as in the present study. For example, among Swedish fishermen, the median concentration of MeHg was 4 μg/l (1·6–9·0 μg/l)(Reference Svensson, Nilsson and Jonsson24); among Canadian anglers and sport-fish-eaters, the concentrations of MeHg ranged between 0 and 15·8 μg/l(Reference Cole, Kearney and Sanin25); and among Taiwanese pregnant women with high fish consumption, the total Hg median was 8·3 μg/l (4·4–21 μg/l)(Reference Hsu, Liu and Chien26). There is high inter-individual variation in the total Hg-to-MeHg ratio in whole blood(Reference Berglund, Lind and Björnberg27). The proportion of MeHg from total Hg in blood may sometimes vary as much as 6–100 %(Reference Baxter, Rodushkin and Engström20), which complicates the comparisons between these studies. However, the inconsistent concentrations observed in the aforementioned studies may also be partly explained by analytical and methodological differences, as well as differences in the type and contamination of fish consumed, other dietary sources of Hg and sources and intake of Hg metabolism modifiers. For example, dietary fibre may decrease MeHg absorption(Reference Rowland, Mallett and Flynn28) whereas milk may promote it(Reference Landry, Doherty and Gates29).
In Finland, the general population is advised by the National Nutrition Council to eat fish of varying species at least twice weekly. In the present study, 24 % of the participants consuming fish twice weekly at the most exceeded the blood MeHg level of 3·5 μg/l, derived from the US EPA’s RfD. Among the participants consuming fish more than twice weekly, the respective proportion was 42 %. The threshold level of 3·5 μg/l has been calculated for mother’s blood, with the aim of safeguarding the fetus. Therefore, exceeding this limit may be irrelevant for the adult population. However, the high proportion of participants exceeding this level in the present study suggests that in Finland, where domestic Hg emissions are low, exposure to MeHg may be notable, even when fish consumption is not high. More importantly, fetal exposure to MeHg may lead to the increased risk of neurotoxic effects also in the general Finnish population. However, owing to the characteristics of the selected study population, the results from the present study do not offer adequate grounds to make changes to the current national recommendations on fish consumption, especially since fish is an important source of many beneficial nutrients as well. Therefore, to ensure the health of next generations, MeHg analysis and exposure assessment should be performed as soon as possible among the general population, especially among women of childbearing age.
Blood MeHg was most strongly associated with fish consumption, as expected. With regard to fish species, Baltic fish seemed to be the most important source of MeHg for the study population. The strong association is probably explained by the high proportion of Baltic fish in the participants’ diet (55 % of total fish consumption among men and 41 % among women), since Hg levels in these Baltic species have generally been low, 0·005–0·1 mg/kg fresh weight (FW)(Reference Venäläinen, Hallikainen and Parmanne30). The Baltic Sea is the main fishing area for the fishermen and therefore we assume that the high proportion of the fish they consume is from their own catch. To our knowledge, the proportion of Baltic fish among the general Finnish population has not been studied, but it is expected to be lower. Hg levels in freshwater predatory fish have been significantly higher than in the Baltic species (0·11–0·73 mg/kg FW)(Reference Munthe, Wängberg and Rognerud31) and therefore they are often considered as the main source of Hg for man. Although the consumption of freshwater predatory species in the present study was lower than the consumption of Baltic species, these species were also associated with blood MeHg, especially among women.
Besides fish, elevated concentrations of Hg have been measured in Finland and other countries from e.g. mushrooms and berries, game meat and offal, vegetables, cereals and drinking water, although the Hg levels measured in these foods have been considerably lower than in fish(Reference Larsen, Andersen and Møller32–Reference Mustaniemi, Hallikainen and Witick40). In the present study, the consumption of fruit vegetables, root vegetables, potato, wheat, rye and offal were shown to be positively associated with blood MeHg among one or both sexes but adjustment for fish consumption attenuated the associations for some foods. This probably reflects the fact that these foods are commonly eaten with fish and that fish consumption is a confounding factor in those cases. Nevertheless, the observed associations suggest that in addition to fish, other foods may play an important enough role to be taken into account in future exposure assessments, especially among populations with lower fish consumption than in the present study.
In the present study, some known Hg sources, namely mushrooms and game meats, were not associated with blood MeHg. Since Hg concentrations in these foods may sometimes be as high as in fish(Reference Fischer, Rapsomanikis and Andreae37, Reference Falandysz and Gucia38), the absence of an association is probably due to low consumption. Additionally, Hg in mushrooms exists mostly in the inorganic form, which is absorbed less effectively than MeHg.
Alcoholic beverages, especially wine, were statistically significantly associated with blood MeHg among men. However, Hg concentration in wine has been extremely low(Reference Catarino, Curvelo-Garcia and de Sousa41) and it seems unlikely that wine is an important source of Hg. At the same time, alcohol consumption has been shown to potentiate MeHg toxicity and to increase the blood concentration of total Hg in mice and rats(Reference Rumbeiha, Gentry and Bhatnagar42, Reference Turner, Bhatnagar and Yamashiro43). Thus, our results suggest that alcohol may interfere with MeHg metabolism by either enhancing the uptake or by impairing its elimination from the body.
For some foods, the association with blood MeHg was observed among men but not among women and vice versa. The differences between the sexes may be partially explained by the considerable differences in diets and nutrient intakes. For example, the consumption of fibre, which may decrease MeHg absorption(Reference Rowland, Mallett and Flynn28), seemed to be higher among women, possibly explaining why some associations were observed only among men. Additionally, differences in the MeHg excretion and organ distribution between the sexes have been observed in the mouse, rat and man(Reference Nielsen44–Reference Thomas, Fisher and Sumler46). Specifically, males seem to be more effective in eliminating Hg compared with females, which may in part explain the differences in the observed associations between men and women. For example, for game meats, an association was observed among women (P = 0·03) but not among men (P = 0·98), even though game consumption was similar among both women and men (7·3 (4·7–10) and 6·3 (4·0–8·7) g/d, respectively). However, the underlying reasons for the differences in observed associations between the sexes remain ambiguous.
Validated and accredited methods were used in the present study. Food consumption was measured by a validated FFQ on whole diet. The frequency questions on the consumption of different fish species were not validated, but there was reasonably good correlation between total fish consumption measured by the frequency questions and by the validated FFQ (the age-adjusted correlation coefficients for total fish consumption were 0·64 among men and 0·44 among women(Reference Turunen, Männistö and Kiviranta18)). Blood MeHg concentrations were analysed by an accredited testing laboratory with a method designed for low concentrations. Regarding the limitations of the study, we did not have data on MeHg concentrations in foods and therefore we could not quantify the relative intake of MeHg from different foods.
Conclusions
The present study shows that in addition to fish, other dietary sources such as vegetables, cereals and meat may have a role in MeHg exposure and they should be taken into account in exposure assessments. The association observed between alcohol consumption and blood MeHg among men is in line with animal studies which have shown that alcohol may potentiate MeHg accumulation and toxicity and calls for more detailed studies on MeHg metabolism. Relatively high MeHg concentrations were observed in the study, and therefore exposure assessment should be performed as soon as possible among the general Finnish population, with a special emphasis on women of childbearing age.
Acknowledgements
This study was funded by the Academy of Finland (decision numbers 77008, 205324, 206950 and 124286). The authors declare they have no conflict of interest. The contributions of each author were as follows: P.K.V. and S.M. were responsible for the concept and design of the study. R.A. and P.R. performed the chemical analysis of samples. R.A. and A.W.T. analysed and interpreted the data and drafted the article. S.M., T.V. and P.K.V. revised the article for important intellectual content. The authors thank the volunteers and research staff of the Fishermen study.


