


The 2007–2009 great recession in the USA was marked by a persistent rise in unemployment, declines in household income and inflation of food prices(Reference Kumcu and Kaufman1). For low-income households, this translated into a larger proportion of income going towards food, further stretching household budgets(Reference Kumcu and Kaufman1). Temporary supplementary financial support for low-income households was provided by the American Recovery and Reinvestment Act of 2009 (ARRA), which both increased benefit levels for households participating in the federal Supplemental Nutrition Assistance Program (SNAP) and expanded SNAP eligibility for jobless adults without children(Reference Nord and Prell2). One of ARRA’s primary goals was to reduce household food insecurity (FI), defined as when consistent access to sufficient, healthy and safe food is limited or uncertain(Reference Alaimo3). In December 2009, eight months after initiation of ARRA, 12·9 % of US residents received SNAP benefits compared with 10·6 % the previous year and the average monthly SNAP benefit amount had increased by 17 %. Food expenditures also increased and FI decreased(Reference Nord and Prell2).
Increased access to SNAP benefits, as well as increased benefit amount, post-ARRA may have impacted food consumption patterns. Previous research has shown that SNAP participants had similar macronutrient and micronutrient intakes as income-eligible non-participants, but lower dietary quality(Reference Andreyeva, Tripp and Schwartz4). Despite increased SNAP participation and improvement in food security post-ARRA, only one study has assessed dietary intake using cross-sectional data from the National Health and Nutrition Examination Survey (NHANES)(Reference Waehrer, Deb and Decker5) and two studies have assessed food security(Reference Nord and Prell2, Reference Kaushal, Waldfogel and Wight6) pre- to post-ARRA initiation. Waehrer et al. found that while overall intakes of carbohydrates, protein, total fat, fibre, Na and vitamin C did not change post-ARRA SNAP expansion among households in the 2007–2010 NHANES(Reference Waehrer, Deb and Decker5), the overall proportion of energy from saturated fats increased significantly and mean diet quality scores decreased significantly(Reference Waehrer, Deb and Decker5). Upon further investigation, ARRA SNAP expansion was associated with lower diet quality scores, particularly through higher intake of solid fats, alcohol and sugars, only among those with poor dietary intake pre-ARRA initiation and those with less education(Reference Waehrer, Deb and Decker5). These nuanced findings for vulnerable populations and the overall limited evidence on ARRA-related diet changes underscore the major lack of evidence elucidating the role of ARRA or similar government-mandated SNAP expansions on dietary intake, especially among segments of the population most at risk for FI and poor diet and with the most potential to benefit. Furthermore, the cross-sectional design of Waehrer et al.’s study(Reference Waehrer, Deb and Decker5) limits accurate assessment of dietary outcomes.
We therefore aimed to evaluate pre- and post-ARRA SNAP expansion differences in FI and dietary intake among a longitudinal cohort of Puerto Rican adults living in the mainland USA, a population with a high prevalence of FI(Reference Rabbitt, Smith and Coleman-Jensen7) and SNAP participation(Reference McClain, Xiao and Gao8) as well as poor nutrient intake(Reference Bermudez, Falcon and Tucker9) and diet quality(Reference Mattei, Sotres-Alvarez and Daviglus10) along with high rates of chronic disease(Reference Daviglus, Talavera and Aviles-Santa11, Reference Tucker, Mattei and Noel12). Findings may help inform improved policy strategies that better equip Puerto Ricans and similar high-risk populations to lower FI and consume a healthy diet.
Methods
Participants
We analysed data from the Boston Puerto Rican Health Study (BPRHS), a longitudinal study on psychosocial stress, nutrition and health. Recruitment and data collection methods have been described in detail elsewhere(Reference Tucker, Mattei and Noel12). Eligible participants were self-identified Puerto Rican adults (47 to 75 years) living in the greater Boston area, Massachusetts, and able to speak either English or Spanish. Study staff recruited participants through door-to-door enumeration and community outreach strategies (e.g. festivals/fairs, radio spots). Between 2004 and 2015, participants completed study visits at three time points (baseline (n 1500), 2-year (n 1258) and 5-year (n 961)). Trained, bilingual interviewers obtained participants’ written consent in participants’ homes and administered questionnaires and performed anthropometric and blood pressure measurements in duplicate. Questionnaires collected information on demographics, psychological-based acculturation, FI, food assistance programme participation, health insurance coverage, depressive symptoms, dietary intake, physical activity, smoking behaviour and alcohol use. The study was approved by the Institutional Review Boards at Tufts Medical Center and at Northeastern University.
Measures
Food security status was assessed at baseline and 5-year follow-up using the valid and reliable US Department of Agriculture ten-item adult food security survey module, capturing the food security status of the respondent and other adult household members over the past 12 months(Reference Hamilton, Cook and Thompson13). Affirmative responses are summed and classified into one of four food security categories: high (0), marginal (1–2), low (3–5) or very low (6–10)(14). To maximize sample size, and in accordance with other studies on food security and diet(Reference Hanson and Connor15), we defined a binary food security status variable by combining high and marginal food security (food secure) and low and very low food security (food insecure). Participants self-reported SNAP participation at all three study visits.
Dietary intake was assessed using an adapted semi-quantitative version of the National Cancer Institute Block-FFQ that incorporated Puerto Rican-appropriate foods and portion sizes. This adapted FFQ was previously validated in mainland US Puerto Ricans and more accurately represented intake than the original FFQ(Reference Tucker, Bianchi and Maras16). Participants were excluded if energy intakes were implausible (<1674 or >20 083 kJ/d (<400 or >4800 kcal/d)). Reported foods were used to compute intakes of total energy and nutrients. Nutrients were adjusted for energy intake using the residual method, in which the regression of nutrients v. total energy intake is performed to cancel out the correlated errors of energy intake and nutrients derived from the same FFQ(Reference Rhee, Cho and Willett17). We used the Alternate Healthy Eating Index-2010 (AHEI-2010) to assess diet quality. The AHEI-2010 consists of eleven dietary components associated with risk of chronic diseases, including vegetables (without potatoes), fruit (without fruit juice), whole grains, sugar-sweetened beverages and fruit juice, nuts and legumes, red and processed meat, trans-fatty acids, PUFA, n-3 fatty acids, Na and alcohol(Reference Chiuve, Fung and Rimm18). The minimum score for each component was 0 (worst) and the maximum score for each component was 10 (best), for a total AHEI-2010 score from 0 (lowest diet quality) to 110 (highest diet quality). Component scores were assigned based on the level to which the recommended amount of each dietary component was fulfilled.
Covariates
The potential confounders we considered were age, sex, income-to-poverty ratio, psychological-based acculturation, health insurance coverage, depressive symptoms, BMI, physical activity, smoking behaviour and alcohol intake. Income-to-poverty ratio was calculated by dividing total household income by the household’s appropriate federal poverty threshold(19). Psychological-based acculturation was assessed using an adapted ten-item Psychological Acculturation Scale that scored participants as being more Puerto Rican or more US American based on their subjective sense of belonging and emotional attachment to the two cultures. Scores ranged from 0 to 50 with higher scores indicating more US American identity(Reference Tropp, Erkut and Coll20). Depressive symptoms were assessed using the twenty-item Center for Epidemiology Studies – Depression (CESD) scale that captures the past-week frequency of experiencing feelings and behaviours associated with depression. Scores ranged from 0 to 60 with higher scores indicating greater depressive symptoms(Reference Radloff21). BMI was calculated from objective measures of weight and height (kg/m2). Physical activity was assessed using a modified Paffenbarger questionnaire and a score created that summed the total hours spent in typical activities over a 24 h period, multiplied by weighting factors associated with activity intensity(Reference Tucker, Bermudez and Castaneda22). Self-reported history and frequency of smoking and alcohol intake were collected and defined as ‘never’, ‘past, but not current’ and ‘current’ smoker or consumption of alcohol.
Statistical analyses
Because we were interested in comparing pre- and post-ARRA SNAP expansion values, we restricted our analytical sample (n 402) to participants with at least one of the three study visits pre-ARRA SNAP expansion initiation (1 April 2009) and one study visit post-ARRA SNAP expansion initiation but before the policy ended (1 November 2013). For all participants in the analytical sample, these two visits were the 2-year (pre-ARRA) and 5-year (post-ARRA) follow-up visits. Thus, we used SNAP participation and dietary intake at 2-year and 5-year follow-up. Food security status was used at baseline and 5-year follow-up, as it was not collected at 2-year follow-up. We categorized participants based on their SNAP participation status pre- and post-ARRA initiation: (i) sustained participants (SNAP participation both pre- and post-ARRA initiation); (ii) new participants (SNAP participation only post-ARRA initiation); and (iii) discontinued participants (SNAP participation only pre-ARRA initiation). Ineligible non-participants between 150 and 250 % of the federal poverty line have previously been defined as a comparison group in similar analyses, because they are almost SNAP-eligible and are classified as low-income for many public health insurance programmes(Reference Waehrer, Deb and Decker5). However, the sample size for ineligible non-participants in the BPRHS was too small (n 23) so only SNAP participants were considered in these analyses.
Descriptive analyses included paired t tests to compare values pre- and post-ARRA for continuous variables, ANOVA to compare continuous variables by SNAP participation status, and χ2 tests (or Fisher exact test when appropriate) to compare categorical variables pre- and post-ARRA and by SNAP participation status. We estimated differences in odds of FI post-ARRA SNAP expansion, compared with pre-ARRA, using generalized estimating equations adjusted for sex, educational attainment, and pre-ARRA age, income-to-poverty ratio, psychological acculturation, health insurance and depressive symptoms. We ran this model first with our entire analytical sample, and then individual models for each SNAP participation status category. We used repeated-measures mixed models to estimate mean nutrient intakes and AHEI-2010 total and component scores post-ARRA by SNAP participation status, adjusting for the same covariates as above in addition to pre-ARRA nutrient values or AHEI-2010 total and component scores and BMI. We employed the Tukey–Kramer method to adjust for multiple pairwise comparisons. We used repeated-measures mixed models instead of difference-in-difference models because our sample sizes for new and discontinued participants were small. Mixed models retain observations with missing covariate data, unlike difference-in-difference models. Analyses were conducted in the statistical software package SAS version 9.4 with significance levels set at P < 0·05.
Results
Participant characteristics
Of the 402 SNAP participants from pre- to post-ARRA SNAP expansion, 249 were sustained, ninety-five were new and fifty-eight were discontinued participants, indicating a 9 % increase in SNAP participation. Participant characteristics pre- and post-ARRA SNAP expansion by SNAP participation status are reported in Table 1. Among sustained SNAP participants post-ARRA, compared with pre-ARRA, a higher proportion had children in the household and reported being food secure, and a lower proportion reported being married or partnered, current smokers or current drinkers. Mean household size, psychological acculturation and BMI were also lower post-ARRA among sustained participants. Similar significant trends were documented among new and discontinued SNAP participants from pre- to post-ARRA, except for mean household size for new and discontinued participants, and psychological acculturation and food security among new participants. New and discontinued participants also had a lower proportion currently working post-ARRA. Post-ARRA, fewer participants overall were working, married or partnered, current smokers, current drinkers, classified with low or very low food security, and reported owning a home. Household size, psychological acculturation and BMI were also lower post-ARRA (see online supplementary material, Supplemental Table S1).
Table 1 Sociodemographic, sociocultural and health characteristics from pre-ARRA to post-ARRA SNAP expansion by SNAP participation status in the Boston Puerto Rican Health Study (n 402)†

ARRA, 2009 American Recovery and Reinvestment Act; SNAP, Supplemental Nutrition Assistance Program; AHEI-2010, Alternate Healthy Eating Index-2010.
* P < 0·05, **P < 0·01, ***P < 0·001, ****P < 0·0001 for trend.
† Analyses included paired t tests for continuous variables pre-/post-ARRA (mean and sd) and χ 2 (or Fisher exact test when appropriate) for categorical variables (%).
‡ Psychological acculturation score assessed degree of subjective sense of belonging and emotional attachment to US and Puerto Rican cultures. Scores ranged from 0 to 50, with higher scores indicating more US American identity.
§ Depressive symptoms over the past week were assessed by the Center for Epidemiology Studies – Depression (CESD) scale with, higher scores indicating greater depressive symptoms (scores ranged from 0 to 60).
‖ Physical activity score captured total time spent in light, moderate and vigorous activity, with higher scores indicating greater physical activity.
¶ The AHEI-2010 assessed dietary quality using eleven dietary components. Higher scores indicate higher diet quality (scores range from 0 to 110).
†† Food security status was assessed using the US Department of Agriculture ten-item adult food security module. Participants with full or marginal food security were categorized as food secure. Participants with low or very low food security were categorized as food insecure.
Food insecurity after the 2009 American Recovery and Reinvestment Act expansion of the Supplemental Nutrition Assistance Program
Among the entire sample of SNAP participants, odds of FI post-ARRA were significantly lower compared with pre-ARRA (OR (95 % CI): 0·69 (0·51, 0·94); Fig. 1). Within sustained participants, odds of FI were also lower post-ARRA compared with pre-ARRA (0·63 (0·43, 0·92)). Odds of FI post-ARRA, compared with pre-ARRA, were not significantly different within new (0·94 (0·49, 1·80)) or discontinued (0·63 (0·25, 1·56)) participants.
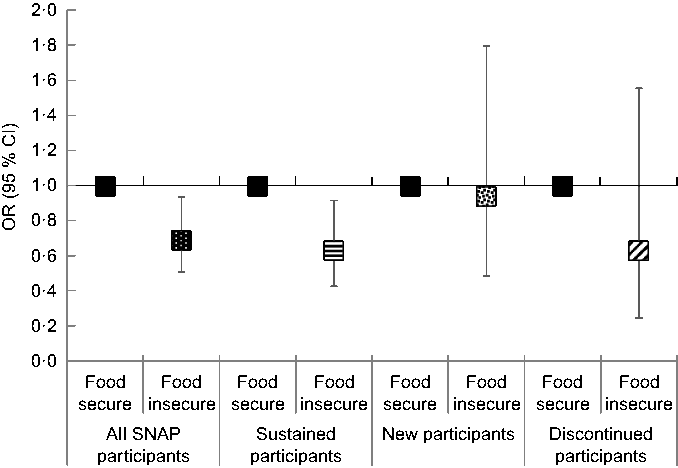
Fig. 1 OR, with 95 % CI represented by vertical bars, of being food insecure post-ARRA SNAP expansion for the total sample (![]() ) and within each SNAP participation status (
) and within each SNAP participation status (![]() , sustained;
, sustained; ![]() , new;
, new; ![]() , discontinued), adjusted for pre-ARRA sociodemographic, sociocultural and health factors, in the Boston Puerto Rican Health Study (n 402) (ARRA, 2009 American Recovery and Reinvestment Act; SNAP, Supplemental Nutrition Assistance Program)
, discontinued), adjusted for pre-ARRA sociodemographic, sociocultural and health factors, in the Boston Puerto Rican Health Study (n 402) (ARRA, 2009 American Recovery and Reinvestment Act; SNAP, Supplemental Nutrition Assistance Program)
Nutrient intakes after the 2009 American Recovery and Reinvestment Act expansion of the Supplemental Nutrition Assistance Program
Mean nutrient intakes post-ARRA SNAP expansion by SNAP participation status are reported in Table 2. Post-ARRA intakes of total energy, fat or protein, or of any type of fat or protein, or of key micronutrients did not differ by SNAP participation status. Similarly, post-ARRA AHEI-2010 scores and most component scores did not differ by SNAP participation status. Total carbohydrate intake was higher post-ARRA for sustained (mean (se): 215 (1·9) g/d) and new (216 (2·6) g/d) participants compared with discontinued participants (204 (3·4) g/d), and alcohol intake was lower post-ARRA for sustained (4·5 (0·8) g/d) and new (5·1 (1·1) g/d) participants compared with discontinued participants (9·7 (1·5) g/d). Similarly, sustained participants had lower AHEI-2010 alcohol component score (3·6 (0·1)) compared with discontinued participants (2·9 (0·2)). Dietary fibre intake was also higher post-ARRA for sustained participants (19·0 (0·4) g/d) compared with discontinued participants (17·5 (0·6) g/d). No other nutrient differed by SNAP participant status post-ARRA.
Table 2 Mean nutrient intakes and AHEI-2010 scores, with their se, post-ARRA SNAP expansion by SNAP participation status, adjusted for pre-ARRA nutrient intake, sociodemographic, sociocultural and health factors, in the Boston Puerto Rican Health Study (n 402)†
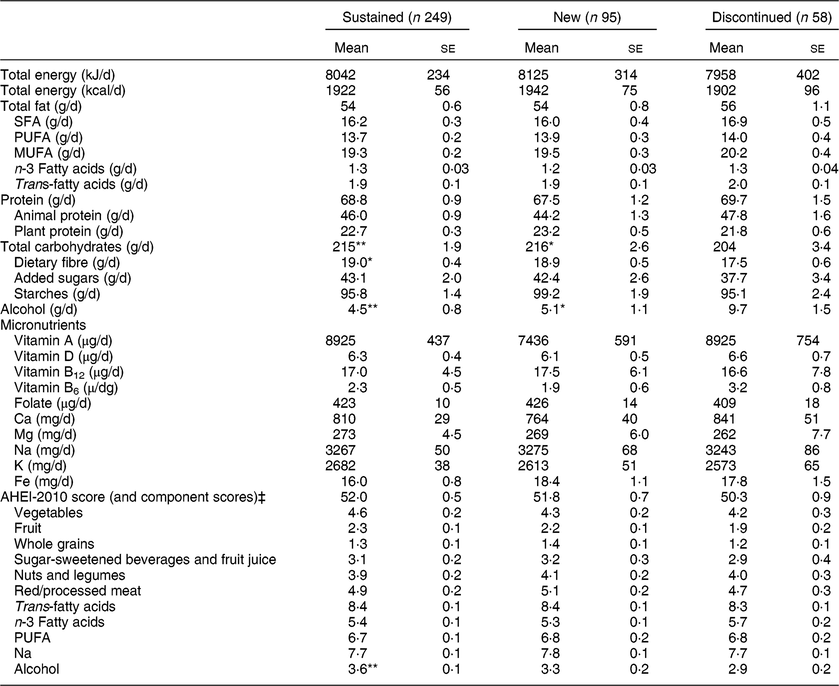
AHEI-2010, Alternate Healthy Eating Index-2010; ARRA, 2009 American Recovery and Reinvestment Act; SNAP, Supplemental Nutrition Assistance Program.
* P < 0·05, **P < 0·01 compared with discontinued participants.
† Linear repeated-measures models (with Tukey adjustment for multiple comparisons) and general estimating equations adjusted for pre-ARRA nutrient intake, age, sex, income-to-poverty ratio, educational attainment, psychological acculturation, health insurance, depressive symptoms and BMI.
‡ The AHEI-2010 assessed dietary quality using eleven dietary components. Higher scores indicate higher diet quality (total score range from 0 to 110). Each individual food or nutrient component is scored 0 to 10 (higher value indicating healthier intake).
Discussion
The findings from the present study demonstrate that Puerto Rican adults participating in SNAP, primarily sustained participants, experienced lower odds of FI post-ARRA SNAP expansion, suggesting that SNAP continuity and expanded benefits were influential. The post-ARRA SNAP expansion period also yielded higher mean total carbohydrate intake for sustained and new participants and higher mean dietary fibre intake for sustained participants, compared with discontinued participants. Notably, mean alcohol intake was lower post-ARRA SNAP expansion for sustained and new participants, compared with discontinued participants.
SNAP has previously shown success in improving food security among low-income households, the primary objective of the programme(Reference Mabli and Ohls23). Our findings contribute additional evidence of its effectiveness at reducing FI among an at-risk minority population, in whom limited evidence exists, and during the ARRA SNAP expansion period. To the best of our knowledge, only two other studies have investigated food security changes in response to ARRA SNAP expansion, using data from the Current Population Survey(Reference Nord and Prell2, Reference Kaushal, Waldfogel and Wight6). Similar to our findings, one of these studies showed that participation in SNAP increased and FI decreased for low-income households from pre- to post-ARRA SNAP expansion(Reference Nord and Prell2). Similar shifts were also observed for mixed-status Mexican households but not for Mexican immigrant households who are likely not eligible due to documentation status(Reference Kaushal, Waldfogel and Wight6), underscoring the importance of FI research focused on vulnerable groups.
For sustained and new participants in our sample, total carbohydrate intake was higher post-ARRA, compared with discontinued participants. Waehrer et al. found no differences for total carbohydrates post-ARRA SNAP expansion among SNAP-eligible NHANES households(Reference Waehrer, Deb and Decker5). Higher carbohydrate intake for sustained participants was likely from higher-quality food sources, as their dietary fibre intake was also higher post-ARRA compared with discontinued participants. Notably, the higher carbohydrate and fibre intakes may be due to higher intake of a combination of fruits, vegetables and whole grains, as these tended to be higher among sustained and new participants post-ARRA compared with discontinued participants, although the differences did not reach statistical significance. These findings again contrast with those from low-income, SNAP-eligible households in NHANES, in that the post-ARRA SNAP expansion period was not associated with higher fibre intake(Reference Waehrer, Deb and Decker5) although the comparison with our findings is limited because the report on NHANES data did not consider SNAP participation, only eligibility. Mainland US Puerto Ricans have lower intake of fibre than other Hispanic/Latino heritages in the USA(Reference Siega-Riz, Sotres-Alvarez and Ayala24). Thus, our findings suggest that increasing monthly benefits for Puerto Rican adults participating in SNAP may be an important strategy for improving fibre intake. Future programmatic research should investigate which fibre-rich foods are acceptable and feasible to increase among mainland US Puerto Ricans participating in SNAP, and how those foods are incorporated into daily life, although previous research in this cohort suggests that sources include beans and legumes, high-fibre cereals, oatmeal and whole-wheat bread(Reference Mattei, Sotos-Prieto and Bigornia25).
We did not document significant post-ARRA differences in mean diet quality score or component scores by SNAP participant group, except for alcohol intake. ARRA appeared to negatively impact mean diet quality score of low-income, SNAP-eligible households in NHANES, with a stronger effect among households at the lowest level (25th percentile) of diet quality pre-ARRA(Reference Waehrer, Deb and Decker5). Likewise, SNAP-eligible NHANES households with low intakes (25th percentile) of fruits and vegetables pre-ARRA had a decrease in fruit and vegetable intakes post-ARRA SNAP expansion(Reference Waehrer, Deb and Decker5). Although the differences were not statistically significant, intakes of fruits and vegetables tended to be higher for sustained and new SNAP participants in our sample. Even modest, non-significant higher intakes of fruits and vegetables among US Hispanic/Latino SNAP participants of Puerto Rican heritage would be important, as they have lower fruit and vegetable intakes compared with other Hispanic/Latino heritages(Reference Mattei, Sotres-Alvarez and Daviglus10) and high rates of SNAP participation(Reference McClain, Xiao and Gao8). Our findings underscore the need for further research on the potential nutritional benefit of ARRA SNAP expansions among diverse SNAP participants and for more targeted approaches to improving nutritional intake among low-income populations.
Our findings of lower alcohol intake among sustained and new participants compared with discontinued participates are novel. SNAP-eligible households in NHANES did not differ post-ARRA for intake of a food category combining saturated fats, alcohol and added sugars(Reference Waehrer, Deb and Decker5). We also did not find differences post-ARRA SNAP expansion for intakes of saturated fat, added sugars, and sugar-sweetened beverages or fruit juices, but our observed lower alcohol intake demonstrates not only the importance of disaggregating certain foods and nutrients but also the broader implications of SNAP participation. SNAP restricts alcohol purchases, possibly influencing the lower intake of alcohol among sustained and new participants compared with discontinued participants, although participants with alcohol use disorders may have been more likely to discontinue their SNAP participation. A recent study reported an inverse relationship between alcohol expenditure and household food purchasing across income quintiles(Reference Gell and Meier26), suggesting that individuals in our sample with discontinued SNAP participation and higher alcohol intake may have been at a higher dietary and FI risk, which may help explain the lower intakes of total carbohydrates and fibre we observed. Alcohol consumption among low-income adults in 2005–2008 NHANES did not differ by SNAP participation(Reference Todd and Ver Ploeg27) but most of these NHANES cycles were collected before the great recession and may not provide an adequate comparison with our findings, as alcohol use and problems increased as a function of economic losses during the recession(Reference Mulia, Zemore and Murphy28). Furthermore, mainland US Puerto Ricans report a higher average number of drinks per week and a greater proportion of binge drinking compared with other Hispanic/Latino heritages(Reference Ramisetty-Mikler, Caetano and Rodriguez29) and have higher incidence of alcohol use disorders compared with other Hispanic/Latino heritages and non-Hispanic Whites(Reference Ríos-Bedoya and Freile-Salinas30). Lower alcohol intake among SNAP participants in our sample of Puerto Rican adults underscores the need for more research in highly vulnerable SNAP-eligible populations and more evaluations of the potential impacts of SNAP participation beyond improving food security.
The post-ARRA SNAP expansion improvements for some nutrients in our cohort contribute to a limited evidence base on dietary intake among Hispanic/Latino adults participating in SNAP, most of which is cross-sectional and shows poorer dietary intake compared with eligible non-participants(Reference Nguyen, Shuval and Njike31, Reference Hilmers, Chen and Dave32). In a cross-sectional sample of low-income, Hispanic/Latino young and middle-aged women in Texas, SNAP participants consumed more total sugars and less whole grains compared with non-participants(Reference Hilmers, Chen and Dave32). However, the non-participant category may have contained both SNAP-eligible and SNAP-ineligible women and, thus, the comparison with SNAP participants should be interpreted carefully. Considering most Hispanics/Latinos residing in Texas are of Mexican heritage, the contrasting findings reiterate the importance of potential Hispanic/Latino heritage-specific differences in dietary intake among SNAP participants. More than half (52 %) of SNAP-eligible households in NHANES during the ARRA SNAP expansion were non-Hispanic Black, Hispanic or of other races(Reference Waehrer, Deb and Decker5), but no tests of racial or ethnic differences were reported. NHANES data from 2003–2010 found higher diet quality scores among non-Hispanic White adults participating in SNAP compared with eligible, non-participant non-Hispanic White adults, but similar differences were not observed between non-Hispanic Black or Hispanic SNAP participants v. their eligible non-participant counterparts(Reference Nguyen, Shuval and Bertmann33), suggesting that non-Hispanic White SNAP participants benefited more than non-Hispanic Black or Hispanic SNAP participants. The authors acknowledged that one potential explanation of the differences may be disparities in healthy food access. For Hispanics/Latinos, healthy food access and its impact on dietary intake may be distinctly tied to higher-density ethnic composition of the neighbourhood(Reference Park, Neckerman and Quinn34), food store appearance and the quality of available fresh produce(Reference Sharif, Albert and Chan-Golston35). Although evidence among adult SNAP participants suggests overall lower diet quality scores compared with non-participants(Reference Andreyeva, Tripp and Schwartz4), additional research is needed among ethnic minority populations participating in SNAP to understand potential differences in dietary intake and food access that can be better targeted in SNAP programming.
The documented decrease in FI and healthier nutrient intake for SNAP participants post-ARRA SNAP expansion in this sample of Puerto Ricans has potential positive downstream health implications. Previous research in this cohort has shown that food-insecure participants with diabetes had significantly lower diet quality scores compared with food-secure participants with diabetes, and this lower diet quality was associated with poorer glycaemic control(Reference Berkowitz, Gao and Tucker36). Likewise, AHEI-2010 was inversely associated with 2-year cardiometabolic risk factors in this cohort(Reference Mattei, Sotos-Prieto and Bigornia25), further demonstrating the important role of healthier diets in preventing and reducing cardiometabolic risk in a low-income population. Low-income households consistently make trade-offs between food security, housing bills and medication(Reference Olson37, Reference Nord and Kantor38). SNAP continuity, during volatile times, and expanded eligibility and benefits may more effectively provide the necessary safety net that vulnerable households need to access sufficient, healthier foods without employing detrimental trade-offs. Thus, an adequately funded and executed food assistance programme, such as SNAP, has the potential to positively influence the health of individuals in low-income households through greater adherence to necessary medication(Reference Pooler and Srinivasan39), more resources allocated for healthy food that can protect against cardiometabolic diseases, attenuation of stress related to FI(Reference McClain, Xiao and Gao8) and reduction of unhealthy behaviours (e.g. excessive alcohol intake) often the consequence of stress and poverty(Reference Mulia, Zemore and Murphy28, Reference Ríos-Bedoya and Freile-Salinas30). As a result, SNAP expansions have the potential to contribute healthier individuals to the US workforce(Reference Sullivan, Ghushchyan and Wyatt40) and to reduce US health disparities and the associated $US 229 billion in direct medical care expenditures(Reference LaVeist, Gaskin and Richard41).
Our study had several limitations. First, our sample size was small, preventing us from having an ideal comparison group, either eligible non-participants or ineligible non-participants with incomes between 150 and 250 % of the federal poverty line. New and discontinued participant categories were also small and may be a reason we did not detect many changes in nutrient intakes and AHEI-2010 scores by SNAP participation status, although testing differences by participation status rather than by eligibility provided unique insights. Additionally, pre-ARRA data on FI were from the baseline visit, collected between 2004 and 2007, and may have resulted in some participants being misclassified immediately preceding ARRA initiation.
Our study had several strengths. First, the study used a valid and reliable assessment of FI, the ten-item adult food security survey module which is used to track national FI prevalence(Reference Hamilton, Cook and Thompson13), and a valid assessment of dietary intake for Puerto Ricans(Reference Tucker, Bianchi and Maras42). Likewise, we were able to adjust our models for a number of important factors correlated with SNAP participation and dietary intake, and influential to low-income Puerto Ricans in this cohort. The longitudinal design provided the opportunity to assess post-ARRA values while controlling for pre-ARRA values, rather than assessing values at two time points using different cross-sectional samples, like NHANES. Additionally, because of the large proportion of individuals in this cohort participating in SNAP, we were able to test differences by sustained, new or discontinued participation status, rather than solely eligibility.
Conclusions
Our findings demonstrate the importance of SNAP continuity and expanded eligibility and benefits, especially during an economic downturn, in protecting individuals and households from FI, as well as positively shaping dietary intake. Future research should add to our findings by addressing adequacy of SNAP benefits(43), investigating the added impact of participation in SNAP-education programming, focusing more on vulnerable and minority populations, and reducing barriers to SNAP participation.
Acknowledgements
Acknowledgements: The authors thank Dr Sara Bleich for her input on the methodological approach.Financial support: The BPRHS was supported by the National Institutes of Health (NIH), National Institute on Aging (grant number P01-AG023394); and by the US Department of Agriculture, Agriculture Research Institute (grant number 58-1950-7-707). A.C.M. received support for this study from an NIH Ruth L. Kirschstein Institutional Training Grant Postdoctoral Fellowship (grant number 5 T32 DK 7703-23). J.M. received support for this study from an NIH–National Heart, Lung, and Blood Institute Mentored Career Development Award to Promote Faculty Diversity (grant number K01-HL120951). The NIH and the USDA had no role in the design, writing or analysis of this article. Conflict of interest: None. Authorship: A.C.M. developed the study questions and design, analysed and interpreted the data, and wrote the manuscript. J.M. assisted with developing the study questions and design, interpreting the data, and critically revising the manuscript. L.M.F. and K.L.T. contributed to the study questions and design and to revisions of the manuscript. All authors read and approved the final manuscript. Ethics of human subject participation: This study was conducted according to the guidelines laid down in the Declaration of Helsinki and all procedures involving human subjects were approved by the Institutional Review Boards at Tufts Medical Center and at Northeastern University. Written informed consent was obtained from all subjects.
Supplementary material
To view supplementary material for this article, please visit https://doi.org/10.1017/S1368980019002209


