INTRODUCTION
With the emergence of the severe acute respiratory syndrome (SARS) and avian influenza in Asia, and the increased threats of terrorism in Europe and United States, the need for strategies to detect and respond rapidly to biological and chemical disasters has taken new urgency. Scotland experienced large-scale outbreaks from 1998 to 2002, such as a large outbreak of Escherichia coli O157 (VTEC) due to contaminated food, an outbreak of Clostridium novyi among injecting drug users, and an outbreak of cryptosporidium due to contaminated water supplies [1–Reference Cotruvo3]. Preparedness for these types of incidents is crucial, especially during high-profile events such as the G8 Summit, a meeting of the leaders of eight major world economies, and its related events – anti-globalization demonstrations and life concerts – that attract hundreds of thousands of people into cities nearby the Summit venue.
Public health agencies in the United States, Europe, Australia and Japan implemented innovative surveillance methods for high-profile events in order to early-detect a covert bioterrorism attack or a natural outbreak of infectious diseases [Reference Fleischauer4–Reference Osaka, Takahashi and Ohyama7]. Referred to as syndromic surveillance, these new systems can potentially identify disease clusters before conventional surveillance methods.
Health Protection Scotland (HPS) was able to establish a multi-source syndromic surveillance system in 18 weeks time for deployment to rapidly detect outbreaks, including chemical and bioterrorism attacks, during a 2-week period (4–15 July) around the G8 Summit at Gleneagles, 6–8 July, in Scotland. A multi-source system, which compares information derived from several data sources, some of which are more sensitive than others, can assess whether or not a trend observed in any single data source is confirmed by the other data sources and identify simultaneous and unexpected but concordant variations in datasets that may suggest an actual disease outbreak [Reference Pavlin8]. This paper describes the methodology, challenges and results of implementing a multi-source syndromic surveillance system for a high-profile event.
METHODS
Surveillance system objective
The objective of the syndromic surveillance system was to ensure early recognition of disease outbreaks, whether natural or intentional, in areas surrounding the G8 Summit venue and the delegates' hotels, and in the nearby areas where demonstrations were planned, in order to provide rapid public health follow-up and control of outbreaks.
Surveillance period
The system operated over a 12-day period (4–15 July 2005), starting 2 days before the Summit, to test the system, and finishing 7 days after the Summit, to cover the peak risk period for bioterrorism-related agents without making excessive demands on the data providers.
System operation
Sites and data sources
The system integrated non-specific health information from multiple data sources, located near or at the Summit venue (Fig. 1). Data were captured on coded discharge diagnoses from two General Practice (GP) medical surgeries and from the on-site clinic at the Summit venue; coded triage diagnoses from two Accident & Emergency (A&E) departments; daily counts of microbiological specimens submitted to three laboratories, and staff absenteeism from the hotel occupational health services at Gleneagles. NHS Scotland operates a nurse-led telephone hotline for health advice and patient referral, ‘NHS 24’ (http://www.nhs24.com/html/content/default.asp), similar to NHS Direct (http://www.nhsdirect.nhs.uk/) in England and Wales. NHS 24 is highly integrated into primary medical care in Scotland, and therefore our system included daily NHS 24 call data.
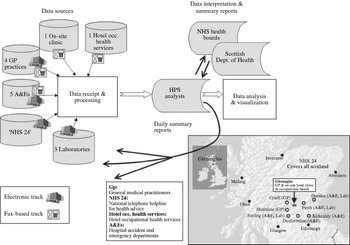
Fig. 1. Data sources and flowchart of information of the multi-source surveillance system, 4–15 July 2005, Scotland.
Concurrently with the electronic system, each participating site and six additional clinical sites – three GP and three A&E – were enrolled to use a fax-based system, adapted from a system used by the Centers for Disease Control and Prevention (CDC), USA during large public events, to provide immediate warnings to HPS of severe and unexplained illnesses in presenting individuals [Reference Fleischauer4].
Figure 1 shows the eight towns [Auchterarder (Gleneagles), Crieff, Dunblane, Stirling, Dundee, Perth, Kirkcaldy, and Dunfermline] covered by the A&E, GP and Laboratory components of the surveillance system (combined population 623 200). The NHS 24 component covers 5·5 million people, namely all of Scotland. The A&E departments were main referral hospitals, with each on average encountering 25 000–50 000 annual acute care visits. The three microbiology laboratories were attached to the referral hospitals. Each GP included in the system has on average 800 weekly contacts with patients. NHS 24 receives a daily average of 2400 calls.
Syndrome definitions
The bioterrorism agents that the syndromic surveillance was designed to detect included anthrax, plague, smallpox, botulism, viral haemorrhagic fevers and tularaemia. The system was also designed to pick up symptoms related to common infectious diseases (e.g. norovirus) and unusual ones (e.g. avian influenza and SARS).
We converted patients' symptoms and NHS 24 hotline calls into syndromes (Table 1). We monitored the daily number of orders for 12 categories of microbiology laboratory tests that were entered daily into laboratory databases. Syndromes and their definitions differed between data sites, as data providers operated different types of electronic information systems, and it was not possible to extract the same type of data from all the systems. Syndromes were monitored among persons of all ages. For the GPs, we used the syndrome categories and definitions developed by CDC and the USA Department of Defence Global Emerging Infections System [9]. The standardized terminology used by participating GPs was Read Codes to specify the syndromes [10]. The A&E nurses used the Manchester Triage System to identify patients' chief complaints [11]. They chose one of 52 flow-charts to conduct a structured interview with patients presenting at A&E and then assigned a triage level from 1 (immediate care needed) to 5 (care within 4 hours). NHS 24 nurses used clinical decision support software to respond and triage calls.
Table 1. Syndromes by electronic data source and laboratory test orders used in the syndromic surveillance system, 4–15 July 2005, Scotland
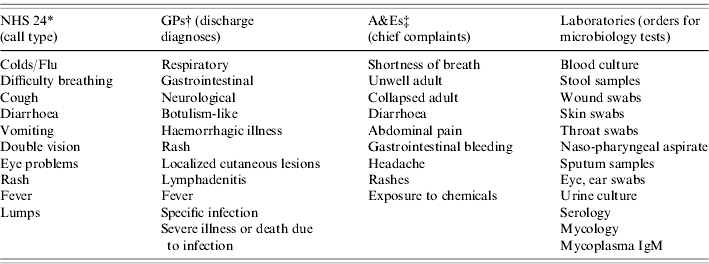
* NHS 24 is a national telephone helpline for health advice and patients' referral.
† General medical practitioners.
‡ Hospital accident and emergency departments.
When a person described multiple symptoms, NHS 24 or A&E staff used detailed guidelines to choose the major symptom, and the person was categorized into only one syndrome. At GP surgeries and laboratories, a person with multiple symptoms was matched up with several syndromes. Multiple visits by an individual patient due to the same episode of illness might have been grouped several times into the same or into different syndromes. Automated assignment to syndromes, using automated queries in each provider's electronic databases, was done locally by data providers for NHS 24, laboratory data, and A&E; and centrally by HPS for GP data.
Data transfer and processing
Every afternoon and 7 days per week, the data providers transmitted data files containing non-identifiable patient data to HPS. A coordinator at each data site was responsible for ensuring accuracy and completeness of the data files. If a file was not received by 17:00 hours, we contacted the local coordinator to obtain the data. The data was held in line with the guidance in the Confidentiality and Security Advisory Group for Scotland report [12]. Each afternoon, we received the files and monitored them for daily data completeness, as the percentage of data sources emailing us the complete files within the appropriate interval of submission. Finally, we copied them for analysis in data provider-specific Microsoft Office Excel files (Microsoft Corp., Washington, USA).
Daily files covered the previous day's data (midnight-to-midnight to fit in with the providers' own workflows) and contained the following information about patients: date and time of visit, age in years, sex, home postcode sector, disposition, and the syndromes of interest.
For the fax-based system, the data providers were asked to fax a form within 2 hours of seeing a patient with an exceptional or unusual clinical presentation to HPS and to phone promptly a 24-hour hotline to inform HPS that a fax was sent. The surveillance form contained similar data elements to the electronic files.
Data analysis and statistical methods
We analysed historical data by syndrome and data provider, to estimate the baseline number of each syndrome expected on each day from each provider. The amount of historical data available for each provider was: 2 months and 6 months for the two GP surgeries; 3 months, 3 months, and 8 months for the three laboratories; 1 month for the two A&E departments; and 12 months for NHS 24. Since the surveillance system was only operational for 12 days, and had a dedicated team of analysts and public health experts we implemented statistical detection methods with parameters set such that the sensitivity was more important than the specificity (i.e. a high false-positive rate was acceptable).
The first method, the Poisson cumulative sum-based (CUSUM) method, was applied to all the datasets, and was intended to detect a slowly building rise. We used a Poisson CUSUM with time-varying expectations to allow the daily counts to be different on weekends [Reference Rogerson and Yamada13, Reference Hawkins and Olwell14]. A ‘signal’ was triggered in the system, when the cumulated differences in observed and expected counts exceeded a predetermined threshold. The parameters of the CUSUM were set such that the time between false alarms (ARL0) for any one CUSUM was 400 days. The high number of syndromes and data providers meant that we ran 102 daily CUSUMs, leading to a high number of false alarms. Statistical analyses were carried out using stata version 7 (Stata Corp., College Station, TX, USA), including our own program to calculate the Poisson CUSUM.
The second method, a version of the Exceedance Method by Farrington (FARR), was applied to all the datasets, and was intended to detect an acute and localized increase of syndrome counts [Reference Farrington15]. The original Exceedance Method was devised for weekly organism counts and the expected counts for week i in year j were obtained from a Poisson regression model fitted to data from weeks (i – 3), (i – 2), (i – 1), i, (i+1), (i+2), (i+3) in the previous 5 years, years j – 1, j – 2, j – 3, j – 4, j – 5. The regression model had linear terms for week and year. In our case we did not have historical data and so had to modify the method. Daily expected syndrome counts were calculated using an over-dispersed Poisson regression model incorporating a term to differentiate weekend days from weekdays. For FARR, we used three different moving baseline periods to fit the models: the previous 7 days, days 3–9 in the past, and days 3–30 in the past, i.e. the previous 4 weeks. The first two corresponded to C1 and C2 reference periods of Hutwagner et al. detection algorithms [Reference Hutwagner16]. Each of these moving baseline periods provided the data points (7, 7 and 28, respectively) with which to estimate the parameters of the model, ![]() , where y i is the observed syndrome count in day i of the moving baseline period, w i, is an indicator differentiating weekdays from weekends, and μ, β are the weekday average parameter and weekend increment parameter, respectively. y i was assumed to follow an over-dispersed Poisson distribution. The moving baseline periods were chosen to respond to potentially different recent trends during the surveillance period. A ‘signal’ in the system was defined as a statistically significant increase, at the 5% significance level, in observed syndrome counts in excess of expected syndrome counts. Statistical analyses were carried out using R (http://www.r-project.org/).
, where y i is the observed syndrome count in day i of the moving baseline period, w i, is an indicator differentiating weekdays from weekends, and μ, β are the weekday average parameter and weekend increment parameter, respectively. y i was assumed to follow an over-dispersed Poisson distribution. The moving baseline periods were chosen to respond to potentially different recent trends during the surveillance period. A ‘signal’ in the system was defined as a statistically significant increase, at the 5% significance level, in observed syndrome counts in excess of expected syndrome counts. Statistical analyses were carried out using R (http://www.r-project.org/).
Every day, we produced summary graphs for individual syndromes by data provider and by detection method, and a list of signals triggered by the three methods.
Investigations
Every day each signal was assessed using a decision algorithm, adapted from a phased approach derived from CDC, to determine whether to proceed with more advanced investigations of signals (Fig. 2) [Reference Hutwagner17]. This entailed data validation, including checking for coding errors; identifying if the signal was reflected in other data sources; estimating the number of cases involved in the signal; and characterizing the cases according to person, place, and time. If consequently, we suspected a true disease cluster, we contacted the data providers or the local public health authorities (LHA) to obtain additional clinical and epidemiological information about the cases. If needed, we liaised with the LHA to mount local investigations, such as on-site reviews of patients' records and/or full epidemiological investigations of cases.
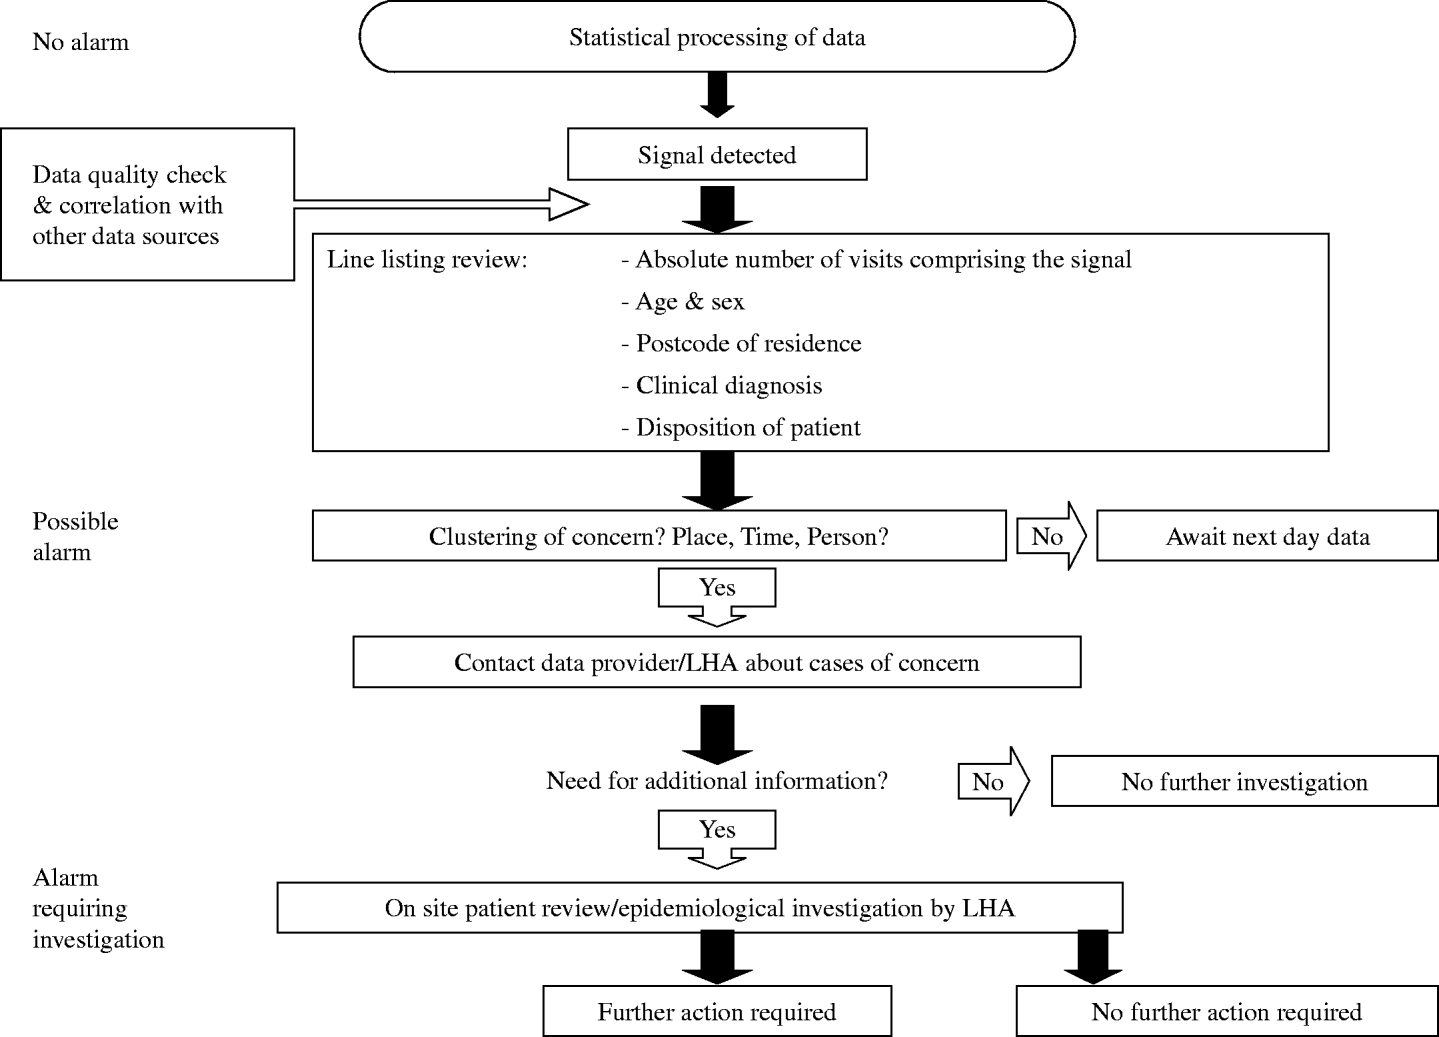
Fig. 2. Decision algorithm of the multi-source surveillance system, 4–15 July 2005, Scotland. LHA, Local public health authorities.
We determined the predictive value positive (PVP) of the surveillance system by identifying the proportion of signals triggered by the system and fully investigated by us, that represented true disease clusters.
Data reporting and communication
Every day, between 18:00 and 19:00 hours, we distributed summary graphs of the data analysis on a password-protected web interface to data providers, local and national health authorities. Subsequently, we compiled a daily situation report, which was emailed to the same colleagues and was discussed daily at a teleconference between HPS and the health authorities. The LHA prepared reports on local epidemiological investigations.
Response preparedness
One month before the Summit, the LHA and HPS devised and tested a tabletop exercise for the rapid deployment of a coordinated and effective response for health protection emergencies during the Summit. HPS also conducted refresher training for clinicians and other first responders in recognizing and managing diseases due to the exposure of chemical, biological and other infectious disease agents; and training for LHA on investigating and responding to unusual outbreaks.
Human resources
Six and half full-time staff were involved in the 2-week operation of the system: one consultant epidemiologist, two epidemiologists, one data manager, two statisticians, and one administrative staff. We relied upon the LHA to carry out local investigations. Every data provider nominated a data coordinator.
RESULTS
The PVP of the surveillance system was 8% (1/13) by including fully investigated signals into the analysis. No disease cluster of public health importance was detected outside of the system.
For GPs and laboratories, the daily data completeness during the surveillance period was 100%. The A&E departments and NHS 24 failed to transmit data on the last surveillance day and the laboratories had daily backlogs of 3–4 days.
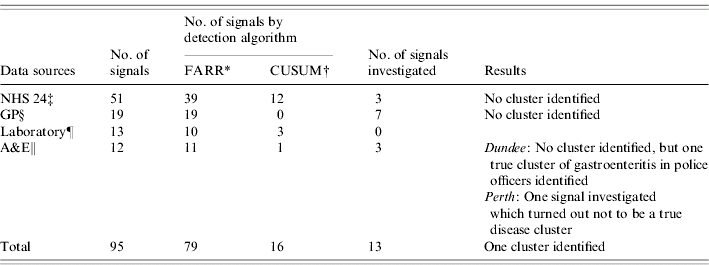
During the 12-day surveillance period, we analysed data that fitted the definitions of the pre-defined syndromes – 225 A&E visits, 188 GP visits, 2566 orders for microbiology tests, and 23 193 telephone calls for health advice. Ninety-five signals were triggered by CUSUM and FARR. Guided by our decision algorithm, we investigated only 13 of the 95 signals (Table 2). The data source NHS 24 triggered most signals, 51 of 95, accounting for 49% of the 79 signals produced by FARR, and 75% of the 16 signals produced by CUSUM. According to our decision algorithm, we investigated three of the FARR NHS 24 signals. We did not identify any disease cluster of public health importance. Nonetheless, for 7 days NHS 24 continuously triggered a signal (CUSUM) for the syndrome ‘Eye Problems’, which truly reflected the problem of hay fever conjunctivitis in the community.
Table 2. Number of signals by data source and detection algorithm, investigated during the surveillance period, 4–15 July 2005, Scotland
* Exceedance method by Farrington.
† Cumulative sum method.
‡ NHS 24 is a national telephone helpline for health advice and patients' referral.
§ Combined findings from the general medical practitioners in Auchterarder and in Dunblane.
¶ Combined findings from the microbiology laboratories in Dundee, Stirling, and Perth.
‖ Combined findings from the hospital accident and emergency departments in Perth and Dundee.
On six occasions, the same types of signals were confirmed in several data sources. There was no clustering by person and place and no other traditional surveillance system was alerting us at the same time. Five signals related to the syndrome ‘Rash’ were due to syndrome misclassifications. Two signals were further investigated, because they reflected a rise of a severe syndrome ‘Unwell adult/Immediate care needed’. No disease cluster was identified. Many cases presenting with non-communicable diseases at A&E departments were classified into the category ‘Unwell adult’ because of its unspecific nature.
On 7 July, we identified a true disease cluster by a signal triggered by ‘A&E Perth’. This data source triggered in total 4% of the 95 signals, and all were identified by FARR. We investigated two of them, mainly because one signal was triggered by both the fax and the electronic tracks and the other signal included severe cases admitted to the hospital. The local investigation revealed a true cluster of gastroenteritis among three police and one security officer at the Summit venue (Fig. 3). Our system was not the first one to detect the cluster. Nine hours before, an astute clinician at the hotel clinic phoned the on-call LHA to inform them about the cases. At the same time, the clinician used the fax-based track of our system to warn us about the cases; however, he neglected to phone the 24-hour hotline to inform us about the incoming fax. As it was night-time, there was nobody in HPS to receive the fax. Next morning, we acknowledged the fax and contacted the LHA to learn that they were already aware of the problem. The LHA and the police investigated the cases locally and implemented control measures. Our system provided the opportunity for additional case finding through rapid access to information about gastroenteritis presentations from multiple data sources. Our system, the LHA, and the police did not identify additional cases during the following days. We were reassured that the outbreak was not due to a deliberate release.
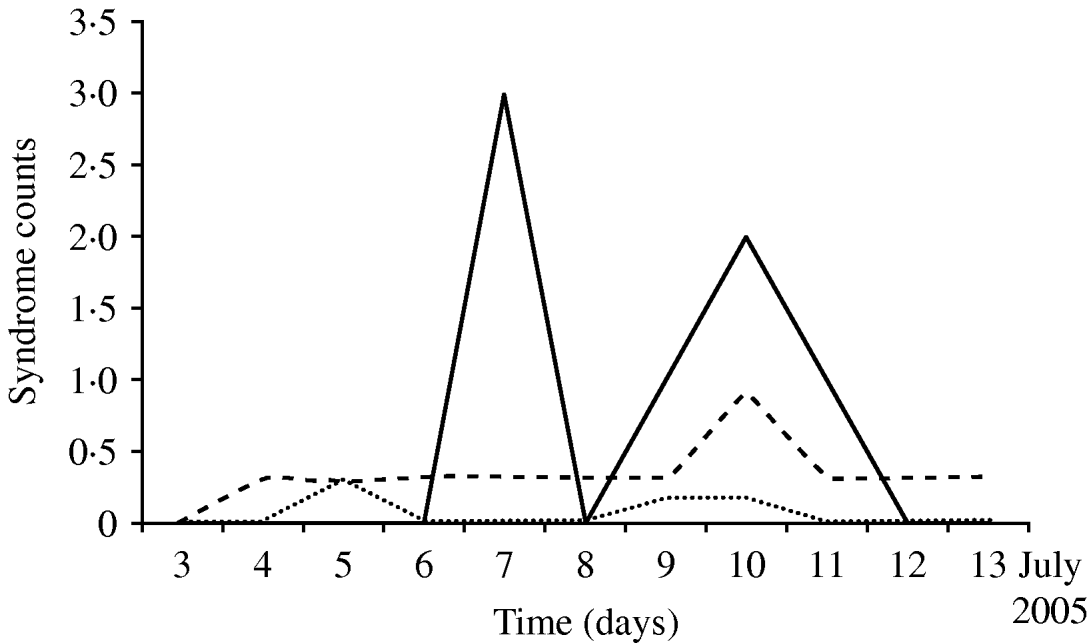
Fig. 3. Signals triggered by the Farrington detection algorithm for the syndrome ‘Severe Abdominal Pain’ at the Accident and Emergency department in Perth. Observed counts for the syndrome ‘Severe Abdominal Pain’ (—) crossed the statistical detection threshold (- - - -) on 7 July 2006; · · · · ·, expected syndrome counts. This signal reflected a true cluster of gastroenteritis in police and security officers at the Summit venue. The signal on 10 July was a false alarm.
DISCUSSION
Our surveillance system detected a cluster of gastroenteritis in police and security officers. Although the disease cluster was initially detected by a traditional surveillance system, our syndromic surveillance system complemented the traditional approach by rapidly uncovering the scope of the outbreak. This provided evidence that the outbreak was not due to a deliberate release. Similarly, the New York City Department of Health and Mental Hygiene (NYC/DOHMH) syndromic surveillance system proved to be most useful at enhancing traditional disease reporting in providing information on the pace and magnitude of city-wide outbreaks [Reference Steiner-Sichel18]. In our case, the rapid detection of the scope and nature of the outbreak was imperative as the same day we discovered the cluster of gastroenteritis, 7 July, terrorist bombings occurred in London. As a consequence, it was perceived that the G8 Summit venue may have been faced with a high threat of terrorist attack.
Only FARR detected the acute rise of syndrome counts related to a true cluster of gastroenteritis, because it performs well at identifying acute and localized outbreaks [Reference Farrington15]. The CUSUM performs well at detecting slowly emerging and widespread rises, and it detected the outbreak of hay fever conjunctivitis in the community in Scotland [Reference O'Brien and Christie19]. The use of two complementary surveillance methods, CUSUM and FARR was justified as neither one would have identified both situations. Rolfhamre showed that statistical algorithm performance varies according to outbreak shape, duration, and size [Reference Rolfhamre and Ekdahl20]. Indeed, we expect syndromic surveillance systems to detect a high diversity of threats, both natural and deliberate, however, it is less likely that one algorithm will be able to detect all of them.
The PVP of the system was low, as we deliberately lowered specificity in order to improve the sensitivity of the system. The cost of not detecting a chemical or bioterrorism event or a naturally occurring outbreak would have been enormous. Consequently, the level of false alarms was acceptable, as we wanted to be reassured that no outbreak was occurring when the system did not yield a signal. We thought that we had sufficient resources at our disposal to detect and investigate signals. The system provided a real sense of security that an intentional release of biological or chemical agents would be rapidly discovered. Similarly, it is mentioned in CDC's Framework for Evaluating Public Health Surveillance Systems that as long as the likelihood of terrorism is low, PVP will remain near zero. The PVP and the sensitivity for these surveillance systems need to be calibrated in each system to balance the benefits of early detection of outbreaks with the locally acceptable level of false alarm [21].
In our system, A&E data triggered few false alarms and identified a true cluster of gastroenteritis. A&E data have been shown in other surveillance systems to be useful for the early detection of outbreaks [Reference Fleischauer4, Reference Begier22, Reference Epsino and Wagner23]. We may have increased the PVP of A&E departments by combining chief complaints with discharge diagnoses for each patient, however, such information might have been less timely. The investigations of A&E signals were the most resource intensive, as each time a physician of the LHA had to travel to the A&E to check the medical records of the relevant patients, before providing feedback to us. A standardized medical record extract form would have been a useful tool for the investigations. Another problem was that LHA had insufficient personnel to carry out follow-ups of cases with no defined diagnosis, who were admitted into hospital. Likewise, Steiner-Sichel et al. reported that sometimes the time required to conduct investigations in the NYC/DOHMH system and retrieve diagnostic and epidemiological information negated the advantage of timely data acquisition [Reference Steiner-Sichel18]. Next time, a LHA may ask a neighbouring LHA as part of a formal cooperation and assistance request to provide personnel to help with the follow-up of the cases in the hospitals.
NHS 24 provided the largest amount of historical data to build our prediction models. It was well integrated into the primary care services in Scotland and hence it provided a large coverage of the Scottish population. A syndromic surveillance system based on NHS Direct call data has been in operation in England and Wales since 2001. An evaluation of the system in 2005 showed that it was timely, representative, useful, and acceptable with a low marginal cost [Reference Pavlin8]. Our NHS 24 data triggered many signals, three of which were investigated, but none were considered events of public health importance. The detection algorithms may be too sensitive for this data source, the data may not contain sufficient signal, or the spatial resolution (i.e. NHS 24 call centre) of our analyses was not fine enough. Another problem could have been that signs and symptoms related to a disease might not have been correctly assigned to the proper syndrome group. However, this could have been the case for every data source, as we did not have enough time to validate the syndrome categories by data source in our surveillance population. A data validation exercise would also have been useful in providing us with a better understanding of the data patterns, which assists signal investigations. We were able to rapidly deploy the system, because we used existing electronic health information systems; thereby we did not disrupt routine work of the data providers and we did not have to invest major resources into the set up of the system. However the running of the system, especially the local investigation of A&E signals may have benefited from additional resources and personnel to increase the timeliness of the investigations and to prevent disruption of day-to-day work of the LHA and the A&E staff. More preparation time would have provided us with sufficient time to validate the syndromes by data source, to involve the data providers and the LHA at an earlier stage of the project and better understand their expectations of the system. Hopefully this would also have led to less data delays and incompleteness during the set-up and the surveillance period.
CONCLUSIONS
The terrorist attacks on 7 July in London underlined the threat of terrorist attacks related to high-profile events. A syndromic surveillance system to rapidly detect an intentional or natural release of biological or chemical agents was implemented to improve the security of the delegates and the public during the G8 Summit 2005 in Scotland. The surveillance system was set up in a short time-scale, and successfully used multiple data sources and two different statistical algorithms to augment the capabilities of an alert frontline clinician at identifying a cluster of gastroenteritis among the police force. The system triggered interventions to prevent further cases. The local investigations of A&E signals were resource-intensive and more personnel and resources were needed as anticipated for the investigation of these signals. More preparation time for the set-up of the system, at least 1 year before the event, is important to consolidate good relationships with the data providers and the LHA and increase their ownership of the project, which is essential for a smooth and efficient set-up and operation of the system.
ACKNOWLEDGEMENTS
We thank Mike Heslop, Ann Smith, and Fernando Boero of Health Protection Scotland, UK; Julie Cavanagh, Simon Hilton, Gabby Phillips, Ross Martin, Roger Paterson, Colville Laird, Nancy Walker, Linda Imrie, Mike Johnston, Hamish Dougall, and George Savage from NHS Tayside, UK; Maria Rossi from NHS Grampian, UK; Henry Prempeh, Mike Williamson, Fraser Wright, Susan Lawson, and Elaine McRae from NHS Forth Valley, UK; Peter Baxter, Stella Williamson, and Kim Mclaren from NHS 24, UK; Aaron Fleischauer, Tracee Treadwell, Lori Hutwagner, and Joshua Mott from CDC, USA; Denis Coulombier from ECDC, Sweden; Sarah Thackway from New South Wales Department of Health, Australia; and P. A. Rogerson for their critical contributions throughout the project.
DECLARATION OF INTEREST
None.


