


Artificial sweeteners, also known as high-intensity sweeteners, low-calorie sweeteners, non-caloric sweeteners, intense sweeteners and non-nutritive sweeteners, are often used in combination with or as a substitute for sugar in foods and beverages because they contribute large amounts of sweetness with little to no energy( Reference Gardner, Wylie-Rosett and Gidding 1 , 2 ). The Food and Drug Administration (FDA) regulates the artificial sweeteners introduced as ingredients in food and beverage products. As of now, eight high-intensity sweeteners (saccharin, aspartame, acesulfame potassium, sucralose, neotame, advantame, stevia plant extract, Luo Han Guo extract) are approved by the FDA( 2 , 3 ) as safe for human consumption. The Acceptable Daily Intake, determined by the FDA, is the amount of artificial sweetener safe to consume in milligrams per kilogram of body weight per day (Table 1)( 2 ). According to the Academy of Nutrition and Dietetics, ‘a 40-pound child would need to eat twenty-four packets of aspartame or drink four 12-ounce cans of diet soda every day to reach this level’( Reference Ansel 4 ). Artificial sweeteners are found in consumable products beyond diet or low-calorie beverages, although the latter are the most commonly identified( Reference Popkin, Kenan and Hawkes 5 ) and consumed sources( Reference Ng, Slining and Popkin 6 ) of artificial sweeteners. Artificial sweeteners are also present in food products that are favourites of children and adolescents such as yoghurts, canned and dried fruit, granola bars, salad dressing and dips, bakery products, candy and ice cream( Reference Gardner, Wylie-Rosett and Gidding 1 , Reference Ng, Slining and Popkin 6 ).
Table 1 Acceptable Daily Intake (ADI) of artificial sweeteners approved by the Federal Drug Administration (adapted from https://www.fda.gov/Food/IngredientsPackagingLabeling/FoodAdditivesIngredients/ucm397725.htm#SummaryTable)
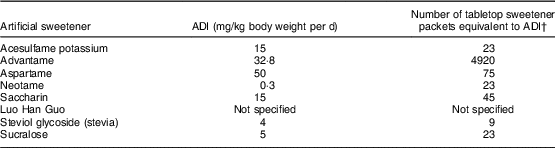
† Based on the amount a 60 kg (132 lb) person would need to consume to reach the ADI. Calculations assume a packet of high-intensity sweetener is equal two teaspoons of sugar in sweetness.
There are health benefits and concerns with artificial sweetener consumption for both adults and children. In adults, the consumption of artificial sweeteners can help reduce added sugar intake in the diet( Reference Gardner, Wylie-Rosett and Gidding 1 , Reference Fitch and Keim 7 ) and has been linked with positive diabetes management( Reference Anton, Martin and Han 8 ) and weight loss( Reference Peters, Wyatt and Foster 9 ). However, artificial sweetener consumption has also been linked with weight gain( Reference Parker, Gonzalez and Derby 10 – Reference Schulze, Manson and Ludwig 14 ), metabolic syndrome( Reference Pepino 11 , Reference Nettleton, Lutsey and Wang 15 ) and type 2 diabetes( Reference Pepino 11 , Reference Schulze, Manson and Ludwig 14 , Reference Nettleton, Lutsey and Wang 15 ) in adults. Literature reviews of artificial sweetener consumption and health outcomes share the same conclusion that there is insufficient evidence to encourage or discourage the use of artificial sweeteners for adults( Reference Lohner, Toews and Meerpohl 16 – Reference Shankar, Ahuja and Sriram 18 ).
Some researchers have examined the dietary purchasing and intake patterns of those who purchase or report consuming artificially sweetened beverages. One study analysed purchasing data from the Homescan longitudinal data set for 2000–2010 and the dietary intake from the National Health and Nutrition Examination Survey (NHANES) 2003–2010. Researchers reported that purchasing sweetened beverages (sugar-sweetened or artificially sweetened) exposes households to poor dietary purchasing and dietary intake patterns( Reference Piernas, Mendez and Ng 19 ). Another study used data from NHANES 2003–2012 waves to assess the diet quality of a nationally representative sample of over 22 500 adults. Those who consumed artificially sweetened beverages consumed more energy from foods that are low in nutrition but high in added sugars and energy than those who did not drink artificially sweetened beverages( Reference An 20 ).
The research conducted with children on artificial sweetener consumption is limited and also inconclusive. In a review of the literature conducted by Archibald et al., it was reported that early exposure to artificial sweeteners may negatively impact body composition and cardiovascular health but that additional research is needed( Reference Archibald, Dolinsky and Azad 21 ). Research on how artificial sweeteners influence weight status and associated indicators like BMI vary from aiding in weight loss( Reference Ludwig, Peterson and Gortmaker 22 , Reference de Ruyter, Olthof and Seidell 23 ) to having no impact on weight( Reference Kral, Stunkard and Berkowitz 24 – Reference Ebbeling, Feldman and Chomitz 28 ) to causing weight gain( Reference Blum, Jacobsen and Donnelly 29 – Reference Vanselow, Pereira and Neumark-Sztainer 34 ) in children and adolescents. Artificial sweetener consumption for children and metabolic syndrome onset have not been well studied to date( Reference Williams, Strobino and Brotanek 27 ).
Public consumption of food and beverage products containing artificial sweeteners is increasing for both adults and children( Reference Piernas, Ng and Popkin 35 – Reference Fakhouri, Kit and Ogden 39 ). Sylvetsky et al. reported a 200 % increase in artificial sweetener consumption for children from 2009–2012 NHANES data( Reference Sylvetsky, Jin and Clark 40 ) compared with 1999–2000 NHANES data( Reference Sylvetsky, Welsh and Brown 37 ). Artificial sweetener consumption increase is of interest since Mennella( Reference Mennella 41 ) suggests that the consumption of sweet foods, even energy-free foods, presents a problem for children because it is at this life stage that children are developing the preference for sweet that will translate into long-term preferences and consumption decisions. Sylvetsky et al. found that saccharin, sucralose and acesulfame potassium were present in breast milk of lactating mothers and presumably ingested by their infant( Reference Sylvetsky, Gardner and Bauman 42 ). There is recent evidence suggesting that women who consume artificial sweeteners while pregnant have larger babies and this weight is carried into childhood( Reference Azad, Sharma and de Souza 43 , Reference Zhu, Olsen and Mendola 44 ); and animal studies show that prenatal exposure to artificial sweeteners leads to an increased consumption of sweetened foods by the offspring later in life( Reference von Poser Toigo, Huffell and Mota 45 ).
Federal agencies and scientific organizations do not have a unified position on artificial sweetener consumption for children and/or adolescents. Many of the recommendations are not written specific to children and/or adolescents. The Academy for Nutrition and Dietetics( Reference Fitch and Keim 7 ), the American Diabetes Association( 46 ), the American Heart Association( 47 ) and Healthy Eating Research( 48 ) acknowledge that the FDA has approved a number of artificial sweeteners for consumption and these can be used as part of a healthy eating plan to decrease added energy from sugar and add variety to the diet for the general population.
Guidelines and recommendations written specifically for children are more restrictive and cautious. The WHO recommends that beverages containing artificial sweeteners not be marketed to children( 49 ). The Pan American Health Organization’s Nutrient Profile Model recommends that that any ‘ultra-processed’ food or beverage, which would include food and beverage products that contain any amount of artificial sweetener, not be marketed to children or found in the school environment, with the rationale being that the regular consumption of sweet food and beverage products (sugar-based or not) by children will promote the aforementioned intake and influence lifelong consumption patterns( 50 ). The National Academy of Sciences recommends that only high-school students be allowed to purchase beverages with artificial sweeteners on school property after the end of the school day and does not recommend foods with artificial sweeteners at all for students due to the lack of long-term evidence of safety when consumption begins in childhood( 51 ). The American Academy of Pediatrics calls for more research to show safety for children over time( Reference Murray and Bhatia 52 ). Finally, the Dietary Guidelines for Americans 2015 recommends for the public to reduce added sugar intake; noting that there may be short-term weight reduction by replacing added sugars with artificial sweeteners but it may not be effective in the long term( 53 ). The 2015 Dietary Guidelines Advisory Committee in the 2015 Scientific Report acknowledges that the recommendation to reduce added sugars may have unintentionally encouraged consumers and manufacturers to replace added sugars with artificial sweeteners. The Dietary Guidelines Advisory Committee goes on to state that added sugars should be reduced in the diet but not replaced with artificial sweeteners( 54 ).
In July 2014, federal nutrition standards for all foods and beverages sold and served outside school meals, referred to as ‘Smart Snacks’, took effect( 55 ). Smart Snacks establishes nutrition standards for foods and beverages sold or served on campus outside the school meal programme during school hours, henceforth known as competitive foods and beverages (CF&B). The Smart Snacks regulation is extremely detailed addressing various nutrition components of CF&B, including but not limited to sugars. Foods must have less than or equal to 35 % of weight from total sugars served. For the 2014–15 school year elementary and middle schools can only sell plain water, 100 % fruit/vegetable juice, 100 % fruit/vegetable juice diluted with water but no caloric sweeteners, low-fat unflavoured milk, or fat-free flavoured or unflavoured milk. High schools are allowed to also sell other flavoured and/or carbonated low-calorie beverages that would include beverages sweetened with artificial sweeteners( 55 ). Otherwise, states and districts have the option to address the use of artificial sweeteners in CF&B( 56 ).
Although the FDA has deemed a number of artificial sweeteners as safe( 2 , 3 ), consumption by children raises concerns from health professionals and the general public( Reference Pepino 11 , Reference Fowler, Williams and Resendez 12 , Reference Sylvetsky, Jin and Clark 40 , 51 , Reference Sylvetsky, Greenberg and Zhao 57 – Reference Agüero, Dávila and Escobar Contreras 59 ). The research is inconclusive as to whether artificial sweetener consumption assists in maintaining a healthful weight status, especially for children. Globally and nationally recognized health organizations such as the WHO, the Pan American Health Organization, the National Academy of Sciences and the American Academy of Pediatrics recommend food and beverage products containing artificial sweeteners not be marketed to children and adolescents or available for sale at school to children in elementary or middle school until further research is available related to consumption during childhood and long-term health and safety implications( 49 – Reference Murray and Bhatia 52 ). The objective of the present study was to provide a baseline assessment of the extent to which state laws and school district wellness policies for school food authorities (SFA) nationwide address restrictions on the use of artificial sweeteners in CF&B.
Methods
On-the-books school district wellness policies and related state laws were collected as part of the National Wellness Policy Study. State statutes and administrative regulations, as well as any non-codified nutrition standards incorporated by reference into the state law, were collected for all fifty states and the District of Columbia using the subscription-based LexisNexis (www.advance.lexis.com) and Westlaw (www.next.westlaw.com) services, and collection was verified against publicly available secondary sources when possible( 60 – 64 ). District wellness policies were collected by Internet research with telephone follow-up using established methods( 64 ). District policies were collected for public SFA that participated in the National School Lunch Program and were included in the US Department of Agriculture’s School Nutrition and Meal Cost Study (SNMCS)( 64 ). District wellness policies were able to be obtained for 496 of the 518 SFA for which SNMCS included data, located in forty-six states and the District of Columbia. Policies were collected for the 2014–15 school year and reflect district policies and state laws in effect as of the day after Labor Day 2014, which was used as a proxy for the beginning of the school year. Because the present study was a documentary research study of on-the-books, codified state laws and district wellness policies, no human subjects were involved and so it was not subject to institutional review board approval. District characteristics were obtained from the National Center for Education Statistics Common Core of Data( 65 – 67 ). These characteristics included the racial/ethnic distribution of grade 1–12 students, the percentage of students eligible for free and reduced-price lunch (used as a proxy for socio-economic status (SES)), locale, district size measured by student enrolment in pre-kindergarten through 12th grade, and Census region.
All state laws and district wellness policies related to artificial sweeteners were coded separately by grade level of applicability (elementary, middle or high school) according to the five venues where CF&B can be sold or given away outside the school meal programme: vending machines, school stores, à la carte, class parties and fundraisers. Two variables were used to determine if a policy addressed limiting the use of artificial sweeteners in CF&B, one for food and a second for beverages. The policy was coded as a ‘0’ if there was no mention of the restriction; ‘1’ if a restriction was mentioned but not required, was required only for a percentage of food/beverage products or was time- or location-specific; ‘2’ if food/beverage products with artificial sweeteners were definitely restricted; and ‘3’ if there was a CF&B ban. For the purposes of Figs 1 and 2, states that had ‘0’ coded for all venues in all grade levels were considered to have no restrictions on artificial sweeteners in CF&B; states that had any venue in any grade level coded as a ‘1’ were considered to have suggested or weak restrictions on artificial sweeteners in CF&B; states that had any venue in any grade level coded as a ‘2’ were considered to have definitive limits or restrictions on artificial sweeteners in CF&B; and states that had any venue in any grade level coded as a ‘3’ were considered to have a CF&B ban.
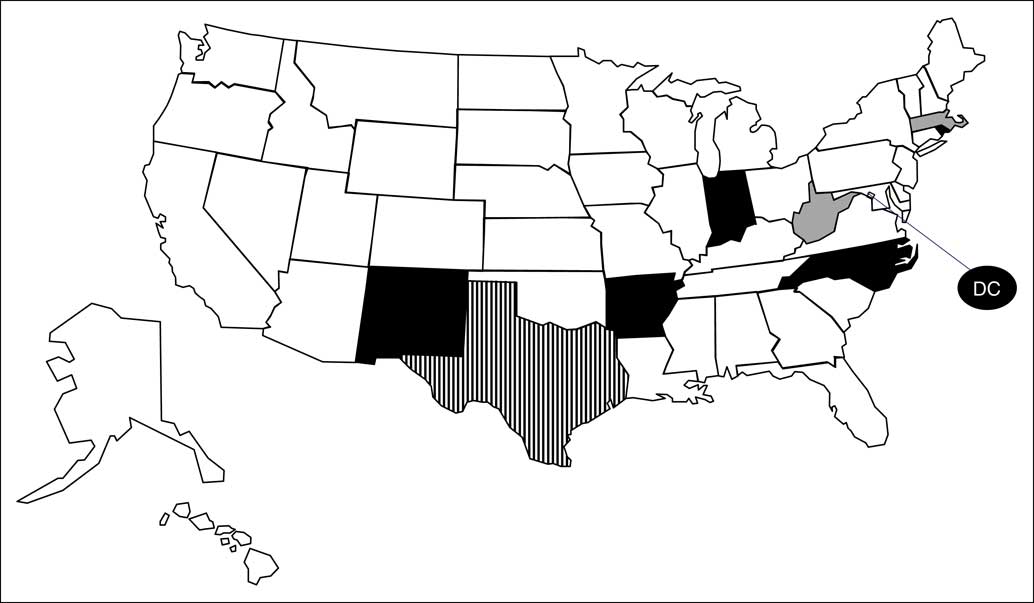
Fig. 1 US states that addressed artificial sweetener use in competitive foods, 2014–15 school year (
![]() , competitive food ban, n 6;
, competitive food ban, n 6; ![]() , definitive limits or restrictions, n 2;
, definitive limits or restrictions, n 2; ![]() , suggested or weak restrictions, n 1;
, suggested or weak restrictions, n 1; ![]() , no restrictions, n 42)
, no restrictions, n 42)
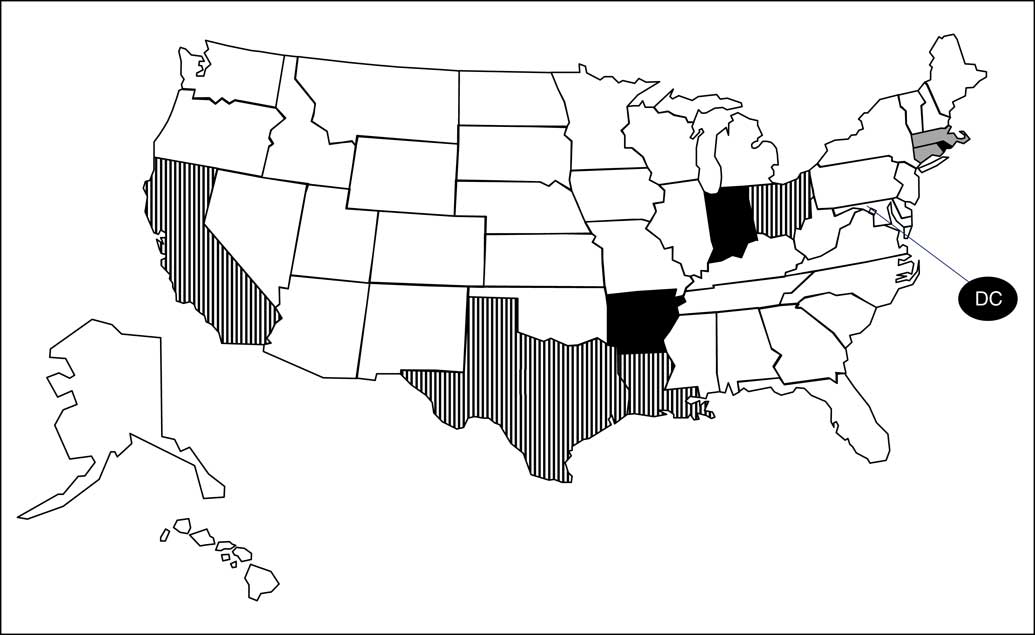
Fig. 2 US states that addressed artificial sweetener use in competitive beverages, 2014–15 school year (![]() , competitive beverage ban, n 4;
, competitive beverage ban, n 4; ![]() , definitive limits or restrictions, n 2;
, definitive limits or restrictions, n 2; ![]() , suggested or weak restrictions, n 4;
, suggested or weak restrictions, n 4; ![]() , no restrictions, n 41)
, no restrictions, n 41)
All analyses were performed in the statistical software package Stata/SE version 13.1. Frequencies were computed showing the prevalence of artificial sweetener provisions in state law. Due to the nature of the sample being based on the complex SNMCS SFA-level survey design, weighted percentages with linearized standard errors were computed to illustrate the prevalence of artificial sweetener provisions in district policies for SFA nationwide. The weighted data were adjusted for SNMCS SFA-level non-response, but not district wellness policy collection non-response. (For interested readers, unweighted data are presented in the online supplementary material, Supplemental Table 1.) SFA-level percentages across all grades were computed by treating each grade level as a separate observation (i.e. each district policy for an SFA would be associated with three observations, one for each grade level). Multivariate logistic regressions accounting for the survey design and weights were computed to examine whether district-level artificial sweetener policies were more likely in states with artificial sweetener policies, adjusted for district-level majority race, free/reduced-price lunch eligibility, locale, district size and Census region.
Results
Table 2 presents data on the characteristics of the districts whose policies were included in the study. Districts were majority (≥66 %) White (65·4 %) followed by multi-racial/other (19·2 %). There were slightly more districts of medium SES (38·7 %) than low SES (30·0 %) or high SES (31·3 %). Most districts were described as small (55·3 %), rural (45·3 %) and Midwestern (40·0 %).
Table 2 Characteristics of the district sample from all fifty states and Washington, DC, USA, 2014–15 school year (496 local school districts)Footnote †
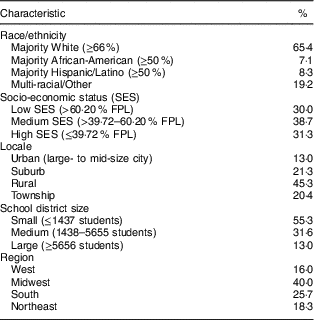
FPL, federal poverty level.
† n 471–496 due to item-specific missing data. Items may not total 100 % due to rounding. Weighted percentages are shown.
As of school year 2014–15, only six states’ laws (AR, DC, IN, MA, RI and TX) addressed artificial sweeteners for both CF&B. Nine states’ laws (AR, DC, IN, MA, NC, NM, RI, TX and WV) addressed artificial sweeteners in competitive foods (CF; Fig. 1). Ten states’ laws (AR, CA, CT, DC, IN, LA, MA, OH, RI and TX) addressed artificial sweeteners in competitive beverages (CB; Fig. 2). State laws were more likely to address artificial sweeteners in CB than in CF. Roughly, twice as many states’ laws addressed artificial sweeteners specifically (not through a CF&B ban) for CB (n 7) than CF (n 4).
Table 3 presents data on the district-level restrictions for artificial sweeteners in CF&B for each venue by grade level. Across all districts and grade levels, only 23·9 % of the districts’ wellness policies addressed any restrictions on artificial sweeteners for CF or CB (data not shown). Consistent with the state laws, artificial sweetener restrictions were more commonly addressed in district policies governing CB (as compared with CF) and for elementary schools (as compared with middle and high schools). District policy restrictions on artificial sweeteners in beverages were most likely to be suggested, or limits that did not apply at all times (‘suggested restriction’ in Table 3). Across all grade levels, district policy restrictions on artificial sweeteners in beverages were most commonly addressed for vending machines (20·0 (se 1·5) %); school stores (16·3 (se 1·3) %) and à la carte lines (16·0 (se 1·3) %). In contrast, in each venue at most 11 % of all district policies addressed restrictions on artificial sweeteners in CF and, for the most part, such restrictions were by virtue of a CF ban in elementary schools as opposed to a suggested or definitive restriction on artificial sweeteners in CF sold in schools (Table 3).
Table 3 Percentage of district wellness policies for school food authorities nationwide restricting artificial sweeteners in competitive foods and beverages (CF&B), by venue and grade level, all fifty states and Washington, DC, USA, 2014–15 school year (496 local school districts)Footnote †

† Because not all districts had all grade levels, n 482 at the elementary school level, n 472 at the middle school level and n 440 at the high school level. Estimates for all grades are based on 1394 district–grade combinations. Tables may not total 100 % due to rounding. Weighted percentages with survey-adjusted, linearized standard errors are shown. For interested readers, unweighted data are presented in the online supplementary material, Supplemental Table 1.
Finally, across all venues and in any grade level, the percentage of all districts with policies addressing artificial sweeteners in CF was 27·8 %, while 20·6 % of all districts were located in a state with a law addressing artificial sweeteners in CF (data not shown). The prevalence of artificial sweetener policies governing CB in any grade level of applicability or venue was somewhat higher than for CF: 37·3 % of district policies addressed artificial sweeteners in CB and 35·1 % of districts were located in a state with a law addressing artificial sweeteners in CB (data not shown). Table 4 presents results of multivariate logistic regressions examining the relationship between district and state artificial sweetener-related policies and laws, respectively, across all grade levels and locations of sale of CF&B. The adjusted prevalence of district artificial sweetener-related policies governing foods was 76·2 % with a state law as compared with only 14·9 % without a relevant state law. Similarly, the adjusted prevalence of district artificial sweetener policies governing beverages was 72·5 % with a state law v. only 17·9 % without a state law. (Adjusted OR and 95 % CI are presented in Table 4.) We found a similar association with state law CF&B bans (data not shown) but there were no significant associations with any of the sociodemographic controls.
Table 4 Multivariate logistic regression examining the relationship between state and district artificial sweetener-related policies, all fifty states and Washington, DC, USA, 2014–15 school year (471 local school districts)
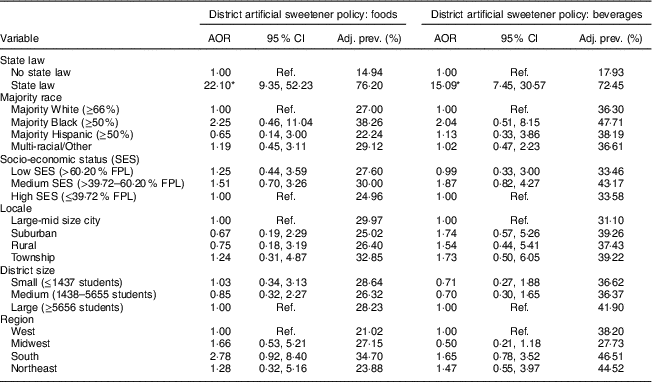
AOR, adjusted odds ratio; Adj. prev., adjusted prevalence; FPL, federal poverty level; Ref., reference category.
*AOR was statistically significant: P<0.001.
Discussion
To the authors’ knowledge, the present paper is the first to report on restrictions for artificial sweeteners in CF&B in state law and local school district policies for SFA nationwide. There are three main points this baseline assessment of restrictions for artificial sweeteners in CF&B in state law and local school district policies has produced. First, few states (thirteen states) and local wellness policies (23·9 % of district policies for all grades) address any restrictions on the use of artificial sweeteners in CF&B. The lack of restrictions on artificial sweeteners in CF&B could be due to a number of factors including but not limited to the FDA recognizing multiple artificial sweeteners as safe for consumption( 2 , 3 ), many scientific organizations endorsing the use of artificial sweeteners as part of a healthy diet to reduce sugar intake( Reference Fitch and Keim 7 , 46 – 48 ) and that restricting artificial sweeteners in CF&B is not a requirement of the Smart Snacks standards( 56 ).
Second, policies are narrow in scope. Policies tend to focus on CB over CF, younger grades over older grades, and are not inclusive of all venues. The emphasis on beverages may be due to public awareness campaigns( Reference Popkin, Kenan and Hawkes 5 ), public policies such as the Smart Snacks regulations( 56 ) and the work of various organizations, such as the WHO and the Centers for Disease Control and Prevention( 68 , 69 ), focused on reducing sugar-sweetened beverage intake, as well as efforts to enact sugar-sweetened beverage taxes( Reference Chaloupka, Powell and Chriqui 70 , Reference Powell, Chriqui and Khan 71 ). Additionally, beverage products containing artificial sweeteners are more abundant( Reference Popkin, Kenan and Hawkes 5 ) and more often identified( Reference Sylvetsky, Greenberg and Zhao 57 ) than food products containing artificial sweeteners, potentially contributing to a greater prominence in state laws and district policy.
Moreover, when policies with restrictions on artificial sweeteners in CF&B are written at the state or district level, it is most commonly for elementary-school student beverages followed by foods. Restrictions at the elementary level are more common for many areas of wellness( Reference Piekarz, Schermbeck and Young 72 ), not just restrictions on artificial sweeteners in CF&B. Policies restricting artificial sweeteners in CF&B are often not inclusive of all venues, specifically class parties and fundraisers, which is consistent with other literature( Reference Piekarz, Schermbeck and Young 72 ). These policies, if written, should be for the entire student body across all venues. Researchers( Reference Pepino 11 , Reference Fowler, Williams and Resendez 12 , Reference Sylvetsky, Jin and Clark 40 , Reference Sylvetsky, Greenberg and Zhao 57 , Reference Bruyère, Ahmed and Atlan 58 ) and national organizations( 51 , Reference Murray and Bhatia 52 , 54 ) are asking for more research to be initiated on artificial sweeteners because the long-term health implications for children and adults are unavailable.
As seen in other work( Reference Piekarz, Schermbeck and Young 72 – Reference Taber, Chriqui and Chaloupka 74 ), when a state law is in place, adoption and implementation at the district level are more likely. This holds true for policies related to artificial sweeteners in CF&B. While it is interesting to note that there are a handful of districts that have exceeded the expectations of the state and federal laws to include language restricting artificial sweeteners in foods and/or beverages, in most cases, districts are following states’ lead with regard to regulating artificial sweeteners in CF&B.
Third, policies are written as suggestions or encouragement rather than as definitive restrictions on artificial sweeteners in CF&B. It is important to remember that such a restriction is not a requirement of the Smart Snacks regulation( 56 ) and there are eight high-intensity sweeteners that are approved as safe for human consumption by the FDA( 2 , 3 ). The fact that the most prevalent policies addressing artificial sweeteners other than CF&B bans are suggested restrictions may imply that some districts may recognize the limited research available on the long-term impact of artificial sweetener consumption for children( 51 , Reference Murray and Bhatia 52 , Reference Sylvetsky, Greenberg and Zhao 57 ) but cannot justify a complete artificial sweetener ban because consumption of food and beverage products with artificial sweeteners is viewed as a method to reduce added sugars intake( Reference Fitch and Keim 7 , 46 – 48 ).
Strengths of the current study include that it provides baseline data for future research in the area of artificial sweeteners in CF&B. The results of the study come from a nationwide sample of district wellness policies and include a review of all state laws on the subject. Limitations of the study are that this research does not identify how or if these policies are being implemented at the school level and that the data are from the 2014–15 school year (last year of available data). Future studies should continue to monitor artificial sweetener policies at the state and district levels, particularly if federal regulations or guidelines change in this regard.
Conclusion
In conclusion, the current research shows that artificial sweeteners in CF&B is not commonly addressed in either state law or local wellness policies. When local wellness policies do address artificial sweeteners in CF&B, they are most often beverages in elementary schools, the restrictions are written as suggestions or encouraged, and they are more common in states with laws that also address artificial sweeteners. The lack of definitive artificial sweetener-related requirements is not surprising given artificial sweeteners in CF&B is not addressed in the Smart Snacks regulation( 55 , 56 ) and the FDA has approved eight high-intensity sweeteners for human consumption( 2 , 3 ). Continued monitoring of state law and local wellness policies with regard to restrictions on artificial sweeteners in CF&B needs to be conducted in tandem with research to address the long-term safety and health implications of regular consumption of artificial sweeteners as research is limited and inconclusive.
Acknowledgements
Financial support: Funding for this study was provided as part of the US Department of Agriculture School Wellness Policy Cooperative Agreement (USDA-FNS-OSP-SWP-15-IL-01). The US Department of Agriculture had no role in the design, analysis or writing of this article. Conflict of Interest: None. Authorship: R.M.S. developed the research question, and wrote the introduction, results and discussion sections; J.L. performed the statistical analysis and wrote the methods section; E.P.-P. assisted in drafting and editing the manuscript; J.F.C. assisted in framing, drafting and editing the manuscript. Ethics of human subject participation: Because this was a documentary research study of on-the-books, codified state laws and district wellness policies, no human subjects were involved and so the study was not subject to institutional review board approval.
Supplementary material
To view supplementary material for this article, please visit https://doi.org/10.1017/S136898001800143X


