The methods used to quantify dietary intakes can be divided into those involving direct weighing of foods and those in which participants are asked to estimate their consumption through portion-size measurement aids, such as household measures, standard units, digital shapes, mounds and photographs( 1 ). Currently, nutritional assessment recommends the use of approaches which are of low respondent burden, such as food photographs( 1 – 3 ). The use of images has generally been acknowledged as reliable and easy, enhancing the accuracy of measurements, particularly in large-scale studies( Reference Merten, Ferrari and Bakker 4 – Reference Robinson, Morritz and McGuiness 7 ). Food photographs can present various portions representative of the range of portion sizes usually consumed by the surveyed population and can be age-specific( Reference Foster, Matthews and Nelson 8 , Reference Foster, Adamson and Anderson 9 ).
The validity of using food photographs in portion size estimation has been studied in adults( Reference Turconi, Guarcello and Berzolari 5 , Reference Cypel, Guenther and Petot 10 – Reference Naska, Valanou and Peppa 18 ), children( Reference Turconi, Guarcello and Berzolari 5 , Reference Foster, Matthews and Lloyd 6 , Reference Lillegaard, Øverby and Andersen 19 – Reference Trolle, Vandevijvere and Ruprich 21 ) and adolescents( Reference Turconi, Guarcello and Berzolari 5 , Reference Foster, Matthews and Lloyd 6 , Reference Naska, Valanou and Peppa 18 , Reference Lillegaard, Øverby and Andersen 19 , Reference Vereecken, Dohogne and Covents 22 ). According to Nelson et al., food photographs can generally be evaluated in terms of the respondent’s perception, conceptualization and memory( Reference Nelson, Atkinson and Darbyshire 23 ). Perception refers to a person’s ability to relate a particular photograph to a food quantity that is actually presented. Conceptualization has been defined as the ability to develop a mental picture of an amount of food and to relate that to a photograph, and memory is the ability to accurately recall an amount of food consumed( Reference Nelson, Atkinson and Darbyshire 24 ).
All three components are expected to be affected by photograph characteristics (e.g. the number of different portions displayed; the size of each picture; the range of portion sizes; the interval between portion sizes; the order of presentation; the food’s placement on the dish; the camera angle; lighting and colours; the volume and characteristics of the food, such as shape and firmness), as well as characteristics of the study participants( Reference Nelson and Haraldsdóttir 25 , Reference Nelson and Haraldsdóttir 26 ). For instance, children younger than 10–11 years old are not able to: (i) realize that the size of objects in a picture depends on their eye distance; (ii) recognize that the volume may remain the same when the dimensions of the object change (e.g. a tall thin can compared with a short broad can); and (iii) conceive a reverse action (e.g. imagine a liquid in its original bottle)( Reference Foster and Adamson 2 ). Furthermore, children are not familiar with all food names, common household measures and food preparation procedures. Thus, nutrition research often relies on parents’ reports. Foster et al. reported that the parents of primary-school children were more accurate and precise in their estimates of intake than the children themselves( Reference Foster, Hawkins and Simpson 27 ).
The Hellenic Health Foundation (HHF), coordinator of the Greek national health and nutrition survey (HYDRIA, http://www.hhf-greece.gr/hydria-nhns.gr/index_eng.html), developed a web-based application (the HHF Nutrition Tool) to collect intake information through 24 h recalls (adolescents and adults) or recording a food diary (children up to 10 years old). Making use of the US Department of Agriculture Automated Multiple Pass Method( Reference Conway, Ingwersen and Vinyard 28 , Reference Raper, Perloff and Ingwersen 29 ), the HHF Nutrition Tool guides the respondent through a 24 h reference period, providing multiple different opportunities to recall and describe details of food and beverage intakes. The HHF Nutrition Tool’s food list, facets and descriptors’ system have been developed to accommodate the LanguaL™ Food Description Thesaurus (http://www.langual.org/) and the FoodEx2 classification system of the European Food Safety Authority (http://www.efsa.europa.eu/en/datex/datexfoodclass.htm). The HHF team further developed the tool’s portion probes, including standard portions, household units and a food atlas including age-specific food pictures.
The present study aimed to assess how parents perceive the amount of food displayed in pictures taken to accommodate the eating habits of children up to 10 years old and to understand the net error introduced when the photographs are used to assess the children’s dietary intake. All photographs were taken and developed under well-defined, standardized and controlled conditions.
Methods
Parents of children aged from 3 months to 10 years were selected using convenience sampling. Based on the average sample size of studies assessing the relative validity of food pictures for children( Reference Foster, Matthews and Nelson 8 , Reference Higgins, LaSalle and Zhaoxing 30 ), the study aimed to include approximately 100 parents or caregivers of infants (3–11 months), toddlers (1–3 years) and children (4–10 years), representing the age and gender distribution of the country’s child population (Census 2011 of the Hellenic Statistical Authority).
Eligible participants were recruited from the campus of the University of Athens Medical School located next to the two largest children’s hospitals in the country, and from private paediatrician offices in different regions of the city. The study sample consisted of 138 parents/caregivers (forty-three males and ninety-five females), including university employees, students, hospital visitors and their relatives, as well as parents visiting the paediatrician. Participants did not have previous training on how to use portion-size measurement aids and were recruited to represent a range of educational backgrounds and sociodemographic characteristics, with an attempt to oversample females who are usually responsible for the child’s feeding and avoid the inclusion of individuals in nutrition-related professions. All subjects signed an informed consent before participation.
The food atlas
The photo atlas for children includes colour photographs of seventy-three series of simple foods (carrot portions, for instance) and recipes (e.g. vegetable stew), capturing the variability of local diets. The large majority (95 %) of the photo series present six portions in ascending order, with the smallest portion on the top left-hand side of each page. In the absence of data regarding children’s portions in Greece, the selection of foods and dishes was based on the recommendations of international projects( 31 ), guidance documents of European bodies( 3 , 32 ), as well as the dietary intakes of about 3000 adults participating in the Greek national nutrition survey (HYDRIA 2013–14). In a study assessing associations between the amounts served to and consumed by children and the amounts that their parents served themselves, Johnson et al. reported strong correlations between portions offered by caregivers and the amounts children consumed with a mean difference of approximately 20 % in energy intake between adults and their children( Reference Johnson, Hughes and Cui 33 ). Based on these findings, the 5th and 95th centiles of the intakes reported by Greek adults in 2013–14 were reduced by 20 % and corresponded to the quantities presented in the first and last picture in each photo series. The quantities presented in the intermediate pictures were estimated using equal increments on a log scale, based on the Weber–Fechner general psychophysical law( Reference Foster, Hawkins and Simpson 27 , Reference Lawless and Heymann 34 ).
Foods were displayed on two different types of plate (flat plates and bowls) of common white colour and no pattern. At the left and right of plates, a spoon, fork and knife were placed to serve as size reference. Photographs were taken by a professional photographer in a 60 cm×60 cm×60 cm photo studio (i.e. a cubic photo tent softening and reflecting the light). A rig of two Dr Fishcer 400 W lamps with diffusers for soft shadows was used to create optimal lighting conditions. The focus distance was 70 mm and the lens used was a Sigma 70–300 mm with shutter speed of 0·5 s and aperture set at f/22. The lens was placed at three viewing angles: 45° for spreads on slices of bread, 35° for cakes (to ensure capturing both height and width) and 52° for all other foods and dishes, including breakfast cereals.
The printed images were colour digital with the size of 89 mm×60 mm, allowing six photos to be displayed on a page. Portions appeared in a sequence of smallest to largest, the name (in Greek) was shown on the top of each series, but with no indication on the food weight displayed.
Study design
The study aimed to evaluate the perception of seventy-three series of food photographs commonly consumed by the Greek child-age population. Each photo series was evaluated through pre-weighed portions of foods that were shown to study participants. In particular, three different quantities were defined per picture: the middle quantity (Q2) corresponded exactly to the quantity presented in the image; the first (Q1) and the last quantities (Q3) were defined on the basis of Q2 and were somewhat smaller (Q1) or larger (Q3) than Q2. Specifically, Q1 was calculated as Q2 minus one-third of the gram difference between the quantity of the image to be evaluated and the preceding one; and, proportionally, Q3 was defined as Q2 plus one-third of the gram difference between the quantity of the evaluated image and the following one( Reference Naska, Valanou and Peppa 18 ).
Pre-weighed actual portions of various foods were displayed and participants were asked to indicate which food picture in the book best corresponded to the actual portion on the plate. In general, each of the eighteen portions corresponding to the six images included in a series was evaluated twice. In accordance with similar evaluations( Reference Hernandez, Wilder and Kuehn 15 – Reference Subar, Crafts and Zimmerman 17 , Reference Higgins, LaSalle and Zhaoxing 30 , Reference Johnson, Hughes and Cui 33 ), the food items displayed by session and the portions presented to study participants were randomly allocated, in order to avoid any pattern in participants’ replies, as well as to prevent contamination from one session to the other. In addition, the staff were instructed not to include more than two portions of the same food in one individual session so that the different portions of each picture series would be evaluated by at least eighteen individuals. In total, 2314 pre-weighed, actual portions were shown to the study participants, corresponding to an average of seventeen portions per participant. The session was concluded with the introduction of a brief evaluation questionnaire aiming to assess participants’ views on the quality and applicability of the photo series.
Statistical analysis
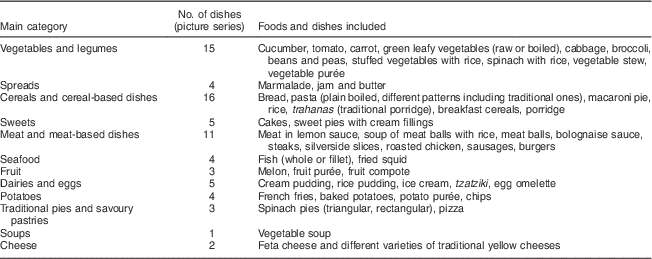
The pictures in each series were numbered from 1 (smallest) to 6 (largest amount) and replies were evaluated through calculating mean (sd) differences between the picture number which the respondents indicated and the picture number corresponding to the portion which was actually shown. Differences were compared using t tests. Since participants could not select a precedent to picture No1 or a subsequent to picture No6 image, the performance of pictures No1 and No6 was evaluated through estimating the distribution of correct, adjacent or distal selections, considering a random error of ±1 photo selection as acceptable( Reference Trolle, Vandevijvere and Ruprich 21 ). For the presentation of results, the seventy-three photo series were organized into twelve groups (Table 1). The effect of the type of food and parents’ personal characteristics on their selections was evaluated through unpaired t tests (gender and years of schooling) or through Tukey–Kramer pairwise comparisons (type of food, age, number and age of offspring). All analyses were performed using the Stata statistical software package release 11.
Table 1 Classification of foods and dishes included in the present study
Results
The personal characteristics of the study participants by number of offspring are presented in Table 2. By study design, the sample included more women than men (69 % females) and young adults (79 % were between 25 and 44 years of age), since having at least one child aged between 3 months and 10 years was the primary inclusion criterion. Among both genders, most parents/caregivers (87 % overall, 91 % of males and 85 % of females) had either one or two children (the fertility ratio in Greece is equal to 1·4 children per woman aged 15–49 years) and about 30 % of the study participants had not pursued higher education. Of note, participants with a lower educational level were more frequently parents of two or more children.
Table 2 Descriptive characteristics of the study participants, a convenience sample of Greek parents/caregivers (n 138) of children aged 3 months to 10 years, by number of offspring
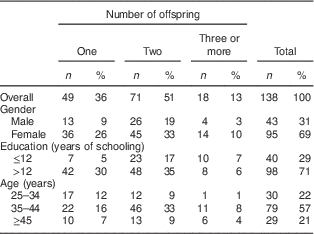
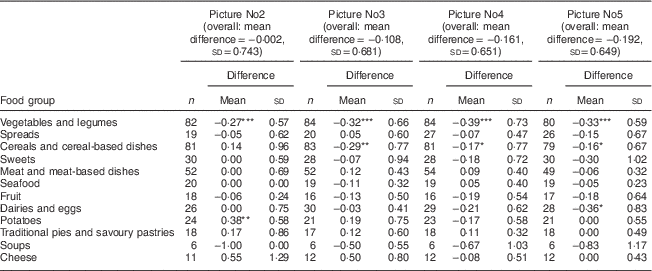
Table 3 presents the number of assessments performed and the mean differences in selections for pictures No2 to No5 per food group. A negative difference indicates the selection of a picture corresponding to a smaller quantity than the one actually shown on the plate and, correspondingly, a positive difference indicates the opposite. Providing that the food portion served on the plate represents the ‘true quantity’, negative differences point to images that led individuals to perceive the food quantity in the picture as larger than it actually was. Consequently, positive differences indicate images that led individuals to perceive the quantity in the picture as smaller than it actually was. Mean differences were more frequently zero or negative than positive and never exceeded one, suggesting that participants generally tended to select the correct or its adjacent portions. Overall, in 69 % of the assessments participants pointed to the correct image and in 97 % of the assessments they selected either the correct picture or its preceding or subsequent picture. Differences varied and were generally not significant. Exceptions were the pictures presenting ‘vegetable soup’ (differences were constantly negative, although not significant); ‘vegetables and legumes’ (differences were negative and significant); ‘traditional pies and other savoury pastries’ (differences were positive, although not significant); and pictures No4 and No5 of the ‘dairies and eggs’ (negative differences, but not significant). Results point to a possibility for an underestimation of the consumed quantity of ‘vegetables and legumes’ (including soups) and an overestimation of the consumed quantity of ‘traditional pies and savoury pastries’, if these pictures were used to quantify dietary intake in a survey setting.
Table 3 Number of assessments (n) and differencesFootnote †, mean and sd, between the picture number selected by each participant and the picture number corresponding to the actually displayed portion (pictures No2–No5 in all photo series)Footnote ‡; study participants are a convenience sample of Greek parents/caregivers (n 138) of children aged 3 months to 10 years
*Significant difference at 5 % level of significance.
**Significant difference at 1 % level of significance.
***Significant difference at 0·1 % level of significance.
† Differences estimated as (picture number selected)−(picture number of the displayed, actual portion).
‡ Level of significance of estimated differences evaluated through a t test.
Table 4 presents the frequency with which participants pointed to the correct, adjacent or distal pictures when they were presented with actual quantities corresponding to photo No1 or No6. For all food groups, participants indicated the correct or an adjacent picture in more than 80 % of the assessments. However, the percentage of individuals who indicated an adjacent or more distal picture was higher in the case of picture No1 of the ‘potatoes’ and picture No6 of the ‘vegetables and legumes’ photo series. In contrast to photos No2–No5 of the series presenting ‘traditional pies and savoury pastries’, the two borderline photos (No1 and No6) allowed an accurate perception of the quantity displayed.
Table 4 Number (n) and percentage (%) of selections of correct, adjacent or distalFootnote † food pictures (picture No1 and picture No6 in all photo series); study participants are a convenience sample of Greek parents/caregivers (n 138) of children aged 3 months to 10 years
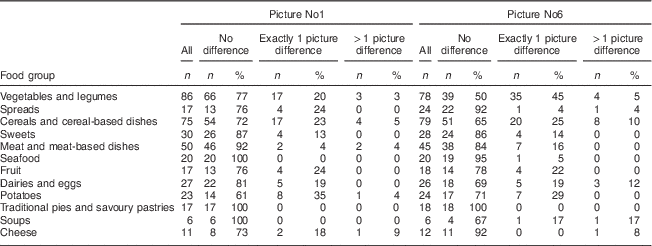
† ‘Correct’ corresponds to selections of pictures of the displayed portions; ‘adjacent’ corresponds to selections of picture No2, when the quantity in picture No1 was displayed, or selections of picture No5, when the quantity in picture No6 was displayed; and ‘distal’ refers to any other selection.
We additionally estimated the frequency of correct replies for all pictures in each series. Images of very small or very large portions performed better than the intermediate ones in the case of ‘cereals and cereal-based dishes’, ‘sweets’ and ‘spreads’. For all other food groups there was no consistent pattern in correct replies and we confirmed our previous finding that certain pictures presenting ‘potatoes’, ‘vegetables and legumes’ (including soups) and ‘dairies and eggs’ led participants to misjudge the portion presented. Moreover, we estimated the percentage frequency of correct selections by actual portion displayed, to assess whether participants who were presented with food quantity equal to the one of the image (Q2) selected the correct image more often than other participants presented with quantities somewhat smaller (Q1) or larger (Q3) than the one in the image. We noted that the percentage of correct replies varied among pictures and actual portions (data not shown). Nevertheless, this analysis again confirmed that participants encountered more difficulties in quantifying amorphous foods and liquid or semi-liquid dishes than solid foods. Hence, actual portions of soups, porridges, fruit and vegetable purées, as well as pies with various fillings were more frequently misclassified.
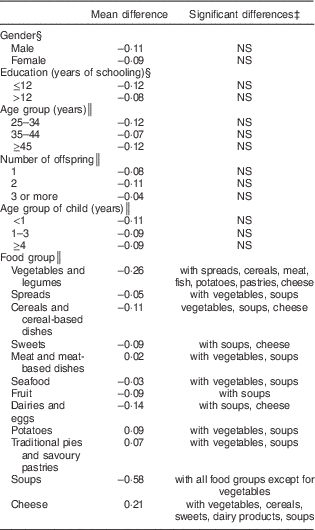
Table 5 describes mean differences between picture numbers by participants’ characteristics and food group. In almost all cases, mean differences were negative, but close to zero. There was no indication that personal characteristics (gender, age and educational background) were associated with differences in the way parents/caregivers perceived the food pictures. Furthermore, the way parents perceived the food quantities presented in the pictures was not associated with the number and age of their offspring. Regarding differences by food groups, the pictures of ‘vegetables and legumes’ led respondents to perceive the quantity displayed as larger than it really was; in a survey setting, this may lead to an underestimation of the true intake. Somewhat larger mean differences in perception were also observed in the cases of ‘soups’ and ‘cheese’, but the number of assessments was small (up to twelve assessments per picture).
Table 5 Mean differences in picture selectionFootnote † by participants’ characteristics and food group; study participants are a convenience sample of Greek parents/caregivers (n 138) of children aged 3 months to 10 years
† Differences estimated as (picture number selected)−(picture number of the displayed, actual portion).
‡ The detected significant differences across groups were defined by P<0·05, when using the Tukey–Kramer test.
§ The t test was used for comparisons.
║ The Tukey–Kramer test was used for comparisons.
Discussion
In a study to evaluate how well parents and caregivers of children aged 3 months to 10 years perceive food pictures, we noted that in most cases (69 %) the food pictures allowed an accurate perception of the quantity presented. Parents and caregivers, however, encountered difficulties in perceiving the quantities of ‘vegetables and legumes’ (including soups), ‘traditional pies and savoury pastries’ and ‘cheese’, although a small number of assessments were performed in relation to the latter category. The majority of participants (90 %) considered the use of the food atlas easy or relatively easy and only 3 % found the process relatively difficult or difficult (data not shown). When participants were asked to report which foods were more difficult to quantify, they indicated dishes of ‘dairies and eggs’ and ‘soups’. The quantification of ‘meat and meat-based dishes’ was reported as the easiest.
Our findings agree well to those of similar studies in children and adolescents. In a study among individuals aged 9–19 years, Lillegaard et al. reported that the correct portion was selected in 60 % of the measurements when participants were asked to correspond a portion size placed in front of them to one of four pictures presented in a photographic booklet( Reference Lillegaard, Øverby and Andersen 19 ). In a more recent study aiming to assess adolescents’ perception of digital food pictures, 28 % of participants selected the correct picture and 74 % the correct or an adjacent one( Reference Vereecken, Dohogne and Covents 22 ). Baranowski et al. conducted a study among 120 children aged 8–13 years, who were asked to indicate which digital food images corresponded better to food models presenting foods commonly eaten by children in varying portion sizes( Reference Baranowski, Baranowski and Watson 20 ). Approximately 60 % of foods were correctly classified and there were no differences in accuracy by the children’s demographic characteristics.
In general, the food atlas used in the present study allows a valid perception of the quantity displayed. Difficulties in perception were noted for the amorphous salads, soups, vegetables and legumes (the latter commonly consumed in Greece as soups), traditional pies and savoury pastries, some pictures in the series of breakfast cereals and a traditional porridge (trahanas). Problems encountered in quantifying amorphous liquid dishes (such as soups, porridge and similar), as well as the limited capacity of young adults to estimate the quantity of vegetables and whole grains served on the plate, have also been reported by others( Reference Venter, MacIntyre and Vorster 13 , Reference Subar, Crafts and Zimmerman 17 , Reference Trolle, Vandevijvere and Ruprich 21 – Reference Nelson, Atkinson and Darbyshire 23 , Reference Nørnberg, Houlby and Jørgensen 35 ). The reduced ability to quantify the consumption of Greek traditional pies and pastries through food pictures has also been observed in a similar study among adolescents and adults( Reference Naska, Valanou and Peppa 18 ). According to the present study, if the pictures of ‘vegetables and legumes’ (including soups) were used in a survey setting they could lead to an underestimation of true intake, whereas the pictures of ‘traditional pies and savoury pastries’ could lead to an overestimation of intake.
Similarly to previous studies we have also observed a flat-slope phenomenon( Reference Subar, Crafts and Zimmerman 17 ), in which large portions tend to be underestimated and small ones overestimated, as well as that the smallest portions were more often correctly perceived than the largest ones( Reference Ovaskainen, Pautri and Reinivuo 16 , Reference Lillegaard, Øverby and Andersen 19 , Reference Trolle, Vandevijvere and Ruprich 21 , Reference Vereecken, Dohogne and Covents 22 ). This might reflect difficulties encountered by individuals in perceiving the volume of large portion sizes, or a general hesitation to select the largest portions. In our study, the perception of quantities presented in pictures was not related to personal characteristics, as deviations from the expected selections occurred irrespective of participants’ gender, age, educational attainment, and number and age of offspring.
The present study aimed to identify errors introduced when individuals were asked to relate an amount of food displayed in reality to an amount presented in a photograph (perception), a process inherent in real-time data collections such as those of food diaries that are the recommended method for dietary assessment among children of this age( 32 ). Conceptualization and memory skills influence the accuracy of portion size estimations in dietary surveys based on recall methods( Reference Nelson, Atkinson and Darbyshire 23 ), which are preferentially applied in studies among adolescents and adults( 32 ). There is generally a lack of consensus on how to assess precision in portion size estimations and on how errors should be expressed so as to allow an objective interpretation of the findings( Reference Hernandez, Wilder and Kuehn 15 , Reference De Keyzer, Huybrechts and De Maeyer 36 ). Our study design, however, tried to replicate as closely as possible actual conditions, since it is highly improbable that participants will be presented with images showing the exact amount they consumed.
The present study was the first evaluating pictures of food portions consumed by young children in Greece and any background knowledge that could be useful in designing the study was limited to some small-scale, regional studies. However, when participants were asked to evaluate the appropriateness of the foods and recipes included in the atlas, more than half (56 %) of them indicated that the presented quantities reflected adequately the amount of food their offspring usually consumes and only 5 % replied that the presented quantities correspond to occasional, infrequent consumption.
Conclusion
In conclusion, most parents and caregivers reported that it was easy to use the food atlas when reporting the intake of their offspring. In addition, the series of photographs included in the food atlas for infants, toddlers and children in Greece adequately assisted parents in perceiving the presented quantities, except from the picture series presenting amorphous, semi-liquid or liquid dishes, and pies or pastries with a filling. Since these types of foodstuffs (e.g. soups, porridges and soft pies) are commonly consumed in the first years of life, improved series should be developed for the presentation of these dishes or other quantification means need to be sought in large-scale surveys addressing very young children. Mobile phone applications, which are increasingly used in survey settings, can be particularly useful when assessing liquid and semi-liquid food items consumed by this population group. These applications make use of the phone camera and card to record consumption through sending digital images, while more advanced applications combine imaging with voice recording through which study participants can verbally describe aspects of their consumption. In addition, studies evaluating the performance of food pictures as quantification anchors should ensure the inclusion of several and various amorphous foods in their assessment, particularly since these items are commonly consumed by infants and young children.
Acknowledgements
Acknowledgements: The authors would like to thank P. Karathanassis and K. Tsiotas for their contribution in the realization of the photo atlas and the operationalization of the study. Financial support: This research received no specific grant from any funding agency in the public or commercial sector. It was supported by the not-for-profit Hellenic Health Foundation. Conflict of interest: None. Authorship: E.V., A.N., A.B. and A.T. were responsible for the conception and design of the study, and E.V., E.P., P.V. and A.B. were responsible for carrying it out. E.V., A.N. and M.K. were responsible for the analysis and interpretation of the data, and E.V. drafted the article. All authors revised the manuscript critically for important intellectual content and gave final approval of the version to be published. Ethics of human subject participation: This study was conducted according to the guidelines laid in the Declaration of Helsinki and all procedures involving human subjects were approved by the Hellenic Health Foundation Ethical Committee. Written informed consent was obtained from all subjects.


