The prevalence of obesity is increasing so rapidly worldwide that this phenomenon is referred to as a ‘global epidemic’ by the WHO and is a major public health problem in industrialized countries( 1 ). According to the WHO Regional Office for Europe, this trend is particularly alarming in children and adolescents because the prevalence is increasing constantly and is now ten times higher than that found in the 1970s. Childhood obesity is a condition that, once it has developed, tends to persist into adulthood and predisposes to a series of pathological alterations in both the short and long term( Reference Branca, Nikogosian and Lobstein 2 , Reference Dietz 3 ). Over 60 % of children overweight before puberty will be overweight in early adulthood; this reduces the average age of onset of non-communicable diseases and significantly influences the burden on health services, increasing the number of medical contacts and treatment during adulthood( Reference Branca, Nikogosian and Lobstein 2 , Reference Claire, McPherson and Marsh 4 ). BMI is the most commonly used measure of ponderal status in a population and is calculated as body weight (in kilograms) divided by height (in metres) squared( 1 , 5 ). It may be an appropriate index to define overweight in children and adolescents( Reference Bellizzi and Dietz 6 ) and to identify groups that are at increased risk for overweight and obesity-related health problems.
A national surveillance system to monitor the prevalence of overweight/obesity is fundamental to plan successful preventive health interventions. Surveillance of childhood overweight and obesity should be more widespread in order to monitor its trend and to permit inter-country comparisons. The important elements of a surveillance system are simplicity, acceptability, representativeness and cost( Reference Declich and Carter 7 ). In Italy the national survey of the prevalence of childhood overweight and obesity (OKkio alla SALUTE) was developed and started in 2008 and involves a representative sample of about 40 000 schoolchildren aged 8–9 years every two years( Reference Binkin, Fontana and Lamberti 8 , Reference Spinelli, Lamberti and Nardone 9 ). OKkio alla SALUTE is part of the Childhood Obesity Surveillance Initiative (COSI) established by the WHO Regional Office for Europe( Reference Wijnhoven, van Raaij and Spinelli 10 ).
The WHO anthropometric evaluation procedure( 5 ) specifies that weight and height must be measured on a subject wearing only light underwear. On the other hand, the surveillance system OKkio alla SALUTE decided to measure body weight with clothing and then to rectify the data according to the estimated weight of the clothes. The assumption is that the OKkio alla SALUTE procedure is more practical and quick and it may increase the participation rate of children and their parents.
The aim of the present study was to compare the weight obtained according to WHO recommendations( 5 ), that is measuring the weight of the children wearing only underwear, with that of clothed children adjusted to take account of the weight of their clothes, as for the OKkio alla SALUTE protocol. The second aim was to assess how the latter method to measure body weight affects the calculation of BMI and the assessment of overweight and obesity prevalence in schoolchildren.
Methods
Thirty-seven third grade classes of thirteen primary schools in the municipality of Rome and in two towns in the Lazio Region were recruited. All students of the selected classes were enrolled on a voluntary basis. This study was conducted according to the guidelines laid down in the Declaration of Helsinki and all procedures involving human subjects were approved by the ethical committee of the National Institute of Health. Prior to their acceptance, the children's parents or other caregivers were fully informed about the objectives and methods of the study and signed a consent form.
Anthropometric measurements were taken on 524 children between 8 and 9 years of age, with a higher percentage of boys (57·3 %), due to a greater number of males in the sampled classes. Measurements were made by two researchers, trained and standardized according to WHO recommendations( 5 ). Body weight was measured to the nearest 50 g using an electronic scale SECA 872™ (Hamburg, Germany), with the child in fasting condition (or after a light breakfast) and after empting the bladder. Height was measured to the nearest 0·1 cm by a stadiometer SECA 214™, with the child without shoes, standing up, weight being equally distributed on both feet, with his/her head in the Frankfort plane and the back of the head, buttocks and heels (if possible) in contact with the vertical board. Anthropometric measurements were taken at school in the morning, one child at a time in a quiet room, in the presence of the teacher, ensuring confidentiality for each child. Data of weight, height, date of birth and gender were collected and transcribed on the measurement card, as stated in the OKkio alla SALUTE protocol.
The weight of each child was measured twice in close sequence by the same surveyor and using the same scale:
-
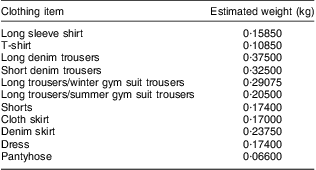
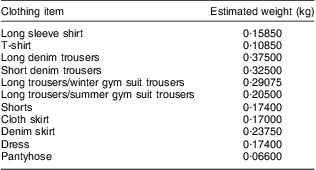
1. The first time, the children were wearing their clothes according to the OKkio alla SALUTE protocol. They were asked to remove their shoes, jackets, heavy sweaters and belts. Children were also asked to empty their pockets and remove any watch, bracelets, etc. The remaining clothes that were worn during weight measurement were marked on the OKkio alla SALUTE measurement card and, in the analysis, the weight was adjusted by the estimated weight of each item of clothing used in OKkio alla SALUTE (Table 1).
Table 1 The OKkio alla SALUTE clothing checklist and estimated weight of the clothes (kg)

-
2. The second time, the children were asked to get undressed, wearing only their underwear, as recommended by the WHO( 5 ).
BMI was calculated: first using the weight measured with the clothes, in accordance with the protocol of OKkio alla SALUTE (BMIOK), and second as indicated by WHO (BMIWHO). To classify the ponderal status of the children, BMI values (both BMIOK and BMIWHO) were compared with those of the international reference tables, specific for age and sex, suggested by the International Obesity Task Force (IOTF)( Reference Cole, Bellizzi and Flegal 11 ). In these tables, the threshold values of reference BMI are listed at exact half-year ages; in our study we applied the cut-offs of BMI linearly interpolated to the child's age in months. As the European Childhood Obesity Group has recently recommended to use both IOTF( Reference Cole, Bellizzi and Flegal 11 ) and WHO definitions( Reference de Onis, Onyango and Borghi 12 , Reference Blössner, Siyam and Borghi 13 ) for the assessment of the prevalence of childhood overweight and obesity( Reference Rolland-Cachera 14 ) to permit comparisons between studies, the ponderal status of the children was also classified according to the WHO definition( Reference de Onis, Onyango and Borghi 12 , Reference Blössner, Siyam and Borghi 13 ).
Statistical analysis
Children's weight wearing underwear (WWHO) was subtracted from that obtained with their clothes on, corrected for the estimated weight of the clothes (WOK). How this difference (error) biases BMI and evaluation of the children's ponderal status classification was subsequently appraised.
The Bland–Altman plot( Reference Bland and Altman 15 ) was applied to compare: (i) the children's weight measured with clothing rectified according to the estimated weight of the clothes (WOK) with their weight measured without clothing (WWHO); and (ii) the BMI calculated from each of the two children's weight measurements (BMIWHO and BMIOK).
Cohen's kappa index( Reference Cohen 16 ) was used to assess the agreement in overweight and obesity classification according to the IOTF( Reference Cole, Bellizzi and Flegal 11 ) reference and the WHO( Reference de Onis, Onyango and Borghi 12 , Reference Blössner, Siyam and Borghi 13 ) definition from each of the two BMI values obtained (BMIWHO and BMIOK).
The statistical analyses were carried out using the statistical software package IBM SPSS Statistics version 18·0.
Results
Table 2 shows the characteristics of the sample examined in the present study: the 524 studied children had mean age of 8·4 (sd 0·4) years, weight WWHO of 31·3 (sd 6·8) kg, weight WOK of 31·3 (sd 6·8) kg, height of 131·5 (sd 5·9) cm and BMIWHO of 17·9 (sd 3·0) kg/m2.
Table 2 Characteristics of the study sample (524 children aged 8–9 years)

WWHO, weight without clothes according to the WHO protocol; WOK, weight with clothes corrected by the estimated weight of the clothes according to the OKkio alla SALUTE protocol; BMIWHO, BMI calculated from WWHO.
Table 3 shows the difference between the weight measurement with clothes, corrected for the weight of the clothes (WOK), and the weight measured only with underwear (WWHO); this difference can also be expressed as the difference between the estimated weight of the clothes and that measured. The mean difference between the two weights was −0·013 (sd 0·169) kg, with a 95 % CI of −0·027, 0·002 kg, which is not statistically significant (P = 0·08).
Table 3 Difference between the corrected clothed weight/BMI and the weight/BMI measured/calculated without clothes among 524 children aged 8–9 years

WWHO, weight without clothes according to the WHO protocol; WOK, weight with clothes corrected by the estimated weight of the clothes according to the OKkio alla SALUTE protocol; BMIWHO, BMI calculated from WWHO; BMIOK, BMI calculated from WOK.
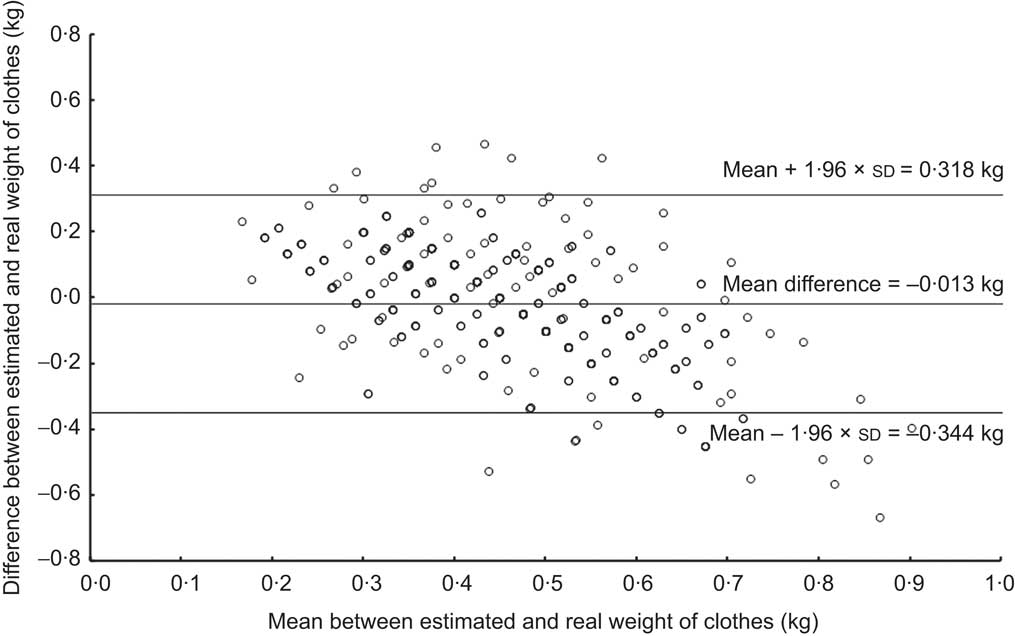
The Bland–Altman plot showed that the error between the real weight and the estimated weight was −0·013 kg and between −0·344 kg and 0·318 kg. The plot showed a tendency to overestimate clothes with a lower weight and underestimate those with a higher weight (Spearman's R = −0·60; P = 0·00; Fig. 1).

Fig. 1 Bland–Altman plot showing agreement between the real and estimated weight of clothes: the difference between the real and estimated weight of clothes (kg) is plotted against the mean of the real and estimated weight of clothes (kg) for 524 children aged 8–9 years
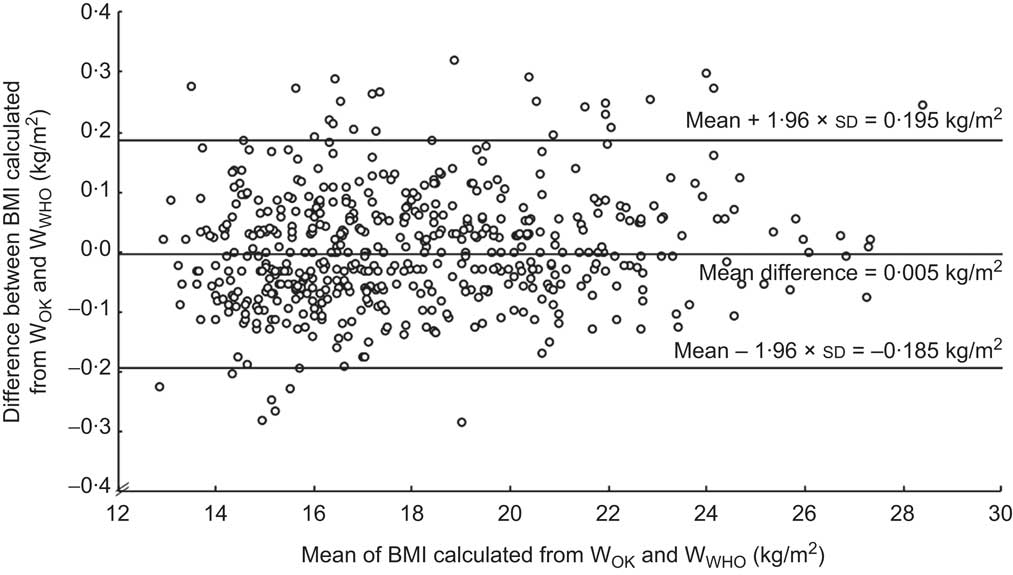
The mean error in the calculation of BMI through WOK procedure was 0·005 (sd 0·097) kg/m2 and it was included between −0·185 kg/m2 and 0·195 kg/m2, with a 95 % CI of −0·0029, 0·014 kg/m2. There was no systematic error (Fig. 2).

Fig. 2 Bland–Altman plot showing agreement between the BMI values calculated from the two weight measurements: the difference in BMI (kg/m2) calculated from children's weight obtained using the OKkio alla SALUTE protocol (WOK) and BMI calculated from children's weight measured by the WHO protocol (WWHO) is plotted against the mean BMI (kg/m2) calculated using WOK and WWHO for 524 children aged 8–9 years
By the IOTF definition( Reference Cole, Bellizzi and Flegal 11 ), the percentages of overweight and obese children calculated with the two methods were: 25·6 % overweight (not including obesity) and 10·7 % obese with WOK and 25·4 % overweight and 10·3 % obese with WWHO (Table 4). The analysis of the agreement in the overweight and obesity status classification by BMIWHO and that made from BMIOK produced a κ index very close to 1 (0·98): an extremely high agreement between the two ways of categorizing through BMI. None of the measured overweight and obese children dropped into the thinness/normal weight class. Three children with normal weight were incorrectly classified as overweight; only two overweight children were erroneously classified as obese (Table 4).
Table 4 Agreement between the assessment of ponderal status according to the International Obesity Task Force( Reference Cole, Bellizzi and Flegal 11 ) by BMIWHO and BMIOK among 524 children aged 8–9 years

BMIWHO, BMI calculated from WWHO; BMIOK, BMI calculated from WOK; WWHO, weight without clothes according to the WHO protocol; WOK, weight with clothes corrected by the estimated weight of the clothes according to the OKkio alla SALUTE protocol.
By the WHO definition( Reference de Onis, Onyango and Borghi 12 , Reference Blössner, Siyam and Borghi 13 ), the percentages of overweight and obese children calculated with the two methods of measuring body weight were: 23·5 % overweight (not including obesity) and 21·4 % obese with WOK and 23·3 % overweight and 21·8 % obese with WWHO (Table 5). Similarly to the results obtained using the IOTF definition, the agreement in the overweight and obesity status classification by BMIWHO and that from BMIOK was very high, with the κ index equal to 0·98. Two overweight children dropped into the thinness/normal weight class. One thinness/normal weight child was classified as overweight and two obese children were categorized as overweight (Table 5).
Table 5 Agreement between the assessment of ponderal status according to the WHO( Reference de Onis, Onyango and Borghi 12 , Reference Blössner, Siyam and Borghi 13 ) by BMIWHO and BMIOK among 524 children aged 8–9 years

BMIWHO, BMI calculated from WWHO; BMIOK, BMI calculated from WOK; WWHO, weight without clothes according to the WHO protocol; WOK, weight with clothes corrected by the estimated weight of the clothes according to the OKkio alla SALUTE protocol.
Discussion
The validation analysis, carried out on 524 children aged 8·4 (sd 0·4) years, suggests that measuring children's weight with their clothes on and then rectifying the obtained weight with the estimated weight of the clothes, according to the protocol of the surveillance system OKkio alla SALUTE, leads to a slight error in the estimation of body weight that implies a small miscalculation of BMI and a negligible difference in the prevalence of overweight and obesity assessment. Considering the advantage of the significant simplification of measurement procedures in ponderal status surveillance, that are generally carried out on a large scale, this error can be regarded as negligible, especially in view of its very limited impact in evaluation of the ponderal status in children using international BMI reference values specific for age and sex (both IOTF( Reference Cole, Bellizzi and Flegal 11 ) and WHO( Reference de Onis, Onyango and Borghi 12 , Reference Blössner, Siyam and Borghi 13 )). In fact, to be sustainable a population surveillance system should be acceptable, simple and not expensive( Reference Declich and Carter 7 ). To measure children without asking them to wear only their underwear makes the procedure quicker for the data collectors, less invasive for the children and parents and can lead to a higher participation rate. This is an essential point to consider in population studies, because the participation rate may affect the calculated prevalence figures. During the past 30 years the participation rates for epidemiological studies have been declining, with even steeper declines in recent years( Reference Galea and Melissa 17 ). The participation rate had a slight but significant positive association with the estimated prevalence of obese children aged 10–11 years in the National Child Measurement Programme (NCMP) for England in 2007/08. This was due to obese children being less likely to participate in the NCMP than other children( 18 ). Thus a lower participation rate may lead to an underestimate of the prevalence of obesity. The choice of measuring the children with their clothes on may have been one of the factors which led to a low refusal to participate (3 % in 2008 and in 2010) in the surveillance system OKkio alla SALUTE( Reference Binkin, Fontana and Lamberti 8 , Reference Spinelli, Lamberti and Nardone 9 ).
Beyond the strengths of the simplified procedure of measuring body weight used in this surveillance system, it should be stressed that measuring dressed children does not enable waist circumference to be measured accurately. This may be a limit to be taken into account on the basis of the evidence that, in terms of morbidity, waist circumference and the ratio of waist circumference to height (WC:Ht) are good indices for selecting children with the highest cardiometabolic risk( Reference Maffeis, Banzato and Talamini 19 , Reference Katzmarzyk, Shen and Baxter-Jones 20 ). This limitation is important because WC:Ht does not need population-specific, gender-specific or age-specific references as BMI does. Considering the availability of age-, sex- and ethnicity-independent cut-offs for WC:Ht, it may be advisable in future large population samples to obtain also waist circumference and not just weight and height.
In conclusion, in view of the big advantage of not asking children to remove their clothes, the small error in the evaluation of BMI and of ponderal status classification can be considered minor in surveillance systems of overweight and obesity.
Acknowledgements
Sources of funding: Funding for this study was provided by the Italian Ministry of Health/Centre for Disease Prevention and Control, Chapter 4393/2005–CCM. Conflict of interest: The authors have no conflict of interest. Ethical information: The study was conducted according to the guidelines laid down in the Declaration of Helsinki and all procedures involving human subjects were approved by the ethical committee of the National Institute of Health on 20 April 2009 (Ref. PRE/182/09 p. CE-ISS09/259). Authors’ contributions: A.S., L.C. and G.B. designed the study. R.R. and N.B. collected the data. L.C., V.A., A.S. and G.B. analysed the data. A.L. and P.N. contributed to the interpretation of the results. All authors were involved in writing the paper and approved the final manuscript. Acknowledgements: The authors gratefully acknowledge Professor John Frederick Osborn for carefully reading the manuscript, and for his suggestions. They also wish to thank the members of the OKkio alla SALUTE Technical Committee, including Giulia Cairella, Marcello Caputo, Margherita Caroli, Chiara Cattaneo, Franco Cavallo, Amleto D'Amicis, Amalia De Luca, Barbara De Mei, Daniela Galeone, Giordano Giostra, Gianfranco Mazzarella, Giuseppe Perri, Maria Teresa Silani, Anna Rita Silvestri and Lorenzo Spizzichino. Finally, they gratefully thank the teachers, children and families who participated in this study.


