Introduction
Among the many challenges encountered in efforts to understand the overall process of ice-sheet and glacier wasting is the problem of describing how surface-roughness features (e.g. crevasses, incipient runnels and channels) in the ablation zone co-evolve with changing environmental conditions, evolving patterns of surface-meltwater movement, and the emergence of standing meltwater features. Surface roughness is what steers meltwater into channels, ponds and, ultimately, moulins. Thus the evolution of roughness is a critical process that impacts the overall response of an ice-sheet or glacier system to climate change. The initial appearance of surface runoff and melt-storage features in the highest elevations of the ablation zone of the Greenland ice sheet can have horizontal scales in the meters to hundreds of meters range (e.g. Reference HolmesHolmes, 1955; Reference Van der Veen, Ahn, Csatho, Mosley-Thompson and KrabillVan der Veen and others, 2009). These features allow the emergence of seasonal lakes, often of crescentic shape, that have sub-kilometer widths at elevations just below the firn to bare-ice transition zone (Reference Harper, Humphrey, Brown and PfefferHarper and others, 2011; Reference Lampkin and VandenbergLampkin and Vandenberg, in press). The origin of the surface roughness that nucleates these lakes can only be partially attributed to the ice sheet’s surface elevation response to flow over bedrock roughness features, because ice flow over bedrock roughness tends to filter out the smallest scales (e.g. Reference Raymond and GudmundssonRaymond and Gudmundsson, 2005).
To determine how incipient surface roughness at the smallest scales evolves into lakes and water channels, it is necessary to identify feedback mechanisms that allow infinitesimally small roughness features to evolve toward finite amplitude. Putting aside mechanisms involving accumulation processes (e.g. those that lead to sastrugi and dunes above the equilibrium line that enter the ablation zone by ice flow) the question examined here is whether there are instabilities and/or feedback mechanisms that allow roughness features to stimulate local ablation in a way that leads to growth of their amplitude.
In this study, we investigate an important part of the above question: specifically, whether a radiatively driven surface ablation feedback exists and is viable as a means to cause small-scale roughness features to grow to length scales that can eventually impact surface water movement and storage. To explore the this question, it is necessary to consider many physical regimes and processes, including both ‘drained’ features that ablate but do not store water and ‘wet’ features which are influenced by the radiative processes of standing water; and to include all energy contributions to the ablation process, such as conductive, latent and sensible heat fluxes. In this study, our consideration of this question is restricted to only (1) ‘drained’ features and (2) the energy contribution of direct sunlight (undisturbed by clouds or obscuring atmospheric conditions). To examine the potential for feedback between solar-driven ablation and the growth of drained surface-roughness features, we develop a numerical model that simulates the spatially and temporally variable melting of rough surfaces in response to multiple scattering and absorption of solar energy. Experiments conducted with this model explore the response of initial surface roughness to ablation through a typical summer melting season on the Greenland ice sheet. The results are examined to identify circumstances where feedbacks can lead to growth of roughness features.
Background
Reference Pfeffer and BrethertonPfeffer and Bretherton (1987) examined the interaction of glacier surface roughness with solar radiation in a study of V-shaped crevasses. They looked at the effect of opening angle of the crevasse on the effective albedo, and found that crevasses of reasonable geometries increase the local absorption by >50%. Reference MacClune, Fountain, Kargel and MacAyealMacClune and others (2003) applied the radiative-transfer treatment of Reference Pfeffer and BrethertonPfeffer and Bretherton (1987) in a study of the processes which help to maintain surface furrows on the dry-valley glaciers of Antarctica and the chasmata of the polar ice caps of Mars. Reference BettertonBetterton (2001) further investigated the interaction of ice and snow surfaces with solar radiation to examine the processes that govern the growth of sun cups and ‘penitents’ (pointed ice or snow columns). Reference BettertonBetterton (2001) developed a treatment of time-evolving surface roughness, and showed that, under certain assumptions, infinitesimal sinusoidal perturbations to a flat snow or ice surface could indeed grow in time, suggesting a way to evolve sun cups, penitents and other small-scale features. Reference BettertonBetterton (2001) restricted the focus to growth of perturbations under insolation with a constant, zero solar zenith angle. Studies of temperate glacier mass balance have included effects of topography on the absorption of incoming radiation in energy-balance models (Reference Hock and HolmgrenHock and Holmgren, 2005; Reference Arnold, Rees, Hodson and KohlerArnold and others, 2006; Reference Anslow, Hostetler, Bidlake and ClarkAnslow and others, 2008), and concluded that these effects can have a substantial effect on the mass balance of a glacier.
Model Description and Numerical Methods
In the present study we build on the work of Reference Pfeffer and BrethertonPfeffer and Bretherton (1987) and Reference BettertonBetterton (2001), by developing a numerical model of the interaction between surface roughness and direct sunlight that can treat both arbitrary geometries (beyond the V-shaped geometry considered by Pfeffer and Bretherton and the sinusoidal geometry of Betterton) and the time evolution of these geometries under the parameter regime best describing a typical ablation season of Greenland. Our model allows us to evaluate the effects of daily and seasonal variation in solar zenith angle, and to examine how various initial shapes evolve through an ablation season. An advantage of this more detailed treatment is that we can report daily-averaged albedos, a parameter that may be more useful in large-scale ice-sheet ablation modeling than the zenith-angle specific albedos reported by Reference Pfeffer and BrethertonPfeffer and Bretherton (1987). We choose idealized surface topography of various orientations and shapes that are representative of conditions in the ablation zone of western Greenland. The goal of our model is to quantify: (1) how surface roughness can enhance solar absorption, (2) at what scale this enhancement is most efficient and (3) under what conditions dry surface features can be stable (likely to persist over several seasons) in the typical environment of the Greenland ablation zone.
To address these goals, we present numerical experiments that illustrate the evolution of two simple geometric shapes treated in two dimensions, a half-circle canyon and a V-shaped crevasse (both dry), over a typical 90 day ‘melt season’ during peak summer insolation at six latitudes between 60 and 85° N, representing the latitudinal span of the Greenland ice sheet. The experiments explore the regions where insolation-driven ablation permits the persistence of surface features, and determine the degree to which enhanced absorption leads to increased surface melting. We also present experiments that focus on the V-shaped crevasse feature, exploring the influence of initial aspect ratios on enhanced melting through an ablation season at 70° N. These experiments are certainly not an exhaustive exploration of parameter space; but they do serve as a starting point to explore simple examples of the complex feedback between topographic evolution and solar absorption.
As shown in Figure 1, the model domain consists of a one-dimensional (1-D) curvilinear contour, Γ, that represents the ice/air interface of a cross section of an idealized two-dimensional (2-D) surface feature. Distance along the contour (from left to right) is represented by the curvilinear variable s, and horizontal and vertical Cartesian coordinates are represented by x and z, respectively. The x-and z-coordinates of Γ are denoted X(s, t) and Z(s, t), where t is time.
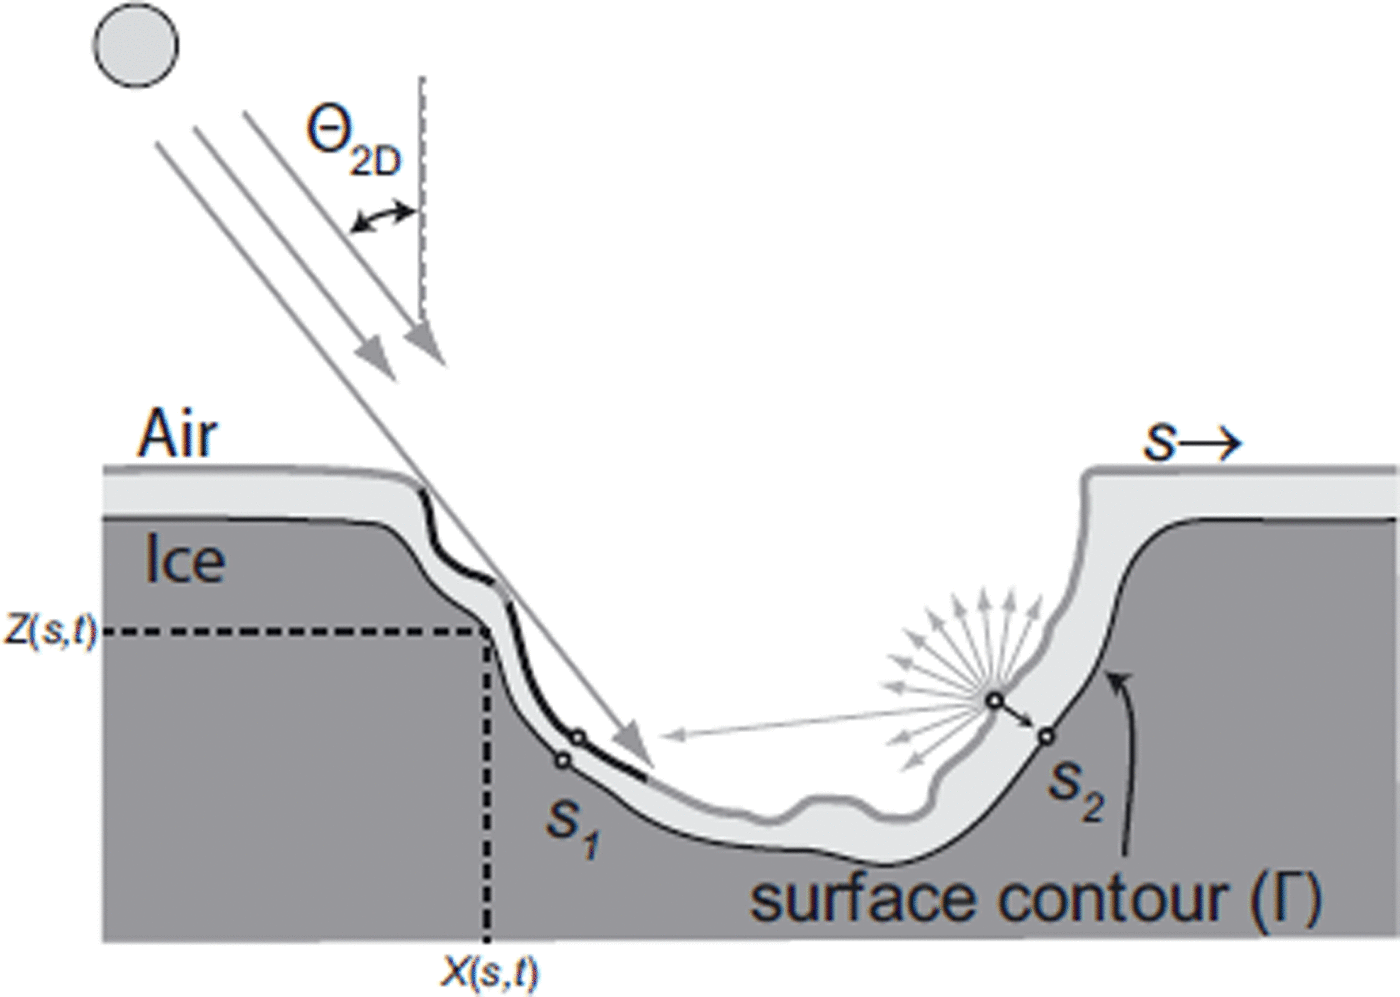
Fig. 1. Themodel domain is the curvilinear contour, Γ, that separates ice (below) from air (above). Curvature of Γ causes both shadows and indirect radiative exchanges. For example, light incident on point S 2 reflects and adds to the energy absorbed at point S 1, even though S 1 is shadowed by the contour fromdirect solar illumination. At each time-step, both the geometry andmagnitude of the incoming solar beam are modified to account for the Sun’s ephemeris, and the position of the surface is modified to account for ablation (denoted by the light-gray shaded region of ice between an initial and a final position of the contour).
The contour itself is the boundary between the ice and the atmosphere. The ice is assumed to be optically opaque, i.e. all light is absorbed or reflected at the interface, and to be at a uniform temperature, T M, representing the melting point so that heat conduction within the ice may be excluded from the analysis. The contour is truncated at each end, where the ice/air interface is assumed horizontal, so as to isolate, for the purposes of experimentation, the topographic feature under study. The atmosphere is assumed to be cloud-free, and the intensity of incoming insolation perpendicular to the beam of light at ground level is fixed at 800Wm–2, which assumes some attenuation from the top-of-atmosphereflux of 1365Wm–2. We neglect diffuse light from either the clear sky or clouds. Using the method described in the Appendix to track the solar ephemeris, we calculated the daily average insolation incident on a horizontal surface and found our maximum values (~300Wm–2) well within the range of maximum monthly mean observations (260–340Wm–2) reported in figure 4 of Reference Van den Broeke, Smeets, Ettema and MunnekeVan den Broeke and others (2008) for the ablation zone in Greenland.
The model describes two important effects: (1) the total energy absorbed, E a(s,t), as a function of s along Γ and (2) the time evolution of X(s,t) and Z(s,t). For the latter effect, we assume that energy absorbed equals surface melting. Surface melting in response to E a(s,t) is assumed to act locally and to ablate the surface of the ice in a direction perpendicular to Γ. To restrict attention to solar/surface feature interactions alone, energy transfer in the ice below the surface is not treated (effectively treating the ice as temperate through the full depth of the ice below the surface) and energy-balance terms associated with sensible and latent heat transfer and surface snow or rain accumulation are neglected. The model’s time-steps are designed to resolve diurnal variation of the incoming direct solar energy, E d(s,t), which also varies with season and latitude, λ. Longitudinal effects on the solar ephemeris are absorbed by designating t to be the local time. To simulate a single year’s ablation season, we run the model for a 90 day period centered on the Northern Hemisphere’s summer solstice, starting on ordinal day 140, using a time-step size, dt, of 60min.
Three categories of analysis are involved in stepping the model forward in time. First, the time-dependent solar zenith angle, Θ(t,λ), and the solar azimuth angle, φ(t ), are computed to assess the distribution of E d(s,t,λ) along Γ. Second, geometry-dependent radiative effects associated with shadowing, multiple reflections and absorption are treated in the computation of E d(s,t,λ) and E a(s,t). This second step closely follows the development of radiative transfer by Reference Pfeffer and BrethertonPfeffer and Bretherton (1987), and involves a number of geometric considerations, such as evaluating the degree to which the profile of one contour element, dsi , intercepts the diffuse shortwave radiation emitted from another contour element, dsj . Third, the shift of the contour’s position is computed from ∂X(s,t)/∂t and ∂Z(s,t)/∂t to account for ablation associated with the assumptions that all absorbed energy goes into balancing latent heat of melting, and that melting everywhere moves the contour in a direction perpendicular to its current direction, into the ice. The first category of analysis involves standard astronomical and geodetic considerations. The second and third categories involve discretization of the contour into 1-D finite elements with node points that are strung along the contour. Each element is a line segment of length ds. At the end of each time-step, we re-mesh the contour to maintain uniform element size.
The details of the computational treatment of our model are fully described in the Appendix. However, for readers who do not wish to examine the details, Figure 1 gives an idealized explanation of what the model does. As the figure shows, we account for where the Sun is in the sky, and project that position into the 2-D plane that contains Γ. Then we illuminate the surface, determining where there are shadows, and compute cross-reflections between surfaces that oppose each other. This computation eventually leads to the net energy absorption along the contour. Using the distribution of energy absorption, we compute ice ablation, move the contour by an appropriate distance (always at right angles to the contour) and determine the new geometry.
Radiative transfer
The central physical element of the model is the treatment of shortwave energy within the surface-roughness feature. The absorption of incoming solar energy, E a, involves the complexity of multiple reflections that is treated following Reference Pfeffer and BrethertonPfeffer and Bretherton (1987). The energy emitted by reflection at a point s along Γ, R(s), is expressed as a Fredholm integral equation of the second kind:
where R d(s) is the component of direct incoming energy emitted by reflection from s, α is the albedo of the surface, and F(s,sʹ) is the fraction of energy leaving some other part of the contour at sʹ which is incident on s.We use the numerical technique described in the Appendix to solve for R(s). The absorbed energy, E a(s), is likewise expressed as
where E d(s) is the energy per unit width absorbed from direct incoming solar radiation. There are essentially two computations to be made before we can solve the above equations: one computation determines the reflected direct radiation, R d(s), and the other involves computing the angle factor, F(s,s), from the instantaneous position of Γ. Details of these computations are given in the Appendix.
The model developed here makes two rather large assumptions about how incident energy is reflected from the surface: (1) there is no angular dependence on the reflectivity of the surface and (2) the albedo is uniform at all wavelengths of incident light. These simplifications are justified here as a preliminary means of isolating the influence of radiation/geometry feedbacks, which constitute our central focus.
Contour evolution by ablation
The final component of the model is the ablation routine that uses E a(s,t) (Equation (2)) to specify how Γ evolves in time. The assumption most appropriate for examining the questions posed in the Introduction is to assume that all absorbed radiation converts to surface melting. This assumption disregards heat capacity of any cold ice that may exist near the surface, but is likely to be adequate, given the wet, temperate ice conditions that develop along the flank of the Greenland ice sheet.
To conform to our focus on the evolution of drained features, all water introduced through the evolution of Γ is removed instantaneously. This avoids the complication of introducing the radiative-transfer effects of standing and running water, which we expect to pursue in a future study.
Under the above assumptions, the velocity, U, of any point located on Γ is expressed as
where –n is the into-ice pointing unit vector perpendicular to Γ, and Ḣ(t,s) is the time- and position-dependent ablation rate. The ablation rate is calculated at every time-step from the absorbed energy distribution
where ρ is the density of ice, L the latent heat of melting and dsi is the length of the finite element used to discretize Γ.
The ablation rate is calculated for the line segments on the contour Γ, but it is the nodes which must be moved to update the position of Γ. To make this adjustment we adopt the method of weighted residuals and write,
where ψ(s) is a weighting function and the integration is over the length of the contour Γ. We use the finite-element method to solve for a discrete version of U which determines the new location of the sequence of points sp , i = 1 → N, via the x- and z-components of U, up and wp . At the end of every time-step we re-mesh using a linear interpolation scheme. This prevents bunching of nodes along the surface, but potentially adds interpolation artifacts, such as surface smoothing.
Model Results
Plots showing the initial and final surfaces after 90 days of ablation at 70°N are given in Figure 2, corresponding to a location near Jakobshavn Isbræ. Gray shading shows the features geometry after 30 and 60 days (starting on ordinal day 140, the beginning of an idealized ablation season) and the circles represent the Sun’s position in the projected plane during day of the Northern Hemisphere’s summer solstice in 30 time increments. The initial geometry of the V-shaped crevasse feature is 5 m wide and 9.68 m deep, and the initial geometry of the semicircular canyon feature is 5 m wide and 2.5 m deep. The albedo of the surface is uniform and was set to 0.6 for all model runs discussed in this paper. An albedo of 0.6 was chosen as it gives an upper bound for a snow-free bare-ice albedo (Reference Lüthje, Pedersen, Reeh and GreuellLüthje and others, 2006).
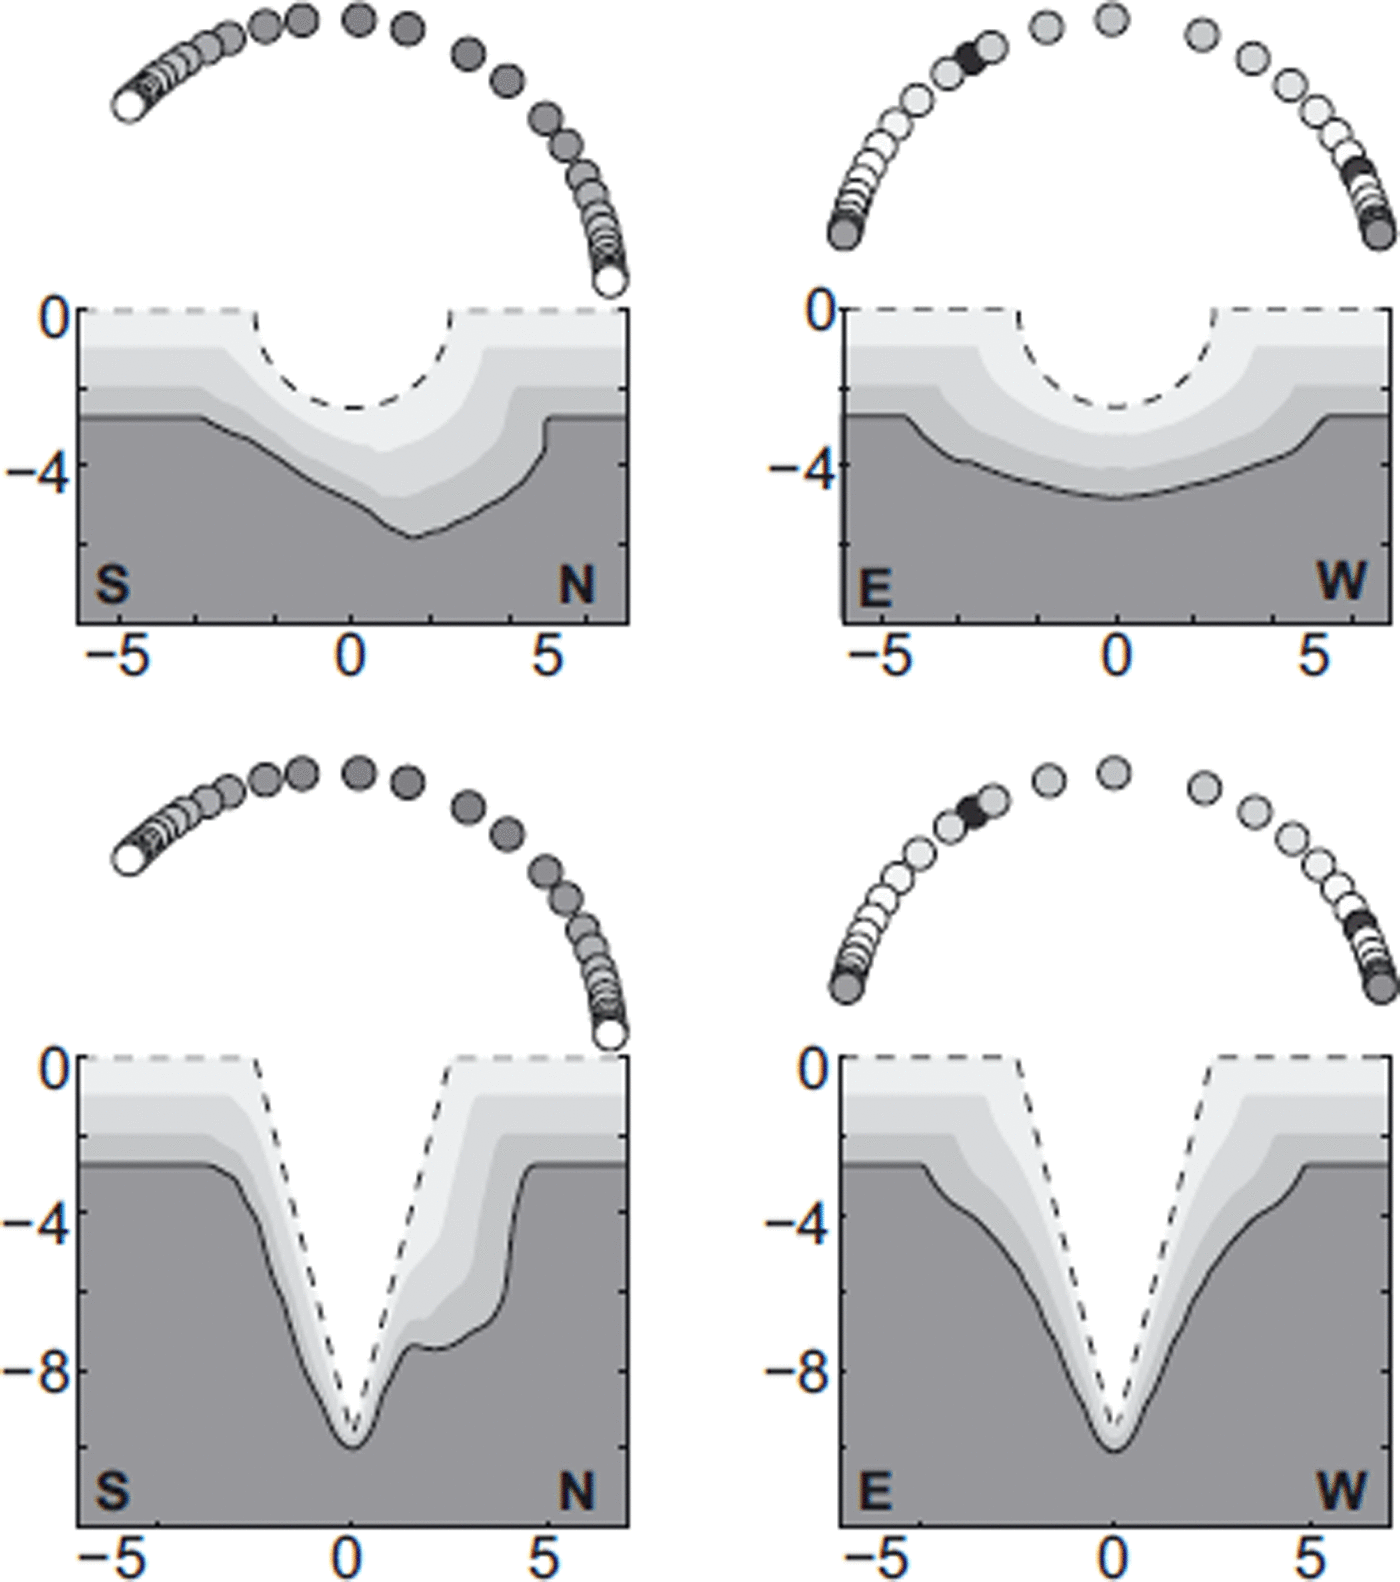
Fig. 2. Idealized, Greenland-like surface features subject to 90 days of ablation from the radiative effects of sunlight at 70˚N. Gray shading indicates features after 30 and 60 days. Circles above the feature depict the effective position of the Sun relative to the surface topography as a function of time (44min intervals) during a single day. These circles are dimmed according to the reduction in intensity of the flux of the Sun’s beam by projecting into the 2-D plane. Features projected into the east–west plane show symmetric geometric evolution, whereas features projected into the north–south plane show preferential melting on the south-facing slopes.
As anticipated, the difference between the Sun’s projected path in the north–south plane and that in the east–west plane produces significant differences in the evolution of surface topography (Fig. 2). The features in the north–south plane develop strong asymmetries in both the circular canyon and V-shaped crevasse, whereas the features projected into the east–west plane broaden uniformly on both sides. These differences become less severe as latitude increases, because the projections become more symmetrical. Differences also arise within geometries; the circular canyon both deepens and widens, whereas the V-shaped crevasse broadens but does not deepen. The depth of melt of the flat surface is less than published ablation rates (Reference Van AsVan As and others, 2010); however, we do not account for all energy fluxes and thus would not expect to achieve observed melt rates.
The most useful way to summarize the efficiency of the surface-roughness/solar-radiation interaction is to use effective albedo, defined as one minus the ratio of energy absorbed on the surface feature to energy entering the surface feature (Reference Pfeffer and BrethertonPfeffer and Bretherton, 1987). The effective albedos of our experiments are shown in Figure 3. Reference Pfeffer and BrethertonPfeffer and Bretherton (1987) showed that the effective albedo of V-shaped crevasses depends strongly on the solar zenith angle, so we report daily averaged effective albedos for the surface features examined in our experiments. Because our features evolve over time in response to solar-driven ablation, the horizontal aperture of the feature (i.e. the horizontal width of Γ at the z where a flat, smooth surface would exist in the absence of the roughness feature) can widen with time, allowing an increasing energy to enter the feature with time. To control for the widening aperture, we plot the effective albedo over a mixed region that includes the flat surface on either side of the evolving roughness feature. Plots shown in Figure 3 are for a 20m wide section of surface containing the surface feature. Initial latitudinal differences in effective albedo for crevasse roughness features arise from differences in solar ephemeris between latitudes, not geometric differences, and this confirms the conclusion by Reference Pfeffer and BrethertonPfeffer and Bretherton (1987) that the solar-absorption efficiency of crevasses depends on the solar zenith angle. For canyons of circular cross section, initial effective albedos do not depend on latitude (see Appendix for further discussion); however, after 90 days ablation canyons show more sensitivity to latitude than the V-shaped crevasses.
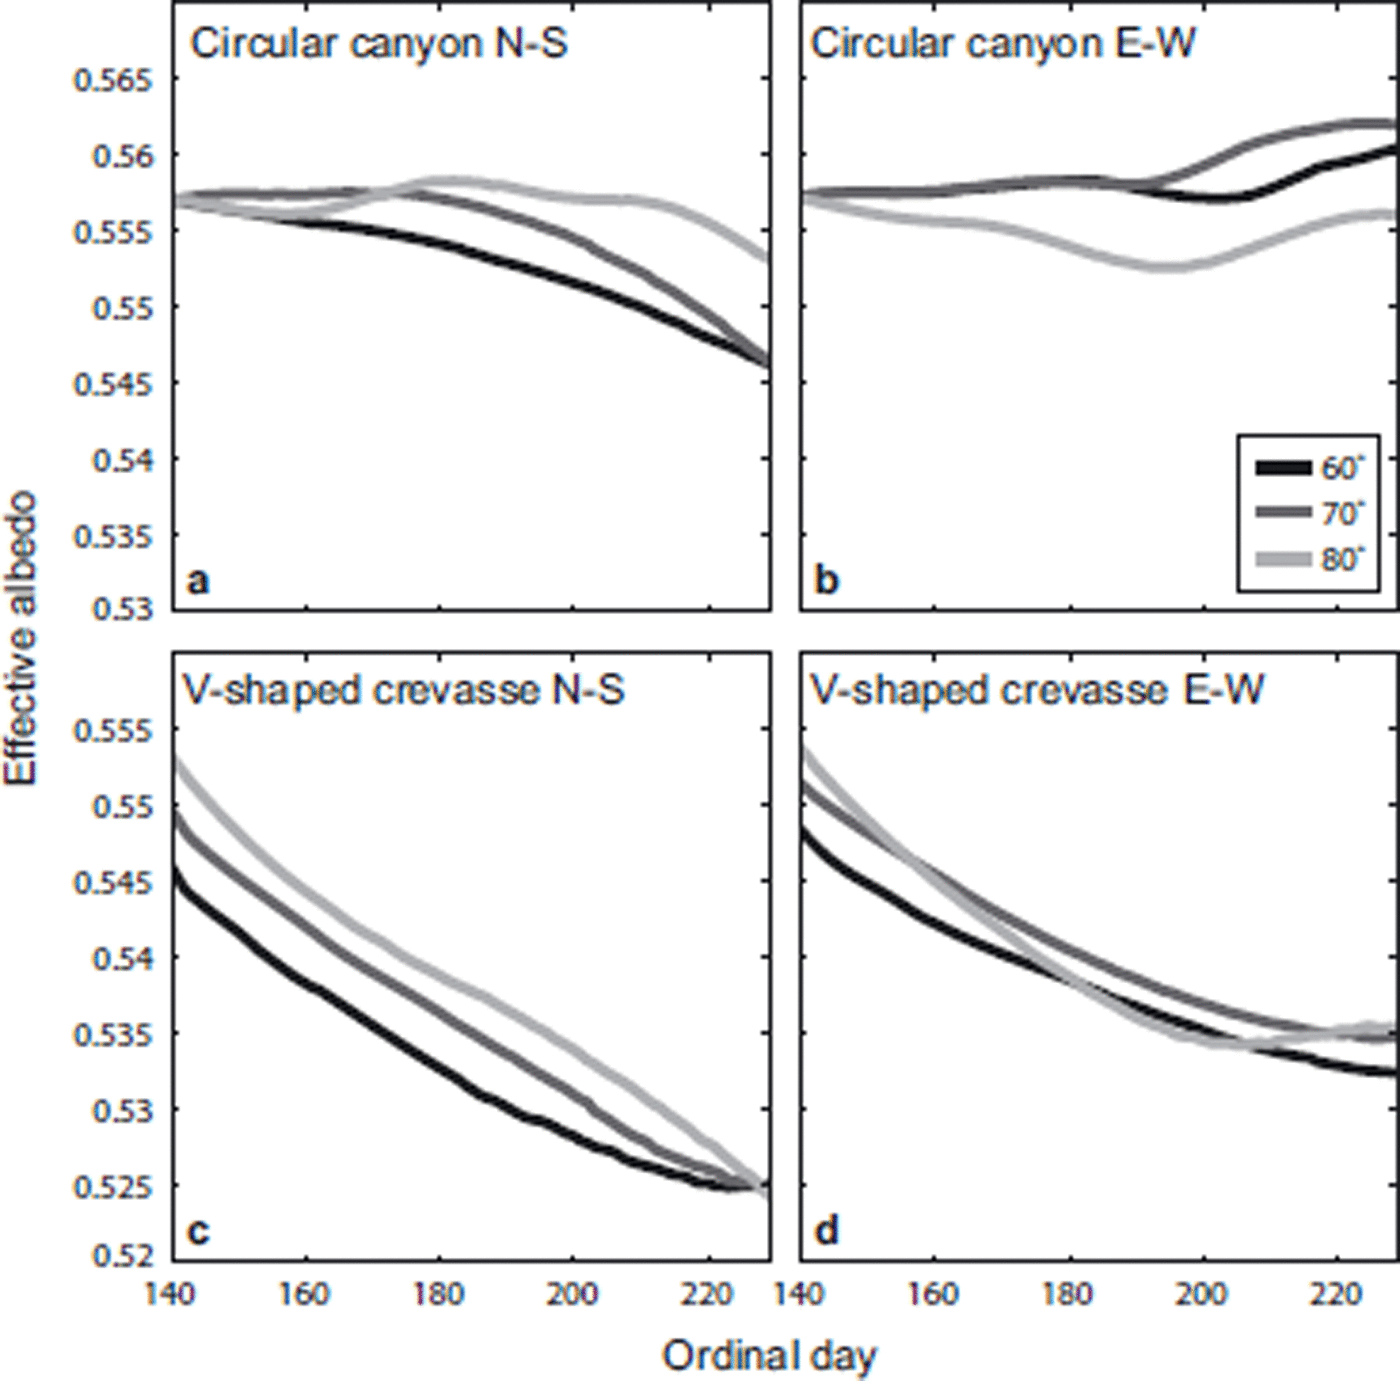
Fig. 3. The evolution of the effective albedo over a 20 m horizontal distance which fully contains the surface feature. Examples from 10˚increments between 60 and 80˚ N are shown for the 90 day numerical experiments. The albedo of the surface is 0.6, so for all features the effective albedo is less than it would be for a flat surface. The precise evolution of the effective albedo depends on both the evolution of the width of the feature, and the efficiency of the feature at trapping incoming energy.
The time evolution of the effective albedo shows a complex behavior for many of the model simulations shown in Figure 3, switching from decreasing functions of time to increasing functions of time, and back again. This meandering behavior stems from changes in the balance between three competing factors that determine the effective albedo: (1) the effective albedo of the rough portion of the surface, (2) the proportion of the surface that is rough and (3) solar zenith angle. All factors change through the ablation season and can cause non-monotonic behavior of the net effective albedo.
To describe how a feature’s shape changes over time, we show the ratio of a derived parameter called the geometric mean length to the horizontal width through time. The ‘geometric mean length’, L, is the square root of the cross-sectional area of the roughness feature. We compute this as

where Γflat is the average depth of the contour near the truncated ends (far from the surface feature), and X l and X r are the x-coordinates of the left and right edges of the surface feature defined as the horizontal position where Γ drops 3 cm below Γflat. The width we use, W, is the distance between X l and X r. The depth chosen to measure the width is arbitrary; 3 cm was used to ensure that small grid-to-grid noise on the flat surface was not mistaken for a surface feature. The ratio of L to W approaches 1 as the feature geometry becomes more square-like, and approaches 0 as the feature becomes flatter. Henceforth we refer to the ratio L/W as the ‘aspect ratio’.
Figure 4 shows, for each experiment, the evolution of the aspect ratio over the 90 day ablation season. There is a common general trend of decreasing aspect ratio, which is strongest at higher latitudes and in the east–west projected plane. Features at higher latitudes or elongated in the north–south direction flatten the most in an ablation season. Both the circular canyon-shaped feature and the V-shaped crevasse feature at lower latitudes and in the north–south plane show little change in aspect ratio toward the end of the ablation season. The circular canyon in the north–south plane comes to a nearly steady aspect ratio after ~40 days. The similarity between Figure 4a and c and between Figure 4b and d suggests a universality (geometry independence) of how roughness features evolve when driven by the same solar forcing. This geometry-independent behavior suggests an approach to parameterizing the albedo enhancement effects of surface roughness in models of ice-sheet ablation that cannot resolve individual roughness features.
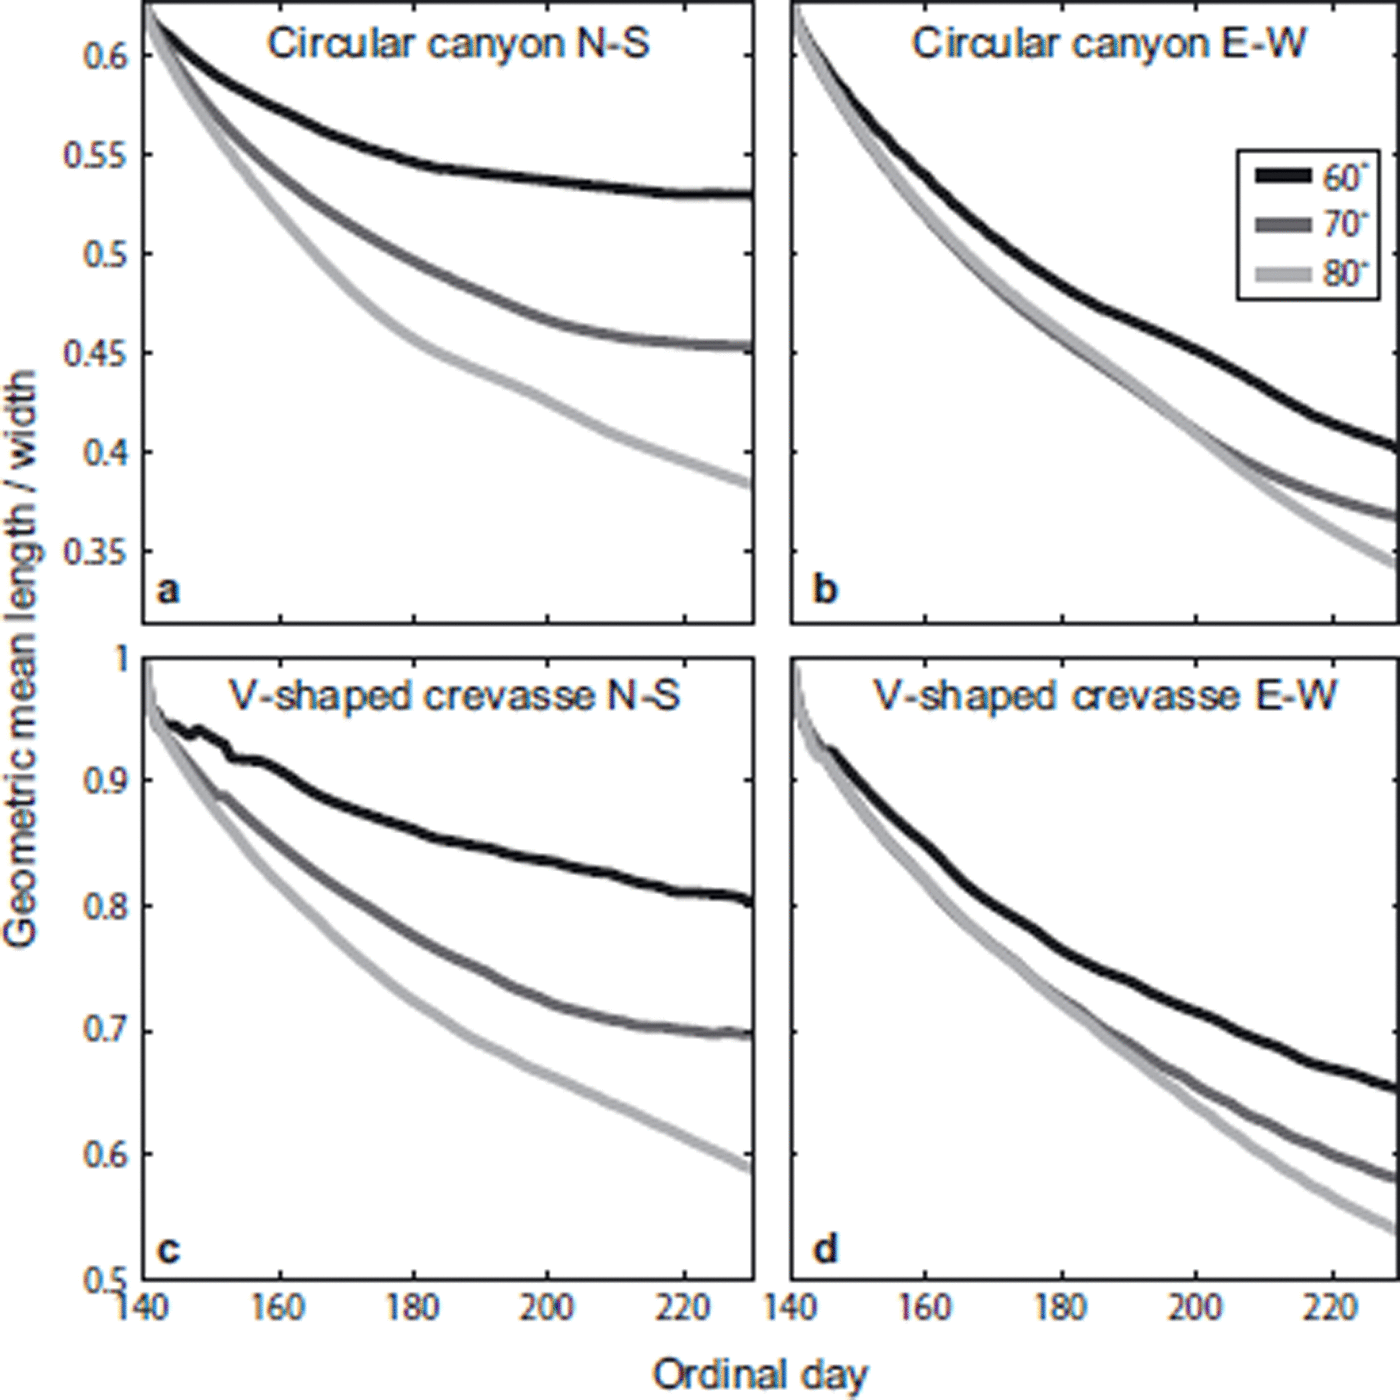
Fig. 4. The evolution of the surface feature geometry over an ablation season for multiple latitudes. The aspect ratio is the ratio of the geometric mean length to the width of the feature (the geometric mean length is the square root of the cross-sectional area of the surface feature). This metric shows the common behavior of the circular canyon geometry and the V-shaped crevasse geometry, indicating that vastly different geometries evolve similarly under the same forcing. The shape evolution is shown in 10° increments for latitudes between 60 and 80° N.
The total enhanced melting (defined as the total ice melted relative to that which would be melted if the region were a flat surface) after 90 days over a 20 msection of surface varies between 10% and 17%. Figure 5 shows variations in total enhanced melting. Both the feature shapes projected into the north–south plane show a decrease in enhanced ablation as latitude increases, whereas in the east–west plane there is a slight increase in enhanced melting for both geometries at high latitudes.
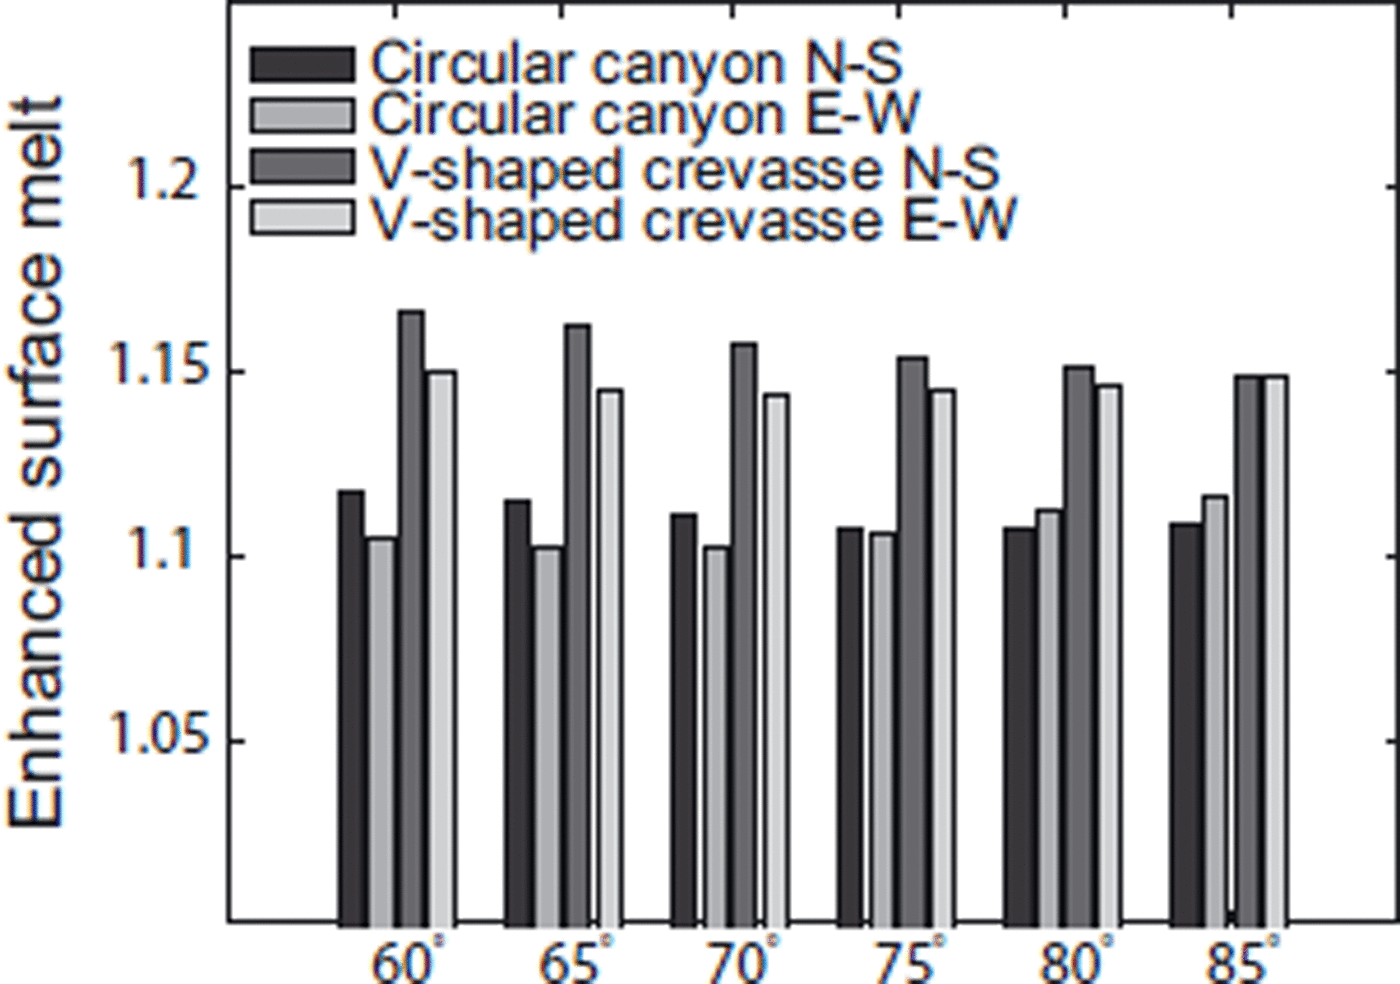
Fig. 5. Total enhanced melt (relative to a flat surface) for each projection at six latitudes over a 90 day ablation season. All projections show that the presence of a concave surface feature increases the amount of radiatively driven melting. The increase for a horizontal section which is four times as wide as the initial surface feature is 10–17%. There is relatively little variation in total enhanced melt with latitude.
A second set of experiments was designed to explore the effects of the initial geometry. For these model simulations we kept the width of the feature the same, but changed the depth of the feature. We restricted our study to 70° N latitude but again ran simulations for north–south and east– west planes and for V-shaped crevasse features and circular (although now ellipsoidal) canyon features. The initial width at the surface for each geometry was 8m. Figure 6 shows the enhanced melting for features with depths varying from 1 to 20m after 90 days of melting, starting on ordinal day 140. The model experiments show that as the initial aspect ratio increases (deviating further from a flat surface) so does the enhanced surface melt in a melt season. The rate of increase of enhanced melt with aspect ratio tends to decrease with time as the aspect ratio approaches 1. While the similarity between the different geometries and projections is greatest for low (<0.5) geometric length-to-width ratios, there is still general agreement between different geometries and geographic orientations over the full range of initial geometric length-to-width ratios.
The combination of results shown in Figures 6 and 4 provides the framework for thinking in general terms about how surface-roughness features evolve through multiple seasons on the Greenland ice sheet. Figure 4 shows that the aspect ratio decreases through the season, for all but the southernmost latitudes, and that this decrease is greatest at higher latitudes. Figure 6 shows that for smaller aspect ratios, there is less enhanced melt in an ablation season. If the geometry of a feature is maintained between ablation seasons, then over several seasons, features will tend to ablate towards a flatter surface, thus giving progressively less significant enhancement of melt.

Fig. 6. The enhanced surface melt relative to a flat surface for various initial geometric mean length-to-width ratios (aspect ratios) after 90 days of ablation beginning on ordinal day 140. Results shown in this figure are for shapes (both V-shaped and ellipsoidal) with initial widths at the surface of 8m, and depth varying from 1 to 20 m at 70° N. Initial geometric mean length to the width is a good predictor of total enhanced surface melt over a 90 day ablation season.
Discussion and Conclusions
The numerical model developed here quantifies the enhancement of melting, or alternatively the reduction of albedo, for a variety of geometric shapes and for the solar ephemeris consistent with the latitude span of the Greenland ice sheet’s ablation zone. Our numerical simulations show that geometries evolve during an ablation season in a manner that depends on orientation relative to the compass directions and on their latitude. Features that are elongated east towest (with their cross section in the north–south plane) evolve an asymmetric shape because the south-facing side of such a feature acts as a solar collector relative to the north-facing side. Total enhanced melt rates found here are comparable with what has been found in previous studies. The results of our study show, however, that the effective albedo of a feature changes through time, but in a manner that does not substantially reduce the relative efficiency of rough surface topography as a solar collector in one ablation season.
We describe a metric which shows that different geometries can be characterized by an aspect ratio which responds similarly to the same solar forcing. This metric, the ratio of the geometric mean length to the width (aspect ratio), decreases through an ablation season. The total enhanced melt in an ablation season varies with the initial aspect ratio. This suggests that a simple parameterization for enhanced melt (or effective albedo) could be extrapolated from Figure 6, regardless of the details of the geometric shapes considered. Using the aspect ratio is particularly convenient because, for a given projection and latitude, the aspect ratio evolves in the same way through an ablation season, regardless of the feature’s specific geometry.
In our results, the amplitude of initial surface roughness remains relatively constant on only a small region of the Greenland ice sheet. This propensity for steady-state geometry only occurs in the southernmost extreme part of the ice sheet, and only for features elongated east to west (with their cross section contained in the north–south plane). The rest of the locations and feature geometries tend to broaden over time, which implies that solar radiation tends to smooth incipient surface roughness in the ablation zone. While our model neglects many potentially important processes that depend on latitude, the persistence of features in our results suggests that initial roughness on ice sheets found at lower latitudes might persist even in a dry state, thus significantly enhancing melting of the surface. This result requires further investigation, but suggests a potentially important process in considering latitudinal variations in ice-sheet retreat rates.
Our overall conclusion is that surface radiative balance details involving roughness features significantly enhance melting within small-scale channel and basin features that ultimately control the movement and storage of surface meltwater on the Greenland ice sheet. These features persist through an ablation season; however, over most of the Greenland ice sheet, initial surface-roughness features tend to flatten and ablate away if not maintained over time through some other process. The next most important step to consider in this work is the influence of standing water within the roughness features.
Acknowledgements
This work was supported by US National Science Foundation grants ARC 0907834 and ANT 0944248. D.S.A. was supported by the T.C. Chamberlin Fellowship at the University of Chicago and by the Canadian Institute for Advanced Research. This work was improved by two reviews, particularly that of P.K. Munneke, and through the efforts of scientific editor D. Van As.
Appendix
Solar ephemeris effects
To compute Θ(t,λ) and φ(t), we apply the method described by Reference WalravenWalraven (1978) and use spherical trigonometry to determine these angles. Our model only looks at features in a 2-D plane, i.e. Γ is contained within the x-z plane, so we must project the Sun’s position into this plane. To do this we evaluate the unit vector, m, pointing towards the Sun from any point on the surface to determine three components, mx , my and mz , where the y-coordinate represents the dimension along the trend of the surface topography, i.e. perpendicular to the cross section represented by Γ. Once this unit vector is evaluated, an ‘effective illumination source’ is established within the x-z plane that (1) accounts for geometric spreading of radiation across the surface in the y-direction, i.e. the cosine of the angle representing my , and (2) recreates the shadows associated with the actual solar illumination. In Figure 7 we represent the effective illumination source by depicting a circular body (an effective Sun) that is fully contained within the x-z plane, but which has dimming associated with the degree to which the azimuth of the Sun spreads the Sun’s light in the direction perpendicular to the plane containing Γ.
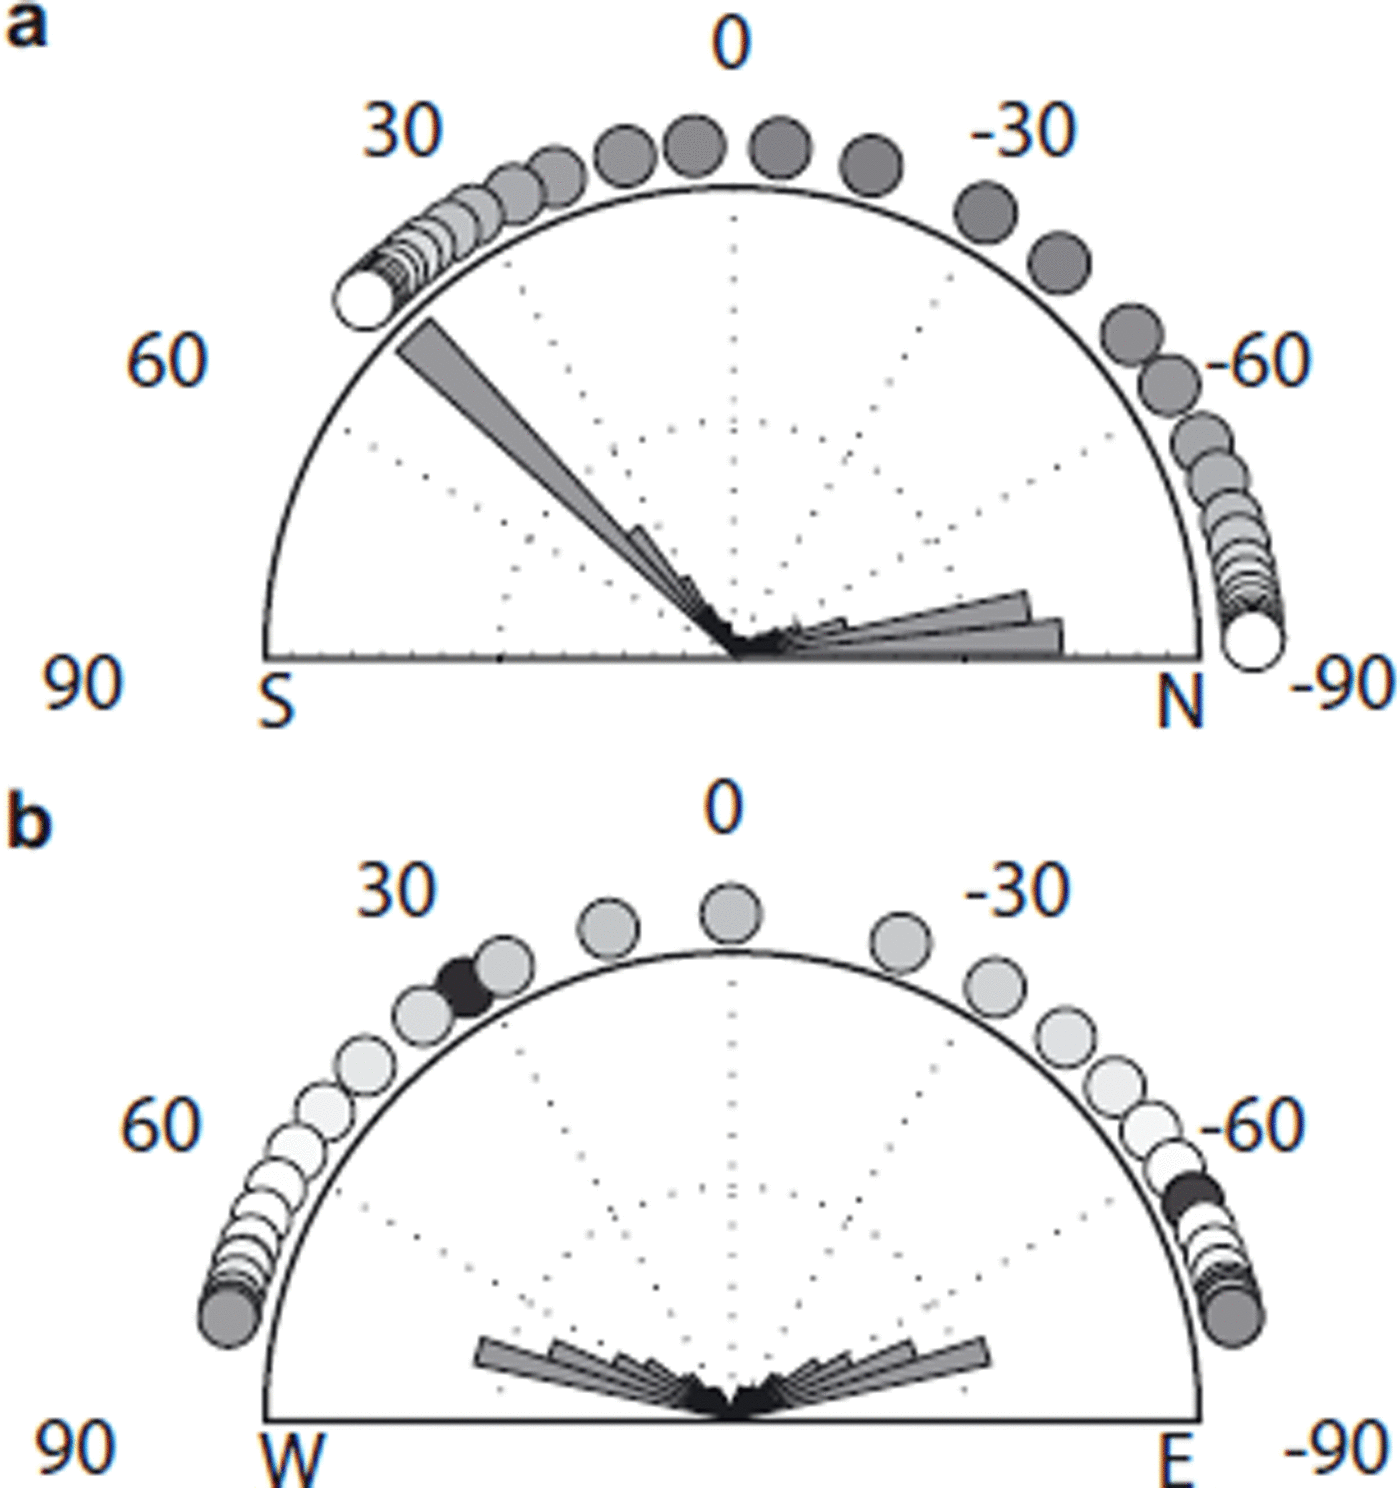
Fig. 7. This diagram illustrates the effect of projecting the Sun into the 2-D x-z plane that contains the contour, Γ, and which is perpendicular to the assumed uniform trend of the particular surface topography being studied. Projection into (a) the north–south and (b) east–west planes is shown for the summer solstice at 71° N. Circles on the perimeter of the rose plots depict the effective position of the Sun relative to the surface topography as a function of time (44min intervals) during a single day. These circles are dimmed or brightened according to the dilution of illumination associated with the projection of the Sun’s beam into the y-direction perpendicular to the trend of the topography. The histograms show the distribution of power incident on a horizontal surface as a function of zenith angle over a full day, with the same scale in both (a) and (b).
To simplify matters, we further restrict our attention to situations where the x-z plane is contained within either a north–south (NS) or an east–west (EW) direction. The 2-D zenith angles for the projection of the Sun’s position into the north–south plane or east–west plane are:
These equations provide the zenith angle in the projected plane; however, the intensity must also be adjusted to account for the portion of the energy in my which is not incident on Γ:
where I NS and I EW are the intensity-adjustment factors for the north–south and east–west planes, respectively.
Consideration of how the Sun projects into the two planes shown in Figure 7 anticipates many of the results we discuss. Figure 7 shows the Sun’s path and a rose plot histogram of the projected incoming solar energy as a function of effective zenith angles, ![]() and
and ![]() through the north–south and east–west planes. The asymmetry of the NS projection contrasts strongly with the symmetry of the EW projection. This implies that features oriented so their cross-sectional surface, Γ, is contained within the NS plane will develop asymmetric shapes relative to features oriented within the EW plane.
through the north–south and east–west planes. The asymmetry of the NS projection contrasts strongly with the symmetry of the EW projection. This implies that features oriented so their cross-sectional surface, Γ, is contained within the NS plane will develop asymmetric shapes relative to features oriented within the EW plane.
Numerical radiative transfer
The contour, Γ, is approximated as a sequence of N – 1 line segments ordered by index i and bounded by N nodes that are ordered by index p. Nodes are described by the coordinates sp = (xp ,zp ). Angles are measured from vertical, and are positive in the counterclockwise direction.
Most of the absorbed energy is in the form of direct radiation. To check to see if a line segment, dsi , receives direct sunlight, we calculate a sky window for each segment. The sky window has two angles, β L and β R, which give the bounds of the visible sky. For a horizontal plane, = 90 ◦ ◦β L and β R = −90. For a complex surface, we must calculate the angle, β (i,j), between the center of line segment dsi and all N nodes, and determine the minimum angle at which the sky is visible:
The segment dsi is treated as illuminated if the zenith angle, Θ2D, falls within β L and β R. Partial illumination of line segments can significantly increase absorption within complex features, so this must be taken into account. At any transition from shadowed to illuminated or illuminated to shadowed state, we check to see if either segment is partially illuminated and compute the fraction of the segment illuminated. Using this check and the criterion above, we create an array, I d(dsi ), which describes the fractional percent of each line segment which is illuminated. The variables R d and E d can now be written:
where n(dsi ) is the unit normal vector that is perpendicular to each segment, and Is is the magnitude of incoming insolation, taken to be either I NS or I EW, as described above.
The energy reflected off the surface is treated as diffuse. Radiation is emitted uniformly into the half-sphere immediately above the local surface. (Two-dimensionality of the assumed topography immediately assures us that energy emitted into the half-sphere is equivalent to a treatment of energy emitted into a half-circle.) On a flat surface, this energy would all return to the atmosphere; however, with topography, some of the reflected energy is absorbed on other parts of the surface. To include this effect we need to determine what fraction of the light reflected from the surface at one point is incident upon another point. This requires computation of the angle factor, F(s,s' ), for each time-step. We define the angle factor as the ratio of light reflected from dsi incident on dsj divided by all light reflected from dsi :
where γ is the angle of the triangle made by the two end points of segment dsj
and the midpoint of segment dsi
, and is calculated using the law of cosines. One also has to check whether the path connecting the two elements is blocked by other parts of the contour, i.e. that the two elements are connected by a line of sight. This is done by constructing a connectivity matrix, Ci
,j
, that is a Boolean matrix, where a value of 1 means the two segments can see each other, and a value of 0 means they cannot. There are two checks to see if two segments can see each other. The first check is whether the two segments are angled towards each other. If the dot product of the normal to the line segment and a vector pointing from one line segment to the other line segment is positive, then the first check is passed. The second check is whether the line of sight is obstructed. To check this we define a line, f(![]() ), which connects the midpoints of segment dsi
and segment dsj
and
), which connects the midpoints of segment dsi
and segment dsj
and ![]() x is all values of x for nodes between dsi
and dsj
. We then define a new function, g(
x is all values of x for nodes between dsi
and dsj
. We then define a new function, g(![]() ), such that
), such that
If g(![]() ) crosses 0 anywhere, then the line of sight between the two segments is obstructed. If either of the checks fails, we set Ci
,j
= 0.
) crosses 0 anywhere, then the line of sight between the two segments is obstructed. If either of the checks fails, we set Ci
,j
= 0.
Once the above evaluations are made, we proceed to solve the integral equations for the distribution of reflected energy. We discretize Equation (1) by converting the integral to a discrete sum:
where
These equations are amenable to matrix notation, i.e.
and

where Ri = R(dsi ).
Each of the previous equations reduces to the following single equation (which are the same for both R(dsi ) and R(dsj )):
We can rearrange to solve for R:
where I is the identity matrix.
Using the algebraic solution for the total reflection at every point given above, we can solve for the absorption:
where E d(dsi ) is the absorbed energy from direct sunlight defined in Equation (A8).
Model testing
To check our model, we tested it using a simplified numerical experiment which has an analytical solution. The experiment uses a radiative heat source in the center of a circular hole in an infinite plane of temperate ice, and tracks the change in the radius of the hole as a function of time. The radiation is uniform in all directions and all energy must be absorbed, because it is trapped within the hole. For a circular hole this would distribute the energy uniformly along the interface, regardless of the albedo of the ice. There is a simple analytical description of the radius as a function of initial radius, heat source and time:
where H s is the heat source, ρ is the density of ice, L is the latent heat of melting and R i is the initial radius. The numerical experiment assumed a uniform albedo of 0.6 for the surface. Figure 8 shows that for a change in radius of ~5m, our model agreed to within 5mm of the analytical solution.
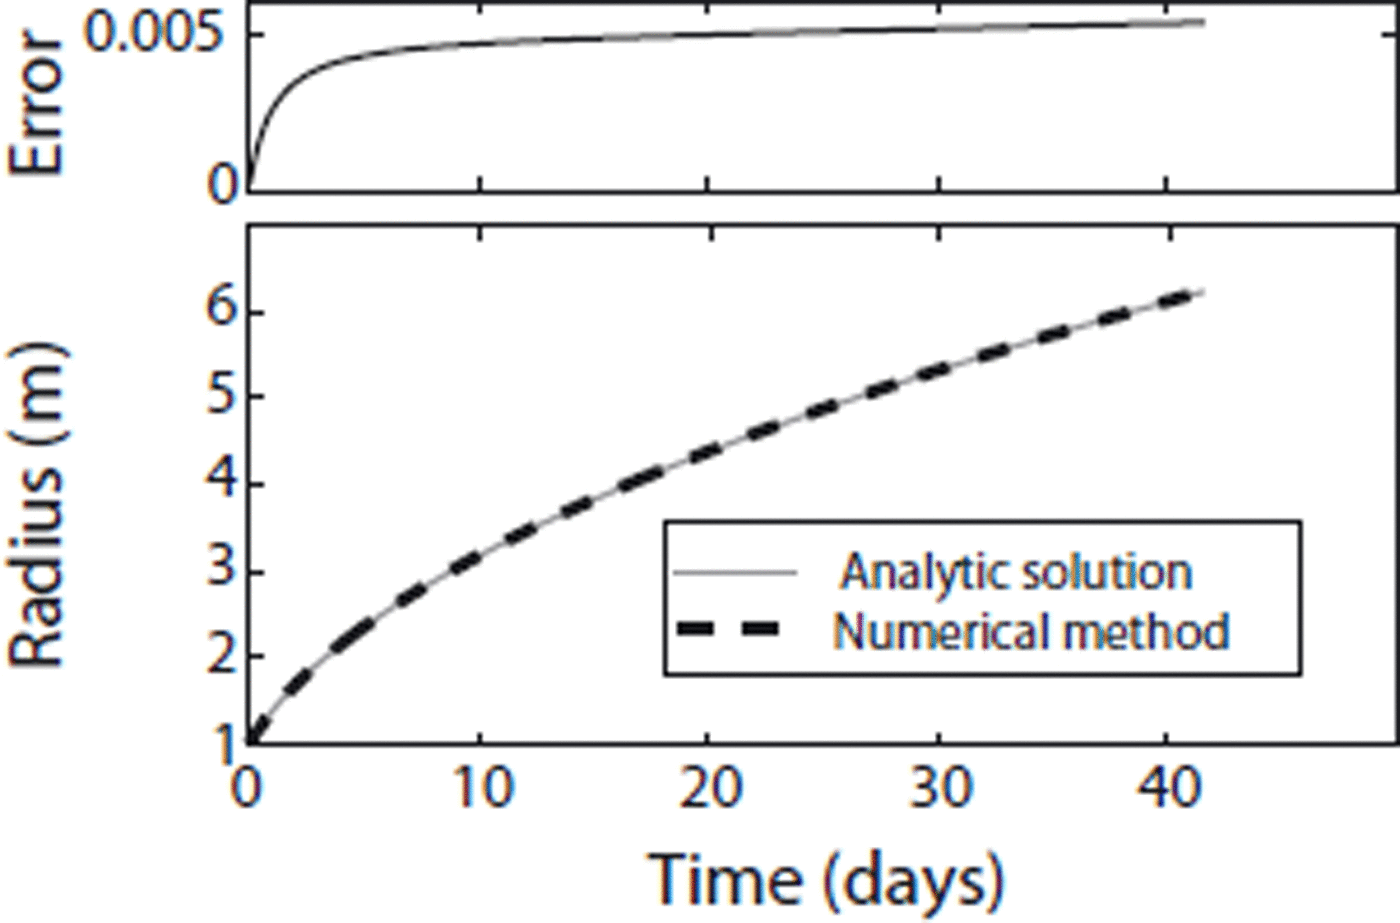
Fig. 8. A comparison of numerical and analytical solutions for a model-performance test experiment. A diffuse energy source is placed at the center of a hole in an infinite plane of ice at the melting-point temperature. The analytical solution shown in Equation (A18) distributes the diffuse energy evenly over the inside surface of the hole. The numerical solution uses the same model used to distribute and evolve the surface features described in the paper; the only difference is that the light source is a point. Model and analytical solutions agree to within 5 mm after a ~5m increase in radius.
As another check, we placed an artificial ‘sky’ over our surface features. This sky closes the feature’s contour, looping back from the last node in a smooth arc above the surface to the first node. The sky does not affect incoming radiation, but any reflected radiation incident on a sky segment is completely absorbed. This allowed us to check that incoming energy and the sum of absorbed and outgoing energy were balanced for complex surfaces. Our methods conserved energy to within 2%. When the spatial resolution of our model is increased, conservation is improved.
Constant zenith angle
To further explore the nature of the feedback between absorbed solar radiation and ablation, we performed experiments with fixed solar zenith angles in which the length of the melting season was shortened from 90 to 15 days. The incoming flux of insolation (perpendicular to the beam) was kept at 800Wm–2. Figures 9 and 10 showthe results from these simulations. Figure 9 shows the percentage of increased melt after 15 days as a function of zenith angle. The initial surface of the circular-canyon feature does not have angular dependence, so variation in the melt enhancement factor arises from feedbacks in the solar ablation. The results show that there is a slight optimum of enhanced melting at 50°, tailing off to a minimum at 85°. There is greater range in the enhancement factor for the crevasse, due in part to the strong dependence of albedo on solar zenith angle. Figure 10 shows the evolution of the ratio of geometric length to feature width over the 15 days of ablation for the circular canyon. Features tend to broaden when incoming insolation is at zenith angles greater than 30°.
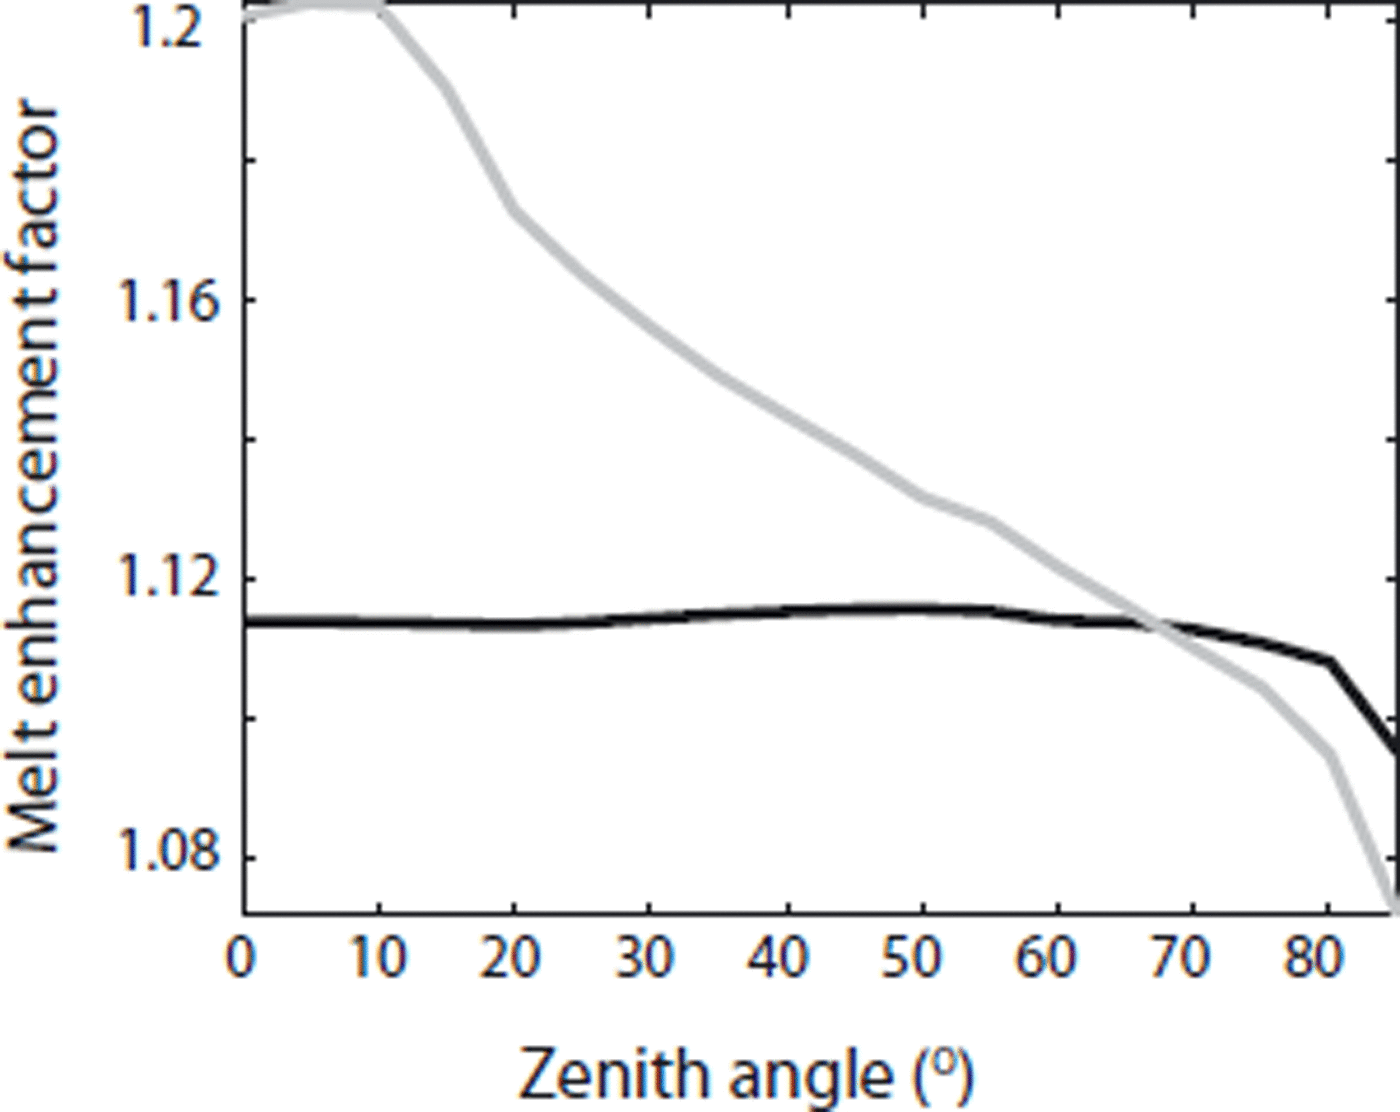
Fig. 9. Percentage of increased melt relative to a flat surface after 15 days, as a function of constant zenith angle. Black curve shows circular-canyon-shaped initial feature, and gray curve shows crevasse-shaped initial feature. Without surface evolution, the melt enhancement factor for the circular-shaped crevasse would be relatively constant.
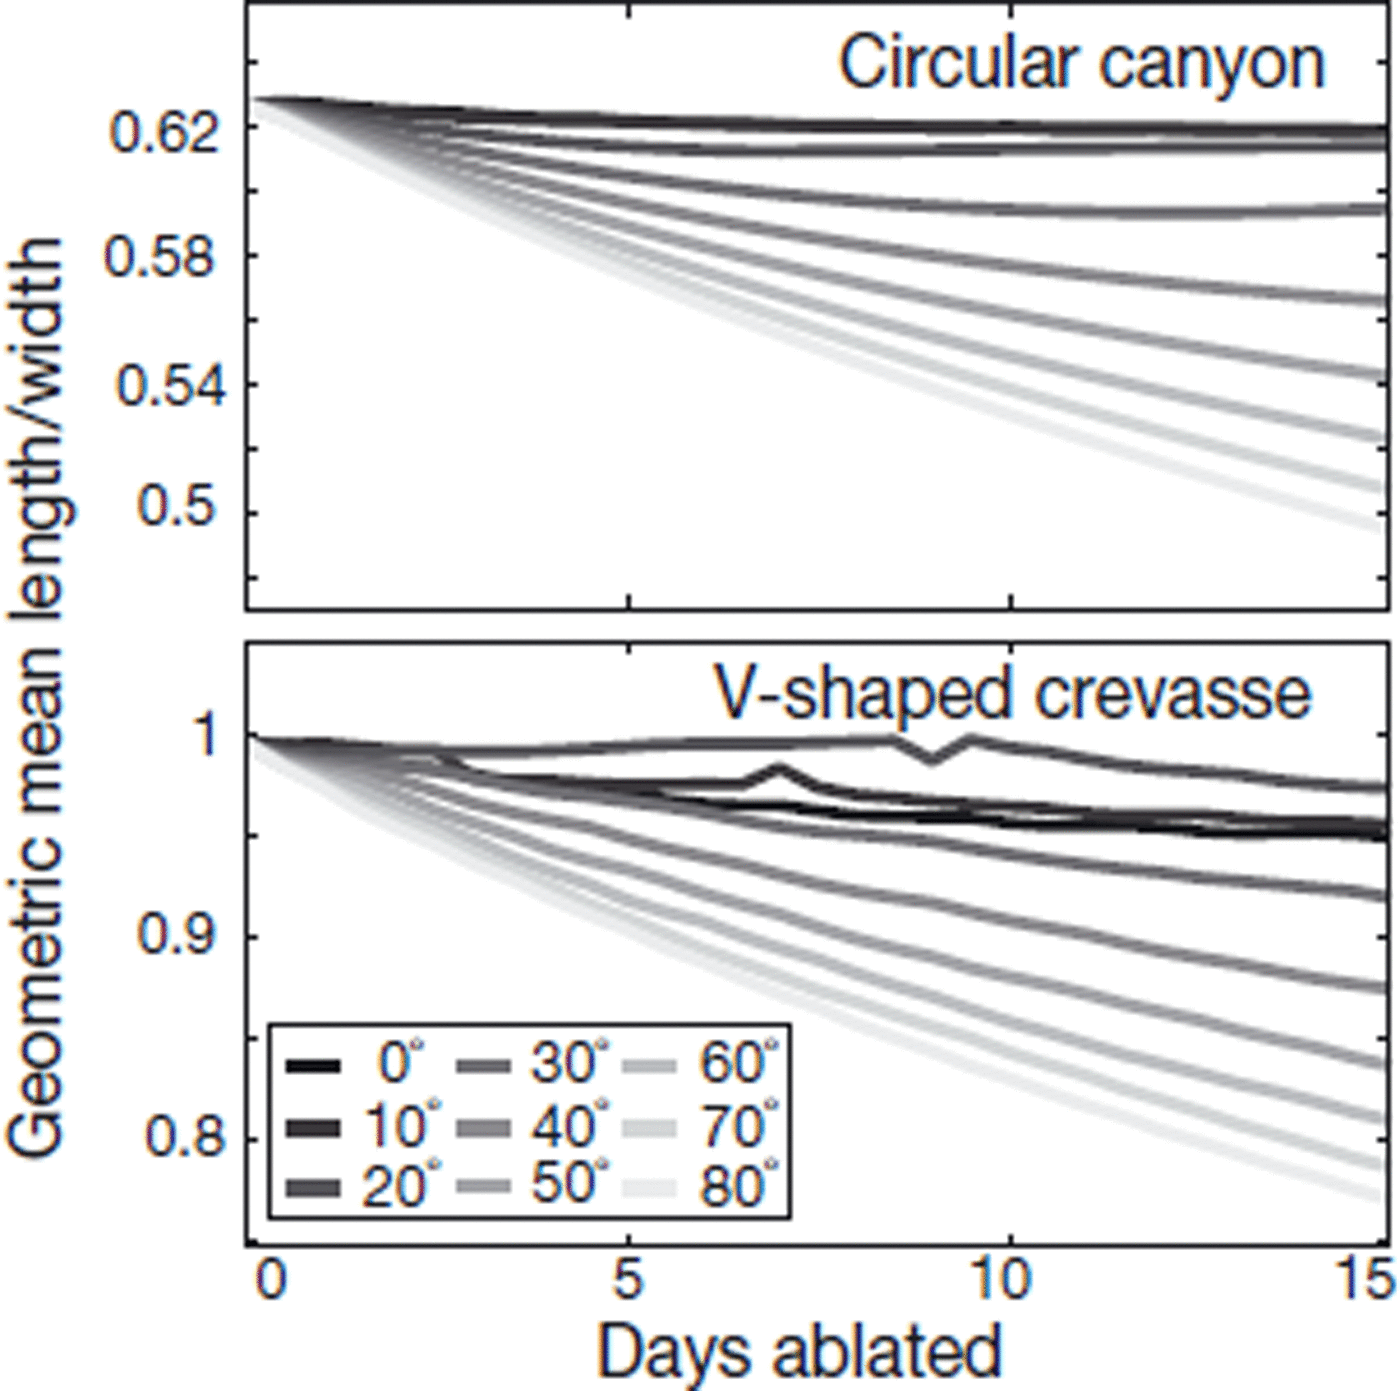
Fig. 10. Changes in effective aspect ratio relative to initial aspect ratio for circular-canyon surface features with fixed solar zenith angles. This plot shows the evolution of the aspect ratio of a circular canyon and a V-shaped crevasse over 15 days of ablation under constant zenith angle.


