


Non-communicable diseases (NCD), mainly CVD, cancers, diabetes and chronic respiratory diseases, continue to be important public health problems worldwide(Reference Habib and Saha1). The growing epidemic of NCD is a result of globalisation of unhealthy lifestyles, including an increase in prevalence of poor dietary habits and low physical activity(Reference Forouzanfar, Afshin and Alexander2). An important dietary pattern that undoubtedly contributes to a decreased risk of NCD is a plant-based diet with a high frequency of legume consumption(Reference Singh, Pratap, Singh, Praharaj and Singh3). The presented beneficial effect is mainly the result of the relatively low energy density of legumes and their high nutritive value(Reference McCrory, Hamaker and Lovejoy4,Reference Rebello, Greenway and Finley5) . Legumes are also a significant source of many biologically active compounds, such as vitamins, minerals and phenolic compounds, which together present preventive activities against many of the abovementioned diseases(Reference McCrory, Hamaker and Lovejoy4,Reference Özcan, Dursun and Juhaimi6) .
Therefore, due to the high pro-health potential of legumes, the FAO includes them as an important component of healthy diets and identifies them as having significant potential roles in sustainable and healthy food systems(Reference Calles, Del Castello and Baratelli7). Additionally, the importance of the role of legumes in a balanced diet and of planning a couple of meatless meals each week is highlighted by Canada’s Food Guide and EAT-Lancet Commission in 2019(8,9) . In addition, the definition of the ‘Mediterranean Diet’, which is recognised internationally as an evidence-based biomedical model of healthy nutrition, includes guidelines for a high intake of legumes(Reference Davis, Bryan and Hodgson10). Nevertheless, there is thus far no consensus around a recommended target amount of legumes to be consumed on any given day; although in 1989, the WHO Study Group had already recommended an intake at least 30 g/capita per d of pulses, nuts and seeds as a part of the recommended 400 g/capita per d fruit and vegetable consumption(Reference Nishida, Uauy and Kumanyika11).
Legumes are still, in some areas, a basic human foodstuff, with consumption ranging from 27 g/capita per d in South America and India up to 134 g/capita per d in Burundi. In other regions, mainly in the Western world, a fairly low consumption of legumes at <8–14 g/capita per d has been reported, and unfortunately, the frequency of legume consumption has undergone a slow but constant decline in both developed and developing countries(Reference Mudryj, Yu and Hartman12).
In Poland, over the past few decades, periodic decreases and increases in legume consumption have been observed. In the 1970s, a sharp decrease in legume consumption among the Polish population was observed; then, in the 1980s, the consumption was higher (almost 14 g/capita per d); consumption fell again in the 1990s and consequently continued to decrease in the new millennium(Reference Górnicka, Pierzynowska and Wiśniewska13). However, according to the Food and Agriculture Organization Statistics database(Reference Seabra-Pinto and Traversac14) at the beginning of the 21st century, the main consumers of legumes in the EU lived in Italy, Spain, the UK, Romania and, surprisingly, in Poland, where the average consumption was 5 g/capita per d. In the same period, Górnicka et al. (Reference Górnicka, Pierzynowska and Wiśniewska13) found that the average consumption of dry legumes in Poland was even lower and amounted to <2·5 g/capita per d.
Although some survey data indicate that legume consumption is low, little is known about sociodemographic or health-related factors acting as barriers to, or motivators for, legume consumption, globally. There are few studies on sociodemographic factors related to legume consumption habits, and these studies were performed mainly among the US population(Reference Lucier, Biing-Hwan and Allshouse15–Reference Winham, Tisue and Palmer17). In Poland, in the previous decades, dietary habits concerning legumes were mostly related to the type of household; legume consumption was almost twice as high in farms as in employee households(Reference Górnicka, Pierzynowska and Wiśniewska13). The following barriers to regular legume consumption were determined: gastrointestinal symptoms, an inability to prepare meals with legumes, time consumption of preparation of legume meals, scarce number of traditional meals with legumes and only seasonal consumption of peas, beans and broad beans(Reference Górnicka, Pierzynowska and Wiśniewska13).
Because the consumption of legumes was low in Poland, it is important to identify specific sociodemographic factors and health-related variables related to dietary habits regarding legume consumption. Such information could be helpful for dietitians and other public health workers to create nutritional education targeted to vulnerable groups of people. Additionally, a public increase in awareness about the beneficial properties of legumes could provide health, environmental and economic profits.
Therefore, the aims of the present study were: (i) to estimate the frequency of legume consumption in a study sample from Poland; (ii) to assess relationships between frequency of legume consumption and sociodemographic, health status and health-related variables and (iii) to describe the sociodemographic and health lifestyle profiles of ‘frequent’, ‘rare’ and ‘never consumers’.
Methods
Participants and procedure
The participants were enrolled, and surveys were administered between March and November 2018. A cross-sectional study with a self-administered questionnaire was used to estimate the frequency of legume consumption and to characterise participants in terms of sociodemographic factors: sex, age, place of residence, years of education, type of work and numbers of co-residents; health status: prevalence and type of diseases; and health-related variables: being on specific diets, intake and type of dietary supplements, duration and frequency of dietary supplementation, frequency and type of leisure-time physical activity.
Participation in the present study was voluntary and anonymous. Written informed consent was obtained from all subjects. In the case of people completing the questionnaire remotely, consent was electronically given before the survey began. The title and description of the questionnaire specified that the questionnaire was specifically for the Polish population. Originally, the study included 1144 participants. We excluded nine people who were >80 years old. Finally, the survey included responses from 1135 participants aged 18–80 years old.
The questionnaire was created by the researchers in Google Forms. We used two techniques to collect data in the survey: computer-assisted web interviewing (CAWI) and paper-and-pencil interviewing (PAPI). A link to the online questionnaire (CAWI) was distributed through social media websites, for example, via posts on social media platforms, on social networking forums, on blogs or sent by email and Messenger applications to the respondents. The paper version of the questionnaire (PAPI) was given to participants who did not use a computer or mobile phone effortlessly. However, the questionnaire was always completed by participants on their own, without the support of the researchers involved in this project. For the PAPI method, the respondents were recruited from senior club members, technology companies, public offices and hospitals.
Data collection and measures
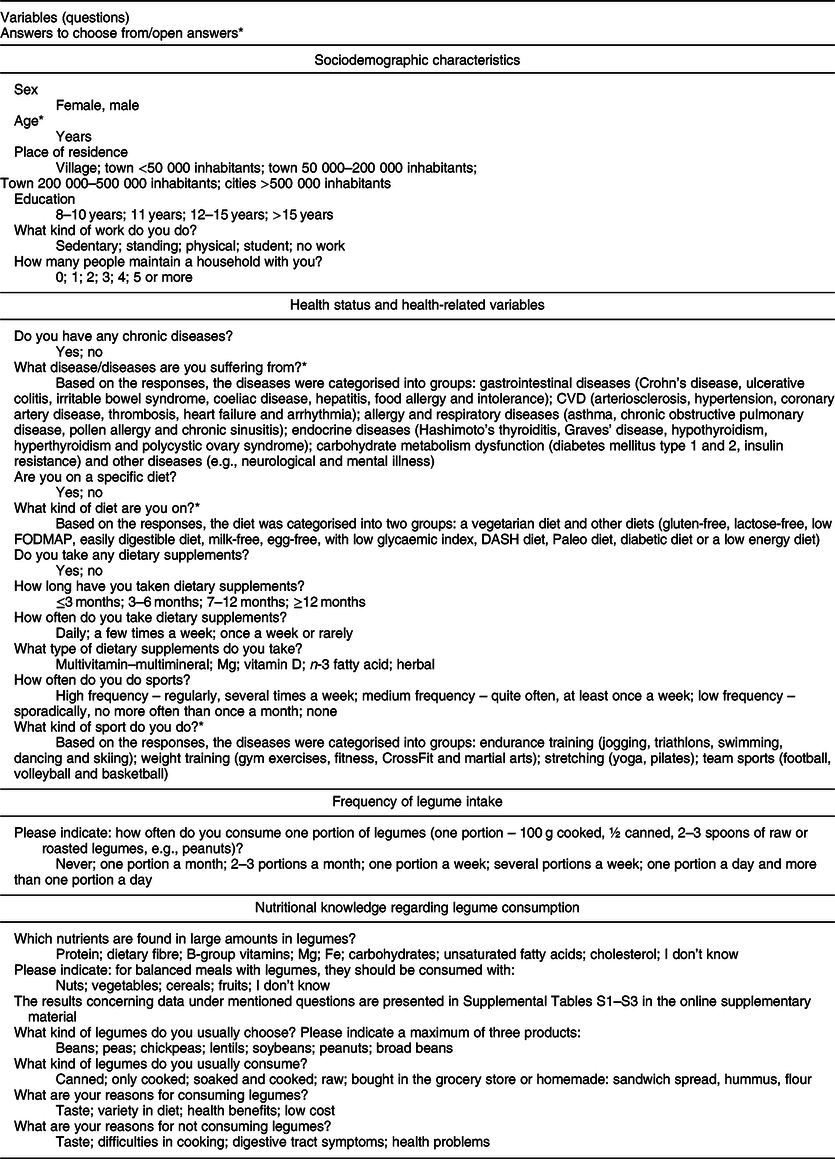
The questions and the type of answers that were included in the questionnaire are presented in Table 1. The legume intake in a study sample was calculated as ready-to-eat amount: cooked, canned and raw or roasted, for example, peanuts. Based on the responses about frequency of legume consumption, the respondents were categorised into three groups: ‘frequent consumers’ (more than one portion per week – 1/p/week) – 22·8 %; ‘rare consumers’ (1/p/week and less) – 72·1 %; and ‘never consumers’ – 5·1 %.
Table 1 Questions and answers which were included in the questionnaire
Due to the self-administration of the questionnaire, the following questions were missed by participants: for duration of dietary supplementation (n 18), for frequency of dietary supplementation (n 14) and for forms of legumes (n 16).
Data analysis
χ 2 tests, ANOVA and multiple correspondence analysis (MCA) were conducted with Statistica 13, PL (StatSoft). The χ 2 test was used for comparison of the distributions for the following categorical variables among ‘frequent’, ‘rare’ and ‘never legume consumers’: sex, place of residence, years of education, type of work, number of co-residents, prevalence of chronic diseases, type of diseases, type of diets, intake and type of dietary supplements, duration and frequency of dietary supplementation, frequency and type of leisure-time physical activity, dietary habits related to legume consumption and nutritional knowledge. Due to non-parametric distribution of the data, the differences in age between the three subgroups of legume consumption were analysed with Kruskal−Wallis ANOVA with post hoc multiple comparison analysis.
Correspondence analysis was used to describe the sociodemographic and health-related profiles of ‘frequent’, ‘rare’ and ‘never legume consumers’. Therefore, categorical variables of sociodemographic factors and health-related variables were mapped in a low-dimensional space (two dimensional). MCA, an extension of correspondence analysis, was used due to multiple variables. To conduct the MCA, a multidimensional contingency table of all two-way cross-tabulations across all variables, called the Burt matrix, was analysed.
Additionally, the interrelationship among sociodemographic factors and health-related variables among all participants as well as in the subgroups was examined through a structural equation modelling analysis, conducted with IBM AMOS version 24, using estimation Markov chain Monte Carlo.
For all statistical procedures, the significance level was considered to be <0·05.
Results
Characteristics of all respondents
The average consumption of ready-to-eat legumes amounts was approximately 21 g/capita per d in all respondents, and approximately 16 g/capita per d in the non-vegetarian respondents. Moreover, ‘rare legume consumers’ declared approximately 7 g/capita per d (data not shown in tables).
The sociodemographic characteristics of all respondents are presented in Table 2. The analysis included a total of 1135 participants aged 18–80 years old (median 32 years (Q1–Q3 24–48)). Slightly more than half of them were female (53·7 %), and most participants (44·6 %) were residents of cities with more than 500 000 inhabitants and had >15 years of education (48·4 %). Approximately one-third of all respondents had a sedentary type of work, and the majority of them lived alone or with one or two co-residents.
Table 2 Sociodemographic characteristics of all respondents and the subgroups related to the frequency of legume consumption
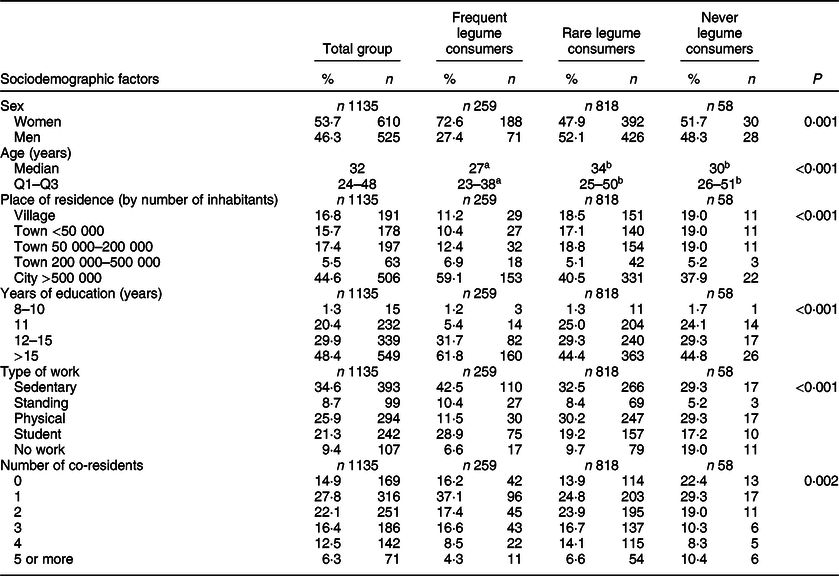
Q1, first quarter; Q3, third quarter
Significant differences in distribution are presented with χ 2 test (P < 0·05).
a,bResults within a row with unlike superscript letters were significantly different (Kruskal−Wallis ANOVA, P < 0·05).
Health status and the health-related variables are presented in Table 3. Approximately one-quarter of the whole group suffered from at least one chronic disease, and the most common were CVD (32·5 %), followed by endocrine (30·4 %) diseases. Almost 10 % of all respondents were on a vegetarian diet. Approximately half of all participants took dietary supplements; more than half of them took dietary supplements daily, and approximately 42 % of this group had supplemented their diets for more than 12 months. The most commonly taken supplement was a multivitamin–multimineral (81·8 %), followed by vitamin D (60·8 %), Mg (45·7 %), n-3 fatty acids (20·1 %) and herbal supplements (2·8 %). A high level of leisure-time physical activity was reported by approximately 28 % of participants, and the most common type of exercise was endurance training (68·1 %), followed by weight training (39·3 %), stretching (13·3 %) and team sports (4·4 %).
Table 3 Health status and health-related variables of all respondents and in the subgroups related to frequency of legume consumption
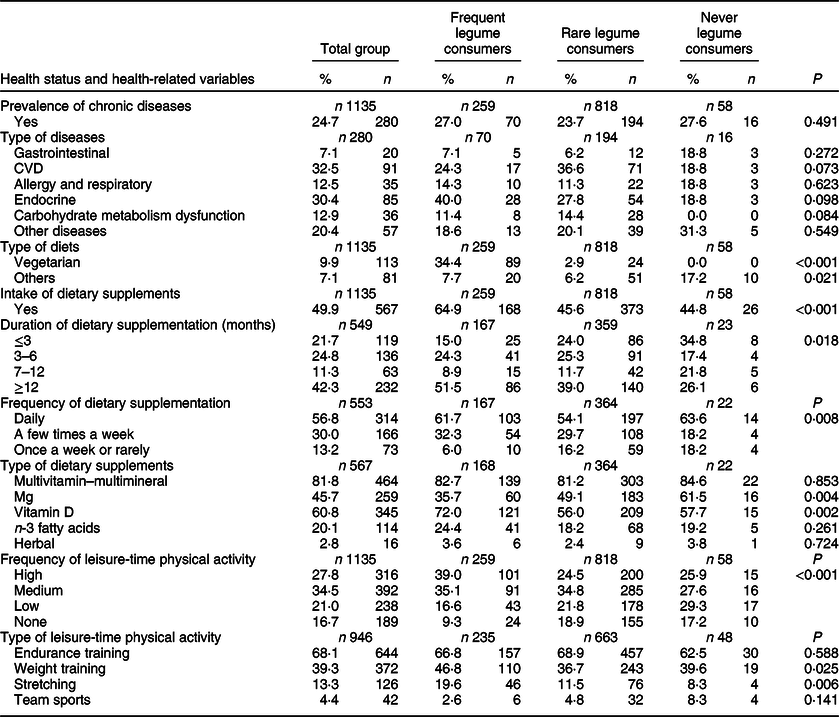
Significant differences in distribution are presented with χ 2 test (P < 0·05).
Characteristics of the respondents in relation to frequency of legume consumption
Table 2 presents the sociodemographic differences among ‘frequent’, ‘rare’ and ‘never consumers of legumes’ based on the statistical analyses. There were significantly different distributions of sex, age, place of residence, years of education, type of work and number of co-residents among these three subgroups of participants. ‘Frequent legume consumers’ were the youngest of the respondents; the majority of them were female, lived mainly in cities with more than 500 000 inhabitants, had more than 15 years of education, worked sedentary jobs or were students and most often lived with one co-resident (presented in Table 2). Among ‘rare’ and ‘never legume consumers’, similar distributions of sex, age, place of residence and years of education were observed. However, ‘never consumers’ more often did not work at all. The MCA revealed the sociodemographic profile of ‘frequent’, ‘rare’ and ‘never legume consumers’, as depicted in Fig. 1. The two dimensions accounted for 21·81 % of the variance (13·59 % for the first dimension and 8·22 % for the second dimension), indicating that the horizontal spread (first dimension) of the points captured the most essential information. The first dimension (horizontal axis) perfectly discriminated the ‘frequent’ from the ‘rare’ and ‘never consumers of legumes’ and specific sociodemographic factors were clustered around them, while the second dimension (vertical axis) indicated differences between ‘rare’ and ‘never legume consumers’. Additionally, the MCA revealed that living in villages or small towns (<50 000 inhabitants) with three or five co-residents and having 8–10 years of education mostly corresponded with being a ‘never consumers of legumes’.
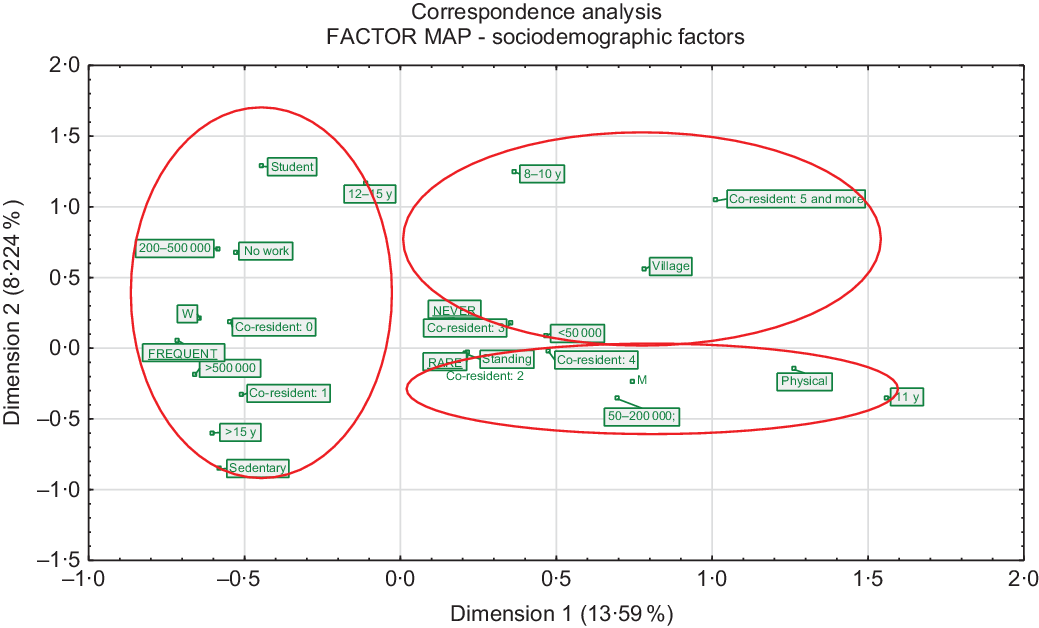
Fig. 1 Results of the multiple correspondence analysis of sociodemographic factors and respondents with different frequencies of legume consumption (frequent, rare and never). M, men; W, women; <50 000, town with <50 000 inhabitants; 50–200 000, town with 50 000–200 000 inhabitants; 200–500 000, town with 200 000–500 000 inhabitants; >500 000, city with >500 000 inhabitants; 8–10 y, 8–10 years of education; 11 y, 11 years of education; 12–15 y, 12–15 years of education; >15 y, >15 years of education; physical, physical type of work; standing, standing type of work; sedentary, sedentary type of work
Differences in health status and health-related variables among ‘frequent’, ‘rare’ and ‘never legume consumers’ are presented in Table 3. The prevalence of chronic diseases as well as the frequency of particular types of diseases were similar among the ‘frequent’, ‘rare’ and ‘never legume consumers’. There were statistically significant differences in the distribution of individuals consuming a vegetarian diet or other types of diets, intake and type of dietary supplements, duration and frequency of dietary supplementation, frequency and type of leisure-time physical activity among these three subgroups of participants. Vegetarianism was declared mainly by ‘frequent legume consumers’; moreover, this subgroup of participants most often took dietary supplements and did so for the longest duration. ‘Frequent consumers’ additionally declared vitamin D supplementation most often. The highest frequency of leisure-time physical activity was demonstrated in ‘frequent consumers’ and resulted mainly from endurance and weight training. In contrast to the other two subgroups, ‘never legume consumers’ did not declare being on the vegetarian diet at all, while they declared other types of diets significantly more often. Among ‘rare’ and ‘never consumers’, a similar distribution of exercise type and type of dietary supplements, except Mg, was presented. However, ‘never consumers’ had a slightly lower frequency of leisure-time physical activity. Additionally, the MCA presented health-related profiles of ‘frequent’, ‘rare’ and ‘never legume consumers’ as depicted in Fig. 2. The two dimensions accounted for 29·30 % of the variance: 21·18 % for the first dimension and 8·12 % for the second dimension, indicating that the first dimension captured the most essential information. Again, similar to the MCA for sociodemographic factors, the first dimension (horizontal axis) perfectly discriminated the ‘frequent’ from the ‘rare’ and ‘never legume consumers’ and clustered health-related variables around them. The second dimension (vertical dimension) did not indicate differences between ‘rare’ and ‘never consumers of legumes’ but only discriminated health-related variables. Interestingly, the MCA revealed that the occurrence of diseases corresponded with ‘frequent consumers’.
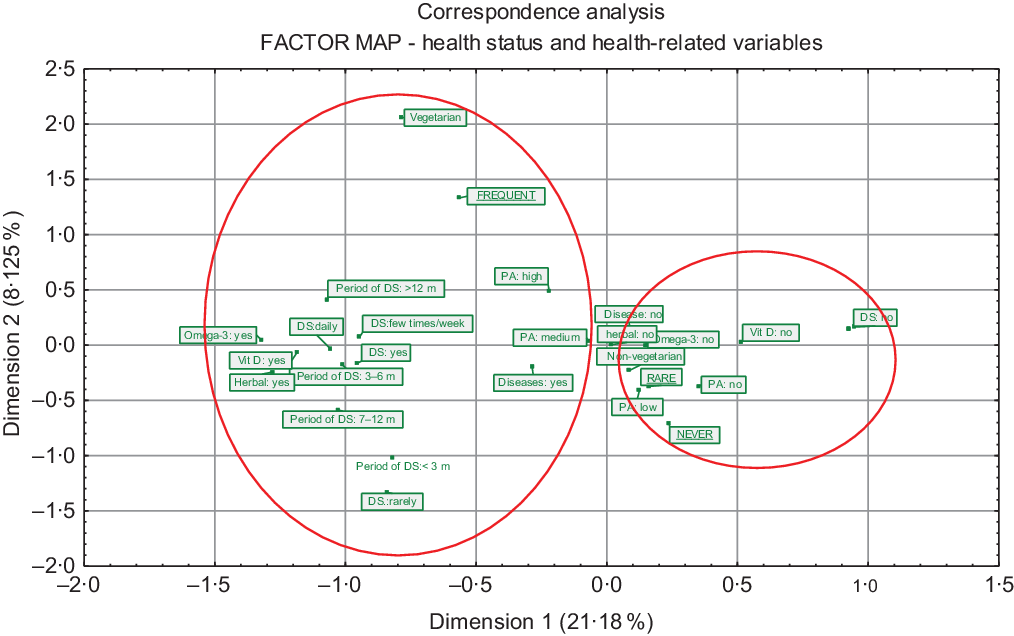
Fig. 2 Results of the multiple correspondence analysis of health status and health-related variables and respondents with different frequencies of legume consumption (frequent, rare and never). DS, dietary supplementation; duration of DS, duration of dietary supplementation; PA, physical activity; m, months
Additionally, significant interrelationships between sociodemographic factors and health-related behaviour as well as indirect associations of sociodemographic factors with health status and health-related variables (evaluated via general construct – health-related behaviour) in total study sample as well as in subgroups of frequent, rare and never legume consumers were revealed based on structural equation modelling analyses (see online supplementary material, Supplemental Tables S4 and S5 and Supplemental Fig. S1).
Nutritional knowledge regarding legume consumption in all participants and in subgroups related to frequency of legume consumption
Nutritional knowledge regarding legume consumption in all respondents and in subgroups related to the frequency of legume consumption is presented in Table 4. Only one-quarter of respondents knew which legume products should be consumed to meet the indispensable amino acid requirements. More than half of all the respondents knew that legumes are rich sources of protein (65·7 %) and dietary fibre (53·6 %), while only one-third and approximately one-sixth of the participants indicated that legumes are rich sources of B-group vitamins and carbohydrates, respectively.
Table 4 Nutritional knowledge regarding legume consumption in all respondents and in the subgroups related to frequency of legume consumption
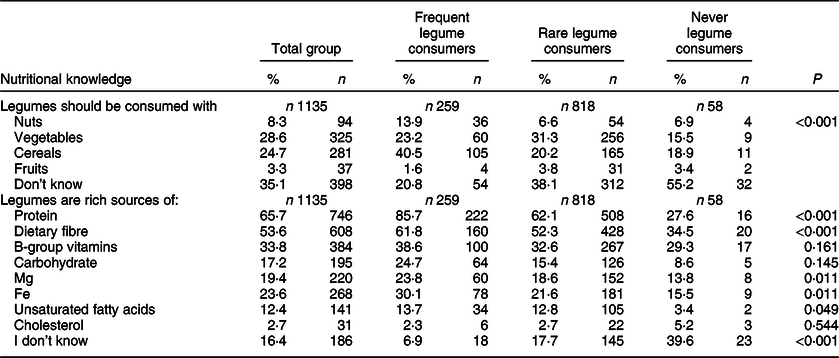
Significant differences in distribution are presented with χ 2 test (P < 0·05).
The ‘frequent legume consumers’ had a better knowledge of balanced meals with legumes in comparison to the ‘rare’ and ‘never consumers’. Approximately 40·0 % of ‘frequent consumers’ knew that legumes should be consumed with cereals, while among ‘rare’ and ‘never consumers’, only approximately one-fifth indicated this answer. ‘Frequent consumers’ also had better knowledge about the nutrients that are found in large amounts in legumes than ‘rare’ and ‘never consumers’. The vast majority of ‘frequent legume consumers’ indicated that legumes are rich sources of protein; less of them reported the same for dietary fibre, B-group vitamins and carbohydrates.
Discussion
A large amount of epidemiologic data has shown that diet quality often follows a socio-economic gradient(Reference Naja, Nasreddine and Itani18–Reference Markussen, Veierød and Kristiansen20). However, only a few studies have addressed the matter of social inequality in the consumption of legumes(Reference Palmer, Winham and Oberhauser16,Reference Winham, Tisue and Palmer17) . Worldwide, legumes are still known mainly as food products widely used by low-income populations or as components of a vegetarian diet(Reference Mitchell, Lawrence and Hartman21,Reference Orlich, Jaceldo-Siegl and Sabaté22) . Indeed, in our study, one-third of the participants from the ‘frequent consumers’ subgroup were on a vegetarian diet, compared with a marginally low percentage of respondents from ‘rare consumers’ subgroup and none from ‘never consumers’ subgroup. Legume consumption has been connected with vegetarian dietary patterns as an alternative source of animal-based proteins due to their high content of peptides as well as the variety of other bioactive nutrients(Reference McCrory, Hamaker and Lovejoy4,Reference Mudryj, Yu and Hartman12,Reference Mitchell, Lawrence and Hartman21,Reference Kniskern and Johnston23) .
In our study, we determined that more than three-quarters of the surveyed group consumed only one portion or less of ready-to-eat legumes per week, while approximately one-fifth of them routinely included legumes in their diet. Currently, there is a growing trend towards lowered consumption of legumes, especially in developing and highly developed countries. Mainly in Europe and the USA, the consumption of legumes is far below recommendations(Reference Miller, Mente and Dehghan24). Interestingly, in the Mexican population, rapid changes in dietary habits were observed recently. Although the traditional Mexican diet consists of high amounts of fruit and vegetables, including legumes, their intakes of legumes were the lowest relative to the recommendations for the Mexican population. The observed changes in dietary habits resulted mainly from lifestyle changes, which were strongly related to the demographic and epidemiologic transition in recent decades(Reference Aburto, Pedraza and Sánchez-Pimienta25).
In our study, we showed that ‘frequent consumers of legumes’ were from higher sociodemographic backgrounds in general and were characterised mainly as young, highly educated women from large or medium cities who lived alone or with one co-resident. These results are contradictory to findings from French and Spanish populations; the frequency of pulse consumption by these populations was higher mainly in rural areas, among lower socio-economic groups, and in households with four or more persons. On the other hand, in France, similar to our results, younger people consumed pulses more often than older people(Reference Schneider26). Differences between Poland and France as well as Spain could result from different times of conducted research. Rapid urbanisation and transition in the economy probably contributed to adverse changes in dietary habits resulting in lower legume consumption, not only in Poland but also in Western Europe. Unfortunately, there are no recent data on socio-economic factors influencing legume consumption in European countries, which makes comparison difficult.
The finding that women are much more likely than men to consume legumes is inconsistent with results from other studies(Reference Mudryj, Yu and Hartman12,Reference Aburto, Pedraza and Sánchez-Pimienta25) . Differences between men and women with respect to dietary intake and eating behaviours have been previously reported many times and could also be explained by sex differences in motivational variables associated with the regulation of food intake. Previous studies supporting our results have shown that women had a higher fruit and vegetable intake due to their displaying more health-promoting behaviours, healthier lifestyle patterns, higher nutritional knowledge and are more concerned about environmental quality than men(Reference Blanck, Gillespie and Kimmons27–Reference Mohai30).
In our results, a high frequency of legume consumption was mainly observed among respondents with urban lifestyles. More homogenous populations live in rural than in urban areas in general, and therefore, fewer food choices in rural areas result in less dietary variation and the prevalence of a more traditional diet(Reference Dehghan, Ilow and Zatonska31). Results similar to ours were found in the Prospective Urban and Rural Epidemiological study among eighteen countries, including Poland(Reference Miller, Mente and Dehghan24). In this research, people who consumed more fruits, vegetables and legumes were more likely to live in urban areas(Reference Miller, Mente and Dehghan24). Urban inhabitants tended to be highly educated and therefore often presented with higher nutritional knowledge(Reference Chen, Cheng and Chuang32).
In the present study, people who consumed legumes frequently had better knowledge of the nutritive value of this food group. This could indicate the potential ability to translate nutritional knowledge into better dietary habits. Wardle et al. (Reference Wardle, Parmenter and Waller33) also found that knowledge was significantly associated with healthy eating, and the effect persisted even after controlling for demographic variables. Moreover, they indicated that nutritional knowledge was a partial mediator of the sociodemographic variation in intake, especially for fruit and vegetables. Studies have suggested that higher nutritional knowledge was strongly related to higher educational level in general(Reference De Vriendt, Matthys and Verbeke34,Reference Hendrie, Coveney and Cox35) . This is consistent with the findings of other research concerning socio-economic differences in dietary habits where educational level was strictly related to healthy food choices, especially to more frequent consumption of vegetables and fruits(Reference Roos, Hirvonen and Mikkilä36,Reference Shohaimi37) . In the cross-world Prospective Urban and Rural Epidemiological study, the frequency of vegetable, fruit and legume consumption was also significantly higher among people with higher education levels(Reference Miller, Mente and Dehghan24). However, in a study concerning diet quality among Americans, it was found that a high education level did not increase the frequency of legume consumption(Reference Hiza, Casavale and Guenther38). Moreover, Lucier et al. (Reference Lucier, Biing-Hwan and Allshouse15) suggested that a high education level was a factor that negatively affected dry bean and pea consumption. They showed that less educated respondents more often consumed legumes in comparison with better educated ones. One of the reasons for the low legume consumption among well-educated people is that these food products are still not as popular or easily recognised as a healthy choice as other vegetables and fruits are(Reference Lucier, Biing-Hwan and Allshouse15,Reference Hiza, Casavale and Guenther38) . On the other hand, a nine-to-five job may promote better educated people to seek out pro-health behaviours to compensate for their sedentary lifestyle.
One of the better-recognised predictors of a healthy diet, in addition to sociodemographic factors, is adherence to a health-conscious lifestyle. Indeed, many studies have clearly demonstrated that healthy dietary patterns are strongly related to healthy lifestyles in general(Reference Knudsen, Matthiessen and Biltoft-Jensen39–Reference Bingham, Jallinoja and Lahti-Koski41). Moreover, a higher sociodemographic background and health-conscious lifestyle are often interrelated, as was observed in this (results shown in the online supplementary material, Supplemental Tables S4 and S5 and Supplemental Fig. S1) and other studies(Reference Harrington, Fitzgerald and Layte42).
In the present study, we showed that ‘frequent consumers of legumes’ reported a high level of leisure-time physical activity. In the Prospective Urban and Rural Epidemiological study concerning dietary patterns among people from all over the world, physical activity was also positively associated with legume consumption(Reference Miller, Mente and Dehghan24). Additionally, young Spanish women who practiced physical activity consumed more legumes than physically inactive women(Reference Romaguera, Tauler and Bennasar43). Clustering high levels of physical activity with proper dietary choices related to legumes may result from the selection of foods rich in protein and complex carbohydrates as a perceived way of improving physical performance, as was also suggested by Romaguera et al. (Reference Romaguera, Tauler and Bennasar43).
Dietary supplementation is often recognised by people as a pro-health behaviour and this strategy is often observed among people with better dietary habits and better adherence to dietary recommendations when compared with non-users(Reference Reinert, Rohrmann and Becker44,Reference Foote45) . In the present study, we also showed that ‘frequent consumers of legumes’ more often declared dietary supplementation and supplemented more routinely. Additionally, this subgroup supplemented their diet with vitamin D and n-3 fatty acids with significantly higher frequency when compared with the rest of the participants; it was probably related to higher awareness of the need for dietary supplementation with vitamin D and n-3 fatty acids. n-3 and vitamin D deficiencies are widespread among Polish adults, affecting most of the population(Reference Płudowski, Ducki and Konstantynowicz46,Reference Dybkowska, Waszkiewicz-Robak and Świderski47) .
Limitations of the study
The present study has some limitations. The most important limitation relates to the representativeness of our study sample. Due to the lack of a representative group, the results of our study are generalisable only to the studied group of people. Additionally, the non-representative sample in our study might comparisons with other representative samples from other studies difficult.
Although the questionnaire was dedicated to Polish adults (this dedication was inserted into the title of the questionnaire), we did not ask about the nationality of our respondents; therefore, some errors related to nationality could have occurred. Another limitation of the study is related to the data collection. Potential limitations of the self-administered questionnaire, which we used in our study, are generally related to intake assessment, which might be invalid, due to memory gaps and social desirability. Furthermore, data were collected using two different techniques: CAWI and PAPI. This could have resulted in some methodological bias and might have affected the results. However, it should be noted that the questionnaire was always self-administered without staff help. Some interesting points of view could appear with additional data on the income of respondents as well as their alcohol intake or smoking habits. These data could provide new perspectives on sociodemographic factors as well as health-related variables.
Implications of our findings
Currently, in times of increased incidence of non-communicable diseases and unsustainable use of resources as well as environmental pollution, transformation to a healthy diet, mainly plant based, seems to be necessary. In the present study, we found that consumption of legumes among surveyed adults from Poland is low. Awareness of factors that can be associated with eating habits is one of the most important determinants of nutritional educational success and could be used to target promotion of legume consumption. For this purpose, we determined the sociodemographic and health-related profiles of vulnerable groups: ‘rare’ and ‘never legume consumers’. This information could be helpful for dieticians and public health workers to organise educational nutrition programmes.
Given the potential implications of our findings, a follow-up study of the representative population is warranted to indicate factors associated with legume consumption.
Conclusion
Low frequency of legume consumption in a study sample of adults from Poland was strongly associated with male sex, low educational level, physical work, living in villages and small cities, and living with more than one co-resident; low legume consumption was also associated with sedentary lifestyle, no disease prevalence and no dietary supplementation. Understanding the factors that may relate to the frequency of legume consumption may be used to target promotion of legume consumption to mostly vulnerable group of adults.
Acknowledgements
Acknowledgements: None. Financial support: The publication was prepared under the project financed from the funds granted by the Ministry of Science and Higher Education in the ‘Regional Initiative of Excellence] program for the years 2019–2022, project number 016/RID/2018/19, the amount of funding 11 998 121.30 PLN; this research was financially supported by the Ministry of Health subvention according to number of STM.D040.18.031 from the IT Simple system of Wroclaw Medical University. Conflict of interest: None. Authorship: K.B.S. – research concept and design, collection and/or assembly data, data analysis and interpretation, writing the article, critical revision of the article and final approval of the article. H.G. – critical revision of the article and final approval of the article. K.A.Z.-S. – research concept and design, collection and/or assembly data, data analysis and interpretation, writing the article, critical revision of the article and final approval of the article. Ethics of human subject participation: The present study was conducted according to the guidelines laid down in the Declaration of Helsinki, and all procedures involving human subjects were approved by the Ethics Commission of Wroclaw Medical University. Written informed consent was obtained from all subjects.
Supplementary material
For supplementary material accompanying this paper visit https://doi.org/10.1017/S1368980020002116


