
In the original publication of Carson, Min, and Van Nuys (Reference Carson, Min and Van Nuys2024), our regression models include country fixed effects. Our inclusion of country fixed effects reflected the need to capture important country-level heterogeneity in the usage of racial tropes beyond what could be captured by our other variables. This was motivated by the theoretical concern that the unique histories of individual countries could attenuate or enhance the baseline level of racial trope prevalence. It is only by allowing for each country to have a potentially different intercept term that our study could properly estimate the separate effects of the Global South affiliation (or years since independence) on the use of racial tropes in a given PDB entry. However, one of our two key explanatory variables, Global South, is an attribute that does not vary within each country. This affects our ability to properly estimate the variable's average effect using country fixed effects.
An alternative approach that addresses this issue is country random effects, which capture unit-level heterogeneity while also allowing for estimates of unit-invariant measures.Footnote 1 This note reports results for the tests in Carson, Min, and Van Nuys (2024) using this other approach. For transparency and clarity, we present new results for all relevant tables and figures in the original.
Overall, the results confirm our original finding that American intelligence writing about the Global South is more likely to draw on racial tropes than similar items about developments in the Global North. Our original results also hold for a second measure of our main independent variable (years since independence). We briefly discuss a few differences from our original results below.
Results
Table C1 replicates the results in Table 4 of the main manuscript but uses mixed effects models with country random effects instead of country fixed effects. Models 1−4 in the original article use quasibinomial regressions to account for the fact that the outcome variables are proportions. Because we could not find a method to estimate quasibinomial regressions with country random effects, we instead use beta regressions.
TABLE C1. Results of regressions on relationship between racial tropes in PDB entries and measurements of the racialized Otherness

*p < .1; ** p < .05; *** p < .01
The new results suggest being associated with the Global South increases the likelihood racial tropes will appear in intelligence summaries in the President's Daily Brief. This is clearest in Models 1−4, which use our more sophisticated and nuanced measures of tropes that we produced using supervised learning methods. Compared to the original coefficient estimates, the magnitude of the Global South variable decreases by a factor of approximately 3 to 4. Nonetheless, Table C2, which reproduces Table 5 in the main manuscript, shows that being associated with the Global South results in a 39 to 49 percentage increase in the prevalence of racial tropes—a sizable and substantively important effect. The coefficients and predicted changes for the simpler dictionary-based counts in models 5−8 are also smaller than the original estimates, and only model 8 regarding irrationality maintains statistical significance. The directions of all four coefficients confirm our theoretical predictions, including the now-positive coefficient for belligerence. As models 1−4 retain their direction and significance, we see this as further evidence of the value of our machine learning approach over a more naive dictionary-based one.
TABLE C2. Predicted values from models in Table C1

The second measure of the independent variable, years since independence, produces results substantively similar to those in the original article. (Note that because the years since indepen- dence measure is continuous and varies within countries, the fixed effects concern above does not apply to this measure; we present these full findings to be comprehensive.)
One difference from the original results is about a control variable: democracy. In the original article, we briefly noted with interest the absence of a statistically significant relationship between regime type and use of racial tropes. In these updated results, however, the revised models 1 − 4 in Table C1 feature negative and statistically significant coefficients. This suggests that PDB entries involving autocracies may, in fact, rely more on racial tropes. This is consistent with existing research, noted in the original article, on the association between non-democracy and racial categories.
Figure C1 reproduces Figure 3 using mixed effects models that add a measure of topic preva- lence based on structural topic models. We find that the probability-based models maintain strong negative effects for the Global South. Our second measure, increasing years since independence, remains negatively related to the use of racial tropes across all models, consistent with the original results.
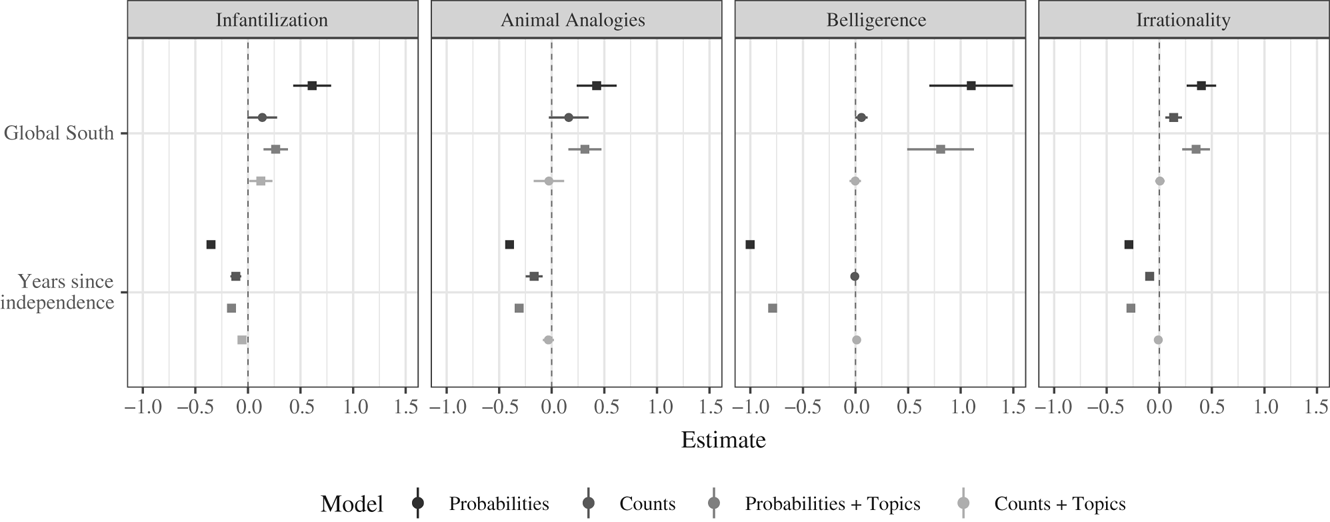
FIGURE C1. Coefficient plots of regressions in Table C1 and additional models that include topic prevalence measures from structural topic model. Bands represent 95 percent confidence intervals. Points with squares represent statistical significance at the 95 percent level.
Figure C2 reproduces Figure 5 from the original manuscript using mixed effects models that focus on regional variation (using Western Europe as the baseline category) rather than the Global South. We see very similar region-level results with the new models. One difference, however, is that text about the Middle East and North Africa region is now positively correlated with racial trope prevalence. The original article reported no relationship. This suggests intelligence writing about this part of the world may, in fact, be more likely to reflexively draw on racial tropes.
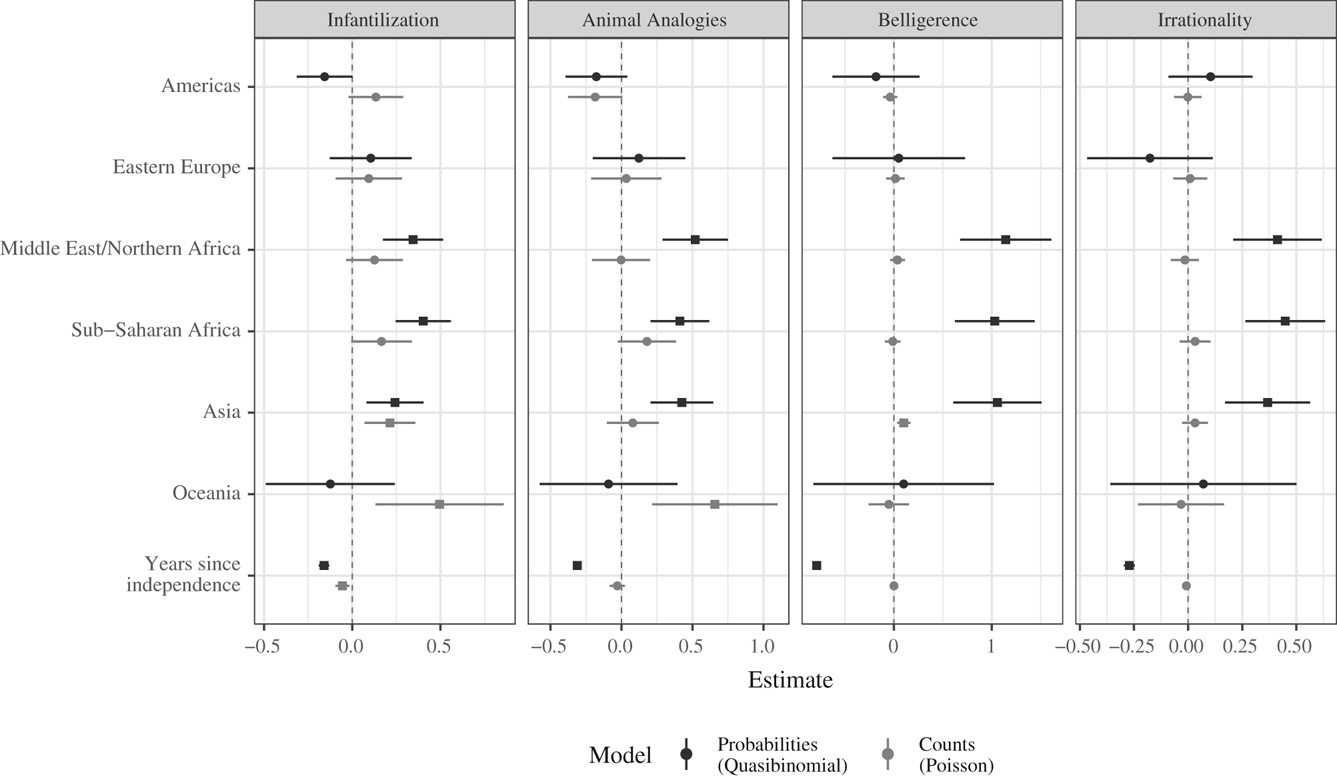
FIGURE C2. Coefficient plots of regressions disaggregating countries by region. Bands represent 95 percent confidence intervals. Points with squares represent statistical significance at the 95 percent level.
Figure C3 reproduces Figure 6 from the manuscript, which analyzed changes over time in the relationship between the Global South variable and racial tropes. The estimated coefficients in the count-based models are smaller in relation to those in the probability-based models, but we continue to see evidence of distinct temporal variation.
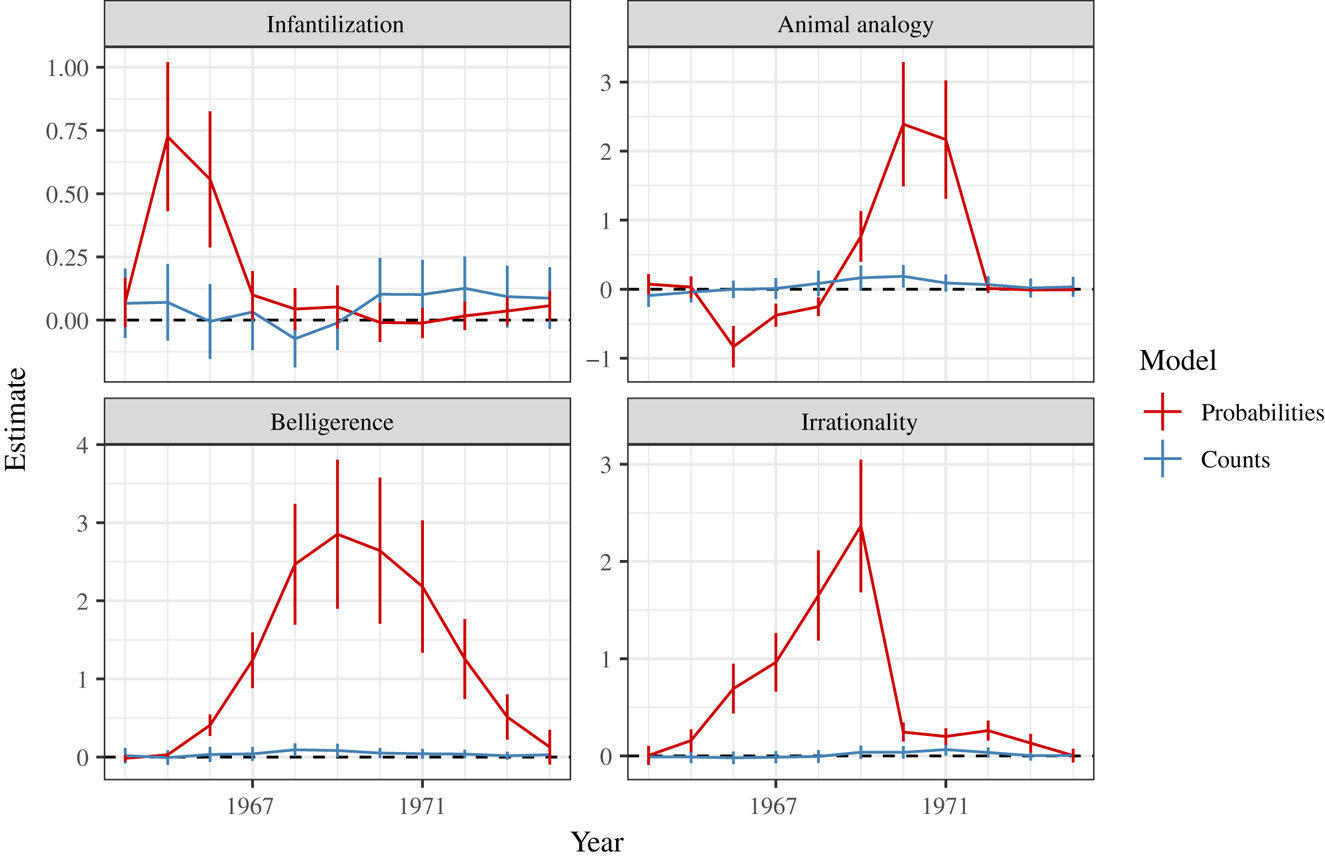
FIGURE C3. Coefficient estimates for the Global South variable, using a moving seven-year temporal window and full models accounting for topics. Bands represent 95 percent confidence intervals.
Summary
Neither the original fixed effects approach nor the revised random effects approach is a perfect solution to address unit-level heterogeneity. But as Beck and Katz (2001) noted in a renowned IO symposium on unmeasured heterogeneity, given the trade-offs associated with various approaches to capture unit-level heterogeneity, “one should examine the robustness of findings to alternative specifications and method” (494).Footnote 2 The fact that two sets of results point in the same direction lends additional confidence to our claims.


 Open access