Improving diet quality is a key health promotion strategy. Since 1980, a major theme of the US federal dietary guidelines has been to increase consumption of nutrient-rich foods and reduce consumption of energy-dense foods( 1 ). However, a large majority of the American population fails to meet these guidelines, with insufficient consumption of nutrient-rich foods such as fruit and vegetables and excessive discretionary calorie intake( Reference Krebs-Smith, Guenther and Subar 2 ).
Nutrition labels are an essential source for consumers to obtain nutrition- and health-related information on food products and serve as a population-level intervention with unparalleled reach( Reference Campos, Doxey and Hammond 3 ). A substantial proportion of US consumers report regular use of nutrition labels to guide their food selection( Reference Drichoutis, Lazaridis and Nayga 4 – Reference Grunert and Wills 7 ). The perception on the credibility of nutrition labels appears high, whereas findings on the relationship between nutrition label use and diet quality remain largely inconclusive( Reference Drichoutis, Lazaridis and Nayga 4 – Reference Grunert and Wills 7 ). Multiple systematic reviews suggest that nutrition labelling alone may not effectively reduce calorie selection or intake in general populations( Reference Kiszko, Martinez and Abrams 8 , Reference Sinclair, Cooper and Mansfield 9 ), although labelling appears somewhat effective when paired with interpretational aides such as statements about daily nutritional needs( Reference Sinclair, Cooper and Mansfield 9 ). The substantial variability in study results could be partially due to heterogeneities in nutrition label use and dietary habits across population subgroups. Children, adolescents, obese older adults, individuals with less education and/or nutrition knowledge, people with lower disposable income and those with limited health awareness are found less likely to use labels and/or effectively process the nutrition information presented( Reference Grunert and Wills 7 , Reference Satia, Galanko and Neuhouser 10 , Reference Govindasamy and Italia 11 ).
One population subgroup that has received less attention in the literature is college-aged students and young adults. These individuals are often included in the general adult population studies; however, there is evidence to suggest this particular subgroup warrants specific attention. During the college time period, many young adults are making the transition from living at home with their family members to living independently. This transition forces young adults to start developing their own habits, routines and preferences (including food and dietary decisions)( Reference Nelson, Story and Larson 12 ), many of which persist into adulthood. Unfortunately, two patterns have emerged for this age group: weight gain( Reference Vella-Zarb and Elgar 13 ) and decreased dietary quality( Reference Harris, Gordon-Larsen and Chantala 14 ). Nelson et al.( Reference Nelson, Story and Larson 12 ) noted that the transition from adolescence to adulthood is associated with decreased fruit and vegetable consumption, increased fast food and soft drink consumption, and lower levels of physical activity. More concerning, longitudinal studies show that poor dietary quality in young adulthood is associated with long-term risk of cardiovascular( Reference Mikkilä, Räsänen and Raitakari 15 ) and metabolic disease( Reference Steffen, Van Horn and Daviglus 16 ).
Nutrition labels may serve as an important preventive tool for college students and young adults by encouraging the formation of habitual behaviours that could profoundly impact their food preferences and diet quality later in life( Reference Nelson, Story and Larson 12 ). To date, much of the research assessing comprehension, predictors and the impact of nutrition label use on food behaviours and intake focuses on the general adult population. Limited research in young adults suggests that individuals in this subgroup may use nutrition labels, but frequency and predictors of usage are not well known. While the impact of food environment interventions has been reviewed in college students( Reference Roy, Kelly and Rangan 17 ), no reviews have focused on predictors or correlates of label usage in college students and young adults. Documenting factors that influence nutrition label use in this subgroup is particularly important for informing targeted nutrition interventions and improving the effectiveness of nutrition education programmes and awareness campaigns. The objective of the present study was to systematically review existing scientific evidence on the correlates of nutrition label use among college students and young adults 18–30 years of age.
Methods
Study selection criteria
Studies that met all of the following criteria were included in the review: study design was a randomized controlled trial, cohort study, pre–post study or cross-sectional study; population was college students and young adults 18–30 years of age; main outcome was nutrition label use (Nutrition Facts labels, labels within dining halls or nutrition labels in general); article type was a peer-reviewed publication; and language was English. Studies were excluded from the review if they met one or more of the following criteria: case reports or case–control studies; non-English publications; non-peer reviewed articles; experiments that require nutrition label reading as a prerequisite for study participation; and studies that assess participants’ preference for alternative label formats, belief on the accuracy of information presented on labels, label comprehension or intent to use some hypothetical rather than actual labels.
Search strategy
Keyword search was performed in PubMed, EBSCO, PsycInfo, Cochrane Library and Web of Science. The search algorithm included all possible combinations of keywords from the following three groups: (i) ‘nutrition’, ‘calorie’, ‘food’, ‘diet’ or ‘menu’; (ii) ‘label’, ‘labeling’ or ‘labelling’; and (iii) ‘college student’, ‘university student’, ‘young adult’, ‘university cafeteria’ or ‘college cafeteria’. Articles with one or more of the following keywords were excluded: ‘supplement’, ‘pharmacology’, ‘medication’, ‘allergy, ‘mice’ or ‘cigarette’. Titles and abstracts of the articles identified through keyword search were screened against the study selection criteria. Potentially relevant articles were retrieved for evaluation of the full text.
A cited reference search (forward reference search) and a reference list search (backward reference search) were also conducted based on the articles identified from the keyword search. Articles identified through forward/backward reference search were further screened and evaluated using the same study selection criteria. Reference searches were repeated on all newly identified articles until no additional relevant article was found.
Data extraction and synthesis
A standardized data extraction form was used to collect the following methodological and outcome variables from each included study: author(s), publication year, study design, setting, sample size, sample demographics, response and/or completion rate, participant recruitment criteria, nutrition label use, correlate(s) of nutrition label use, main findings and conclusions.
A meta-analysis could not be conducted due to the dissimilar nature of study designs and outcome measures (i.e. alternative definitions and instruments on nutrition label use). Analysis included a narrative review of the included studies with general themes summarized( Reference Zhu and An 18 ), in addition to a weighted average of nutrition label usage prevalence for the thirteen studies with similar Likert-scale responses for label usage frequency (most studies used 3-, 4- or 5-point scales). Responses were grouped into three categories: (i) always or often; (ii) sometimes; and (iii) rarely or never. Overall prevalence for each category was calculated by dividing the number of students in each category by the total sample size of all the included studies.
Study quality assessment
The quality of each study included in the review was assessed by the following eight criteria, adapted from the US National Institutes of Health( 19 ) recommendations and tailored specifically for assessing the cross-sectional studies included: (i) study design and data collection procedures were clearly documented (yes=1, no=0); (ii) sample size (400Footnote * or more participants=1, less than 400 participants=0); (iii) response or completion rate was reported (yes=1, no=0); (iv) survey instrument was validated (yes=1, no=0); (v) demographic correlates of usage (yes=1, no=0) were considered; (vi) non-demographic correlates of usage (yes=1, no=0) were considered; (vii) regression analyses were performed to examine the relationship between label usage and multiple predictor variables/correlates simultaneously (yes=1, no=0); and (viii) non-restricted population wherein participants were not excluded from eligibility for any factor other than age or student status (yes=1, no=0). Full definitions for all study criteria are available in Table 1. Given these criteria, total study quality score ranged between 0 and 8. Study quality score helped measure the strength of study evidence but was not used to determine the inclusion of studies.
Table 1 Definitions of study quality criteria

* At a minimum, how subjects were recruited and mode of data collection (e.g. in-person, online) should be indicated.
† Using the most conservative estimate of 50 % nutrition label usage prevalence, a power analysis indicates that at the 95 % confidence level, a sample size of 384 people would be needed to detect significant differences in usage.
‡ Surveys were considered validated if they were either adapted from previously published surveys or first pilot-tested with the population of interest.
§ Demographic correlates included: gender, age, class, education level, race/ethnicity, BMI and marital status.
|| Non-demographic correlates included: knowledge, attitudes, beliefs, self-efficacy, behaviours and nutrition education.
¶ Indicates the population was not restricted by any factor other than age or student classification.
Results
As Fig. 1 shows, among a total of 235 unduplicated articles identified through keyword and reference searches, 197 were excluded in title and abstract screening. The remaining thirty-eight articles were reviewed in full texts, in which twenty-two studies were excluded due to the following reasons: age ineligibility (n 3)( Reference Draper, Adamson and Clegg 20 – Reference Papakonstantinou, Hargrove and Huang 22 ), no assessment of nutrition label use (n 11)( Reference Gerend 23 – Reference Temple, Johnson and Archer 33 ) and an ineligible study design (n 8), which included six experiments that required participants to read a nutrition label( Reference Hoefkens, Pieniak and Van Camp 34 – Reference Walters and Long 39 ), one semi-structured interview( Reference van der Merwe, Kempen and Breedt 40 ) and one case–control study( Reference Shriver and Scott-Stiles 41 ). The remaining sixteen articles were included in the review.
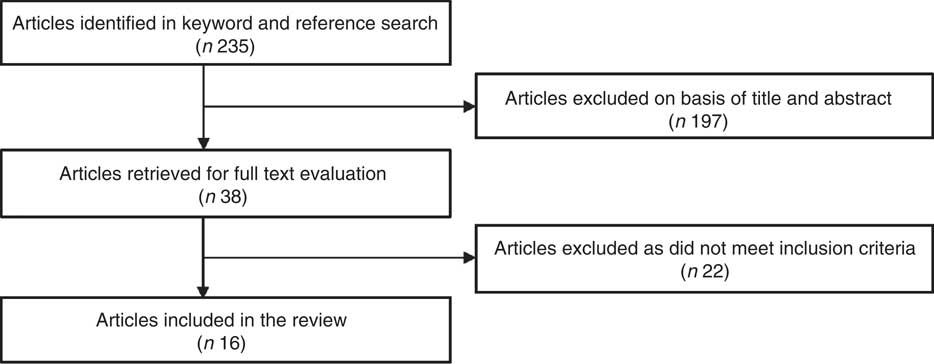
Fig. 1 Study selection flowchart
Basic characteristics of selected studies
Tables 2 and 3 summarize the sixteen peer-reviewed journal articles included in the review. All but two studies were published in 2005 or later. Studies were conducted in four countries: the USA (n 13)( Reference Cha, Kim and Lerner 42 – Reference Wie and Giebler 54 ), the UK (n 1)( Reference Cooke and Papadaki 55 ), Canada (n 1)( Reference Smith, Taylor and Stephen 56 ) and South Korea (n 1)( Reference Lim, Kim and Kim 57 ). Among the US-based studies, two were conducted in the West (California, Oregon)( Reference Li, Concepcion and Lee 48 , Reference Wie and Giebler 54 ), four in the South (Georgia, Missouri, Louisiana, Texas)( Reference Cha, Kim and Lerner 42 , Reference Marietta, Welshimer and Anderson 49 , Reference McLean-Meyinsse, Gager and Cole 51 , Reference Rasberry, Chaney and Housman 53 ), four in the Northeast (Pennsylvania, New York, Vermont, Connecticut)( Reference Conklin, Cranage and Lambert 43 , Reference Jasti and Kovacs 46 , Reference Krukowski, Harvey-Berino and Kolodinsky 47 , Reference Martinez, Roberto and Kim 50 ) and three in the Midwest (Nebraska, Minnesota, Ohio)( Reference Driskell, Schake and Detter 44 , Reference Graham and Laska 45 , Reference Misra 52 ). All studies were surveys conducted in college or university settings. Ten of these surveys were administered in person, four online( Reference Conklin, Cranage and Lambert 43 , Reference Graham and Laska 45 , Reference Wie and Giebler 54 , Reference Cooke and Papadaki 55 ), one via telephone( Reference Krukowski, Harvey-Berino and Kolodinsky 47 ) and one did not state the administration method( Reference McLean-Meyinsse, Gager and Cole 51 ).
Table 2 Basic characteristics of the studies included in the review
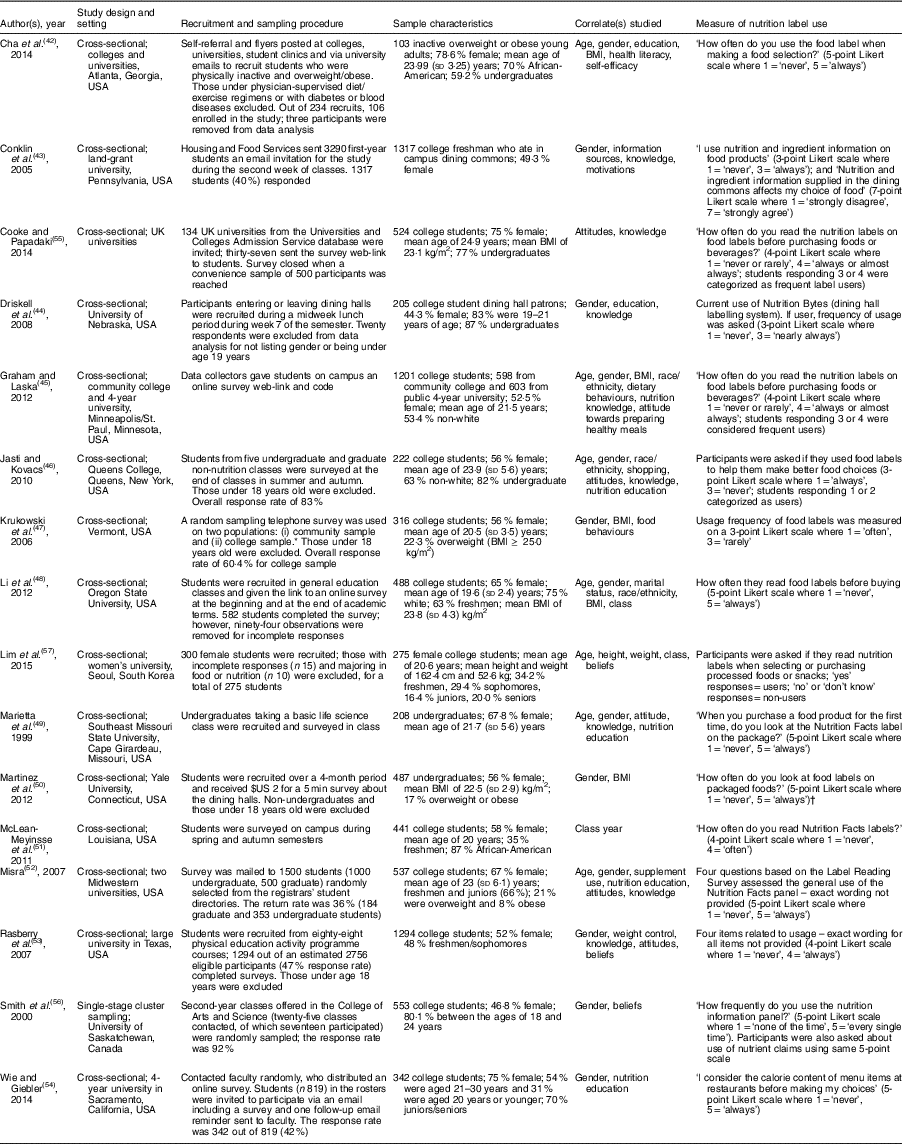
* For the purposes of the present review, we focus on the college sample results. However, in some cases, the authors only report results on the combined sample (these instances are identified in the findings section in Table 3).
† Exact usage questions not provided in the manuscript; the wording of this measure was obtained via personal communication with the corresponding author.
Table 3 Main findings and conclusions of the studies included in the review
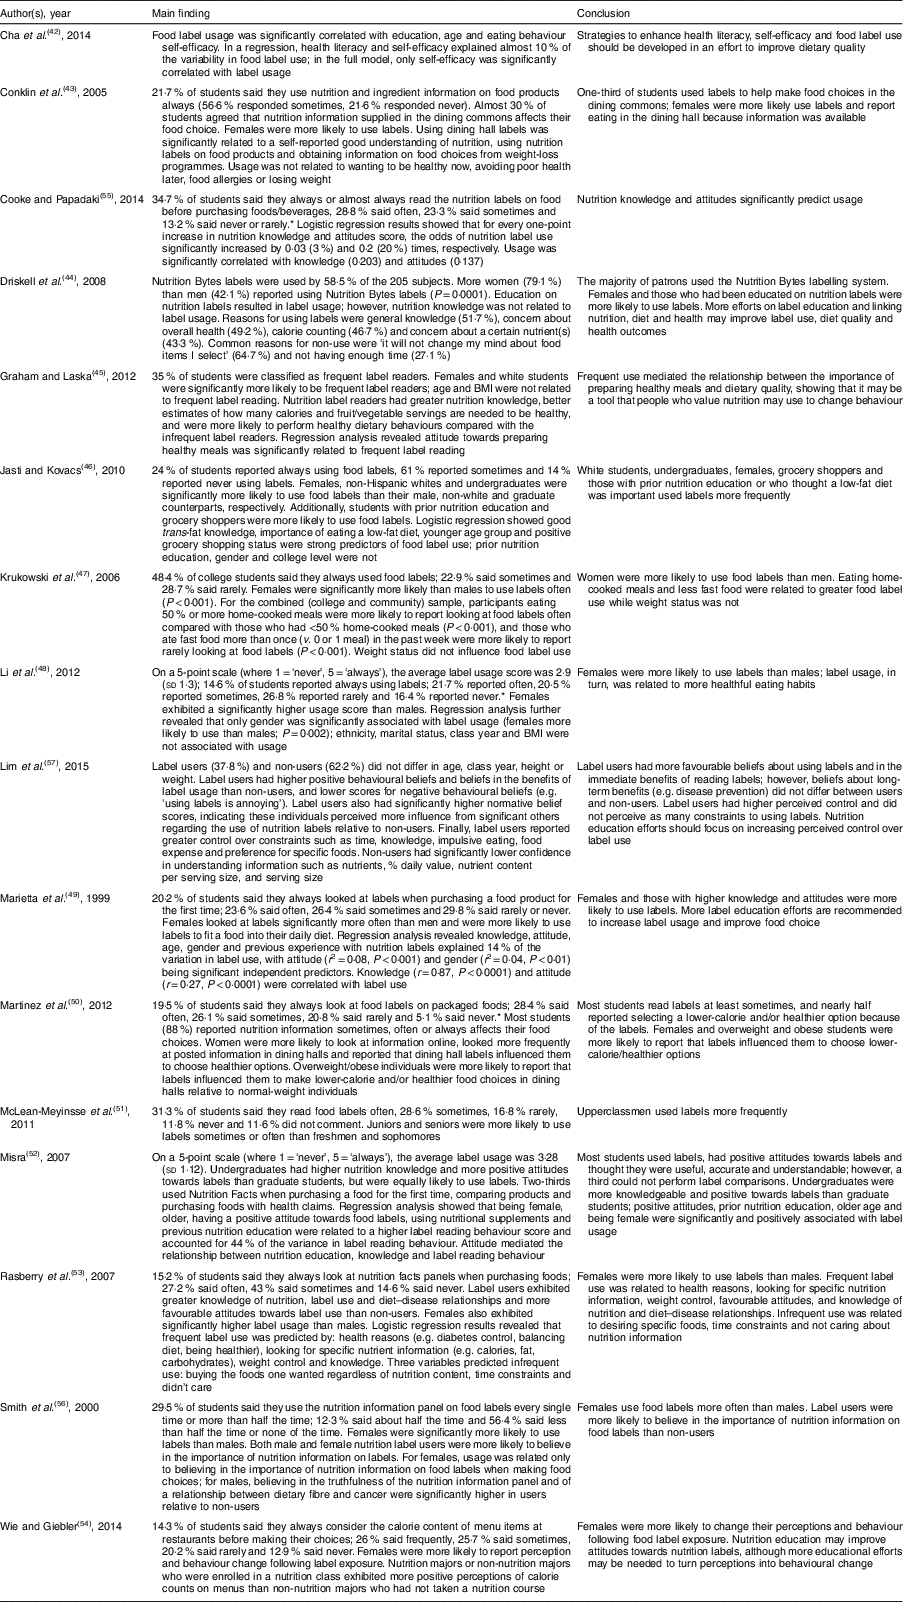
* Percentage breakdowns for each frequency category were not provided in the original manuscript. These numbers were provided through personal communication with the corresponding author.
Prevalence of nutrition label use
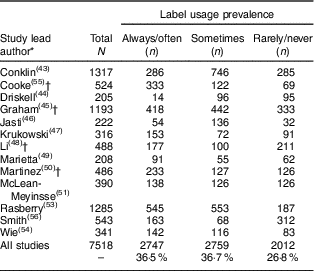
Although most of the studies had slightly different measures of label use, the majority of studies shared similar response categories for the frequency of label usage (3-, 4- or 5-point Likert scales that were typically anchored by ‘never’ and ‘always’). In order to merge the different scales, we look at usage frequency using a 3-point scale (‘always/often’, ‘sometimes’, ‘rarely/never’).Footnote † Thirteen out of the sixteen studies were included in this analysis; the remaining three were excluded for only reporting usage as a dichotomous (yes/no) variable( Reference Lim, Kim and Kim 57 ), not reporting overall usage frequency( Reference Cha, Kim and Lerner 42 ) and only reporting usage as a continuous number from the frequency scale( Reference Misra 52 ).Footnote ‡ Table 4 provides the breakdown for each frequency category across the thirteen studies. Using this information, we calculated a weighted average of label usage frequency among college students and young adults. As shown in Table 4, 36·5 % of college students reported using nutrition labels always or often. Almost the same percentage (36·7 %) of students reported using labels sometimes, whereas 26·8 % reported rarely or never using labels.
Table 4 Estimated label usage prevalence, by study and in aggregate
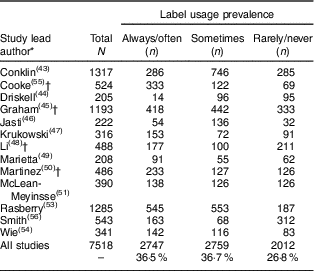
* Three of the sixteen studies could not be included in the review. Cha et al.( Reference Cha, Kim and Lerner 42 ) and Misra( Reference Misra 52 ) did not report the breakdowns of their 5-point frequency scales. Both authors were contacted by email but were unable to provide this information by the deadline given. Lim et al.( Reference Lim, Kim and Kim 57 ) was not included in this calculation because their usage was measured as a dichotomous yes/no question rather than usage frequency.
† Percentage breakdowns for each frequency category were not provided in the original manuscript. These numbers were provided through personal communication with the corresponding author.
Correlates of nutrition label use
Twelve of the thirteen studies that assessed gender differences in nutrition label use found being female was significantly associated with higher label use( Reference Conklin, Cranage and Lambert 43 – Reference Martinez, Roberto and Kim 50 , Reference Misra 52 – Reference Wie and Giebler 54 , Reference Smith, Taylor and Stephen 56 ). In the remaining study, Cha et al.( Reference Cha, Kim and Lerner 42 ) found that gender and food label use were not correlated; however, this study surveyed only 103 participants, 70 % of whom were female. One study had female participants only and thus was unable to test for gender differences in nutrition label use( Reference Lim, Kim and Kim 57 ), whereas the other two studies did not report the presence/absence of gender differences( Reference McLean-Meyinsse, Gager and Cole 51 , Reference Cooke and Papadaki 55 ).
Seven studies reported participants’ BMI or body weight status based on BMI (i.e. underweight, normal weight, overweight and obesity), five of which were self-reported( Reference Krukowski, Harvey-Berino and Kolodinsky 47 , Reference Li, Concepcion and Lee 48 , Reference Martinez, Roberto and Kim 50 , Reference Cooke and Papadaki 55 , Reference Lim, Kim and Kim 57 ) and two based on objectively measured height and weight( Reference Cha, Kim and Lerner 42 , Reference Graham and Laska 45 ). Martinez et al.( Reference Martinez, Roberto and Kim 50 ) found that overweight or obese college students were significantly more likely to use nutrition labels in making lower-calorie and healthier food choices in dining halls. In contrast, Li et al.( Reference Li, Concepcion and Lee 48 ) and Krukowski et al.( Reference Krukowski, Harvey-Berino and Kolodinsky 47 ) found no association between BMI and nutrition label use among college students and young adults. While Cooke and Papadaki( Reference Cooke and Papadaki 55 ) did not report on any relationship between BMI and nutrition label use directly, they documented that BMI was related to nutrition knowledge and attitudes towards healthy eating – two variables that were related to label use. Specifically, they found that normal-weight college students had higher nutrition knowledge than their underweight counterparts, whereas overweight college students had lower attitudes towards healthy eating than their underweight counterparts. Other studies found no difference in height or weight( Reference Lim, Kim and Kim 57 ) or average BMI( Reference Graham and Laska 45 ) between label users or non-users. Although Rasberry et al.( Reference Rasberry, Chaney and Housman 53 ) did not assess BMI, they found frequent label users were nearly three times more likely than non-users to select ‘weight control’ as a reason for using labels.
The findings on nutrition label use in relation to age and student classification (undergraduate students including freshmen, sophomores, juniors and seniors, and graduate students) remain mixed. Age was found to be positively associated with nutrient label use in two studies( Reference Cha, Kim and Lerner 42 , Reference Misra 52 ). In terms of student classification, one study found that juniors and seniors were more likely to use nutrition labels compared with freshmen and sophomores( Reference McLean-Meyinsse, Gager and Cole 51 ), whereas Jasti and Kovacs( Reference Jasti and Kovacs 46 ) found that graduate students were less likely to use nutrition labels than undergraduates, possibly due to the higher proportion of international students among the graduate student body. A third study by Misra( Reference Misra 52 ) found undergraduate and graduate students were equally likely to use labels; this result is somewhat surprising given the author also found age was positively related to a higher label reading behaviour score. Others found no significant changes in nutrition label use by age( Reference Graham and Laska 45 , Reference Marietta, Welshimer and Anderson 49 ) or student classification( Reference Li, Concepcion and Lee 48 ).
There is limited evidence on nutrition label use in relation to race/ethnicity or marital status. Two studies reported that white( Reference Graham and Laska 45 ) or non-Hispanic white students( Reference Jasti and Kovacs 46 ) were more likely to use nutrition labels than all other races/ethnicities, whereas another study reported no difference in nutrition label use by race/ethnicity( Reference Li, Concepcion and Lee 48 ). Only one study assessed marital status but did not find it to be associated with nutrition label use( Reference Li, Concepcion and Lee 48 ).
A few studies examined nutrition label use in relation to attitudes, beliefs and self-efficacy. Four studies( Reference Graham and Laska 45 , Reference Marietta, Welshimer and Anderson 49 , Reference Misra 52 , Reference Cooke and Papadaki 55 ) found that attitudes towards healthy eating or preparing healthy meals positively predicted nutrition label use. Smith et al.( Reference Smith, Taylor and Stephen 56 ) found that the only significant predictor of nutrition label use in both genders was the belief on the importance of nutrition labels in guiding food selection, although beliefs in the truthfulness of labels and diet–disease relationships also significantly predicted usage in men. Jasti and Kovacs( Reference Jasti and Kovacs 46 ) found that belief on the importance of eating a low-fat diet predicted label use, while Rasberry et al.( Reference Rasberry, Chaney and Housman 53 ) found that health reasons and looking for specific information related to usage. Increased self-efficacy was also documented to be positively associated with nutrition label use( Reference Cha, Kim and Lerner 42 , Reference Lim, Kim and Kim 57 ).
Several studies found that nutrition knowledge and education predicted nutrition label use. Driskell et al.( Reference Driskell, Schake and Detter 44 ) found that education on nutrition labels, but not nutrition knowledge, was related to higher usage. Others found that nutrition education( Reference Misra 52 ), nutrition knowledge( Reference Rasberry, Chaney and Housman 53 , Reference Cooke and Papadaki 55 ) and self-reported understanding of nutrition( Reference Conklin, Cranage and Lambert 43 ) were associated with greater usage. Rasberry et al.( Reference Rasberry, Chaney and Housman 53 ) documented nutrition label use to be related to improved knowledge linking diets to certain diseases. Wie and Giebler( Reference Wie and Giebler 54 ) reported college students majoring in nutrition were more likely to use nutrition labels compared with their counterparts with other majors.
A few studies assessed nutrition label use in relation to behaviours; Conklin et al.( Reference Conklin, Cranage and Lambert 43 ) reported that students obtaining information on food from weight-loss programmes were more likely to use labels. Performing healthy dietary behaviours( Reference Graham and Laska 45 ), increased grocery shopping( Reference Jasti and Kovacs 46 ), eating more meals at home and not eating fast food in the past week( Reference Krukowski, Harvey-Berino and Kolodinsky 47 ), and use of nutritional supplements( Reference Misra 52 ) were also positively related to label usage.
Study quality
Table 5 reports the overall study quality assessment results as well as the results for each of the sixteen studies included in the review. On average, studies scored 6·2 out of 8 points (range: 3–8), but the distribution of qualifications differed substantially across criteria. The large majority (94 %) of studies clearly documented the study design and data collection procedures; however, sample size was much more variable, ranging from 103 to 1317. Only nine of the sixteen studies (56 %) met the sample size quality criterion of 400 or more participants. Thirteen studies (81 %) documented the study response or completion rate and twelve (75 %) adopted a previously validated or pilot-tested measure on nutrition label use. Almost all studies (94 %) reported usage in relation to at least one demographic correlate and 81 % of studies reported usage in relation to at least one non-demographic correlate. Only half of the studies used regression analysis to examine the relationship between label usage and multiple predictor variables/correlates simultaneously. Finally, most of the studies (88 %) examined free-living college students and young adults in general (no population restrictions).
Table 5 Study quality assessment for each study included in the review and average quality across all studies
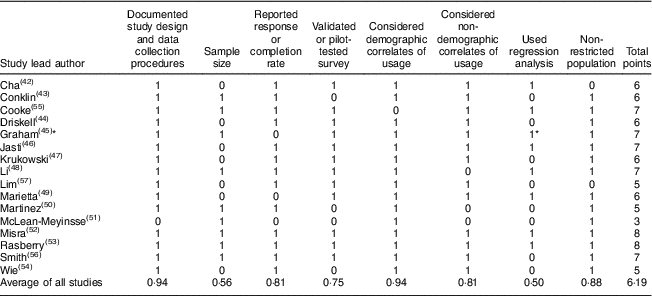
* Graham and Laska( Reference Graham and Laska 45 ) do use regression analysis where label usage is modelled as a function of attitude towards healthy eating, gender, age and race/ethnicity; however, only the regression coefficient for attitude is reported in the paper.
Discussion
The present study systematically reviewed existing evidence on the correlates of nutrition label use among college students and young adults 18–30 years of age. A total of sixteen studies based on college surveys in four countries (USA, UK, Canada and South Korea) were identified from keyword and reference search. Reported prevalence of nutrition label use varied substantially across studies; however, a weighted average across all studies revealed 36·5 % of college students and young adults reported using labels always or often (36·7 % said sometimes, 26·8 % said rarely or never). Twelve of the thirteen studies that assessed gender differences reported that females were more likely to use nutrition labels. Nutrition label use was also found to be associated with attitudes towards a healthy diet, belief on the importance of nutrition labels in guiding food selection, self-efficacy, and nutrition knowledge and education. In contrast, findings on nutrition label use in relation to age, student classification, race/ethnicity, marital status and body weight status were largely inconclusive.
Our results are consistent with studies that examined label use in the general population. Guthrie et al.( Reference Guthrie, Fox and Cleveland 58 ) and Campos et al.( Reference Campos, Doxey and Hammond 3 ) reported prevalence estimates of 71 % and 75 % in US populations (label usage is defined as using information at least sometimes), similar to our prevalence estimate of 73·8 % for young adults who use labels at least sometimes. Additionally, Cowburn and Stockley( Reference Cowburn and Stockley 6 ) and Campos et al.( Reference Campos, Doxey and Hammond 3 ) conducted reviews examining predictors/correlates of label use in the general population and found many of the same relationships we identified in the present review. Similarly to our results, women were more likely to use labels than men, as were individuals with high nutrition knowledge or nutrition education, positive attitudes towards diet and health, or who practised healthy eating habits and dietary behaviours. Both reviews also found that label use was related to general education level and income; however, due to our restricted population, we were unable to assess the relationship between these variables and label usage. Surprisingly, the reviews on the general population did not report the relationship between BMI or weight status and label usage, which was a common variable of interest for many of the studies included in our review.
It is important to note that in many of the studies reviewed (both in young adult and general adult populations) label use is typically based on self-reported data, which may not reflect actual use. Although a majority of US consumers report regular use of nutrition facts labels, in-store observations suggest actual use during food purchase can be lower( Reference Azman and Sahak 59 ). Moreover, whether consumers can understand and use nutrition facts label is contingent upon the purpose of the task( Reference Drichoutis, Lazaridis and Nayga 4 – Reference Grunert and Wills 7 ). Regular label users can understand some of the terms but may be confused by other types of information. A majority appears capable of retrieving basic facts and making simple calculations/comparisons between products using numerical information on the label, but their ability and accuracy decline as the complexity of the task increases.
Further, while it is critical to understand which types of individuals are more likely to use nutrition labels, the question remains whether label use actually leads to improved dietary behaviour. In their review of the general population, Campos et al.( Reference Campos, Doxey and Hammond 3 ) discussed several studies that found an association between nutrition label use and diet. Some studies found label users to have healthier diets overall while others found label users had lower intake levels of certain nutrients (e.g. fat, cholesterol) than non-users. In the present review, five studies examined the relationship between label use and dietary quality in college students and young adults( Reference Cha, Kim and Lerner 42 , Reference Graham and Laska 45 , Reference Jasti and Kovacs 46 , Reference Li, Concepcion and Lee 48 , Reference Cooke and Papadaki 55 ). Four of the five studies found that label use led to improved dietary quality( Reference Cha, Kim and Lerner 42 , Reference Graham and Laska 45 ), lower consumption of fried foods( Reference Jasti and Kovacs 46 ), decreased fat intake and increased fibre intake( Reference Li, Concepcion and Lee 48 ). Interestingly, Cooke and Papadaki( Reference Cooke and Papadaki 55 ) found that label use was negatively related to dietary quality when nutrition knowledge and attitudes were controlled for. Looking beyond standard nutrition labels on packaged foods, there were also several studies that had examined the link between calorie label use in restaurants and food choice. While this portion of the literature considered a different meal setting (eating away from home instead of eating at home), it had the advantage of examining the relationship between label use and food choice in more natural settings (actual restaurants). In contrast to the majority of studies included in Campos et al.’s( Reference Campos, Doxey and Hammond 3 ) review, these studies did not solely rely on self-reported data; label use may have been self-reported, but diet quality and food choice were often directly observed. Generally speaking, this body of research provided a less optimistic view on the ability of labels to impact dietary quality. Systematic reviews in adults suggested that simply posting calorie information may not impact calorie purchases or consumption( Reference Kiszko, Martinez and Abrams 8 , Reference Swartz, Braxton and Viera 60 ); thus, the link between label use and dietary behaviour remains unclear.
A few limitations are present in the existing literature on the prevalence and correlates of nutrition label use in college students and young adults. There remains no standardized instrument to assess nutrition label use, and often there is a lack of distinction between the nutrition facts labels on food packages and nutrition/calorie labels on food venue (e.g. fast-food outlet, full-service restaurant, cafeteria or dining hall) menus and between nutrition label formats (e.g. front-of-pack, traffic light label, front-of-pack + traffic light label)( Reference Marietta, Welshimer and Anderson 49 , Reference Martinez, Roberto and Kim 50 , Reference Smith, Taylor and Stephen 56 ). While many studies examined two or more of the correlates of nutrition label use, very few studies assessed a comprehensive list of psychosocial factors that enabled within-study comparison. Many potentially important correlates of nutrition label use among college students and young adults have not been assessed in any of the studies included in the review, such as health and/or risk behaviours (e.g. smoking,Footnote * drinking, drugs use), mental and/or physical health, and neighbourhood or campus food environment. In addition, only three of the included studies were published outside the USA, and even within the included thirteen US-based studies, geographic regions such as the Southwest, West and Northwest were under-represented. Lastly, our review only observed correlates of reported use; whether and how usage relates to dietary intake must be further assessed, particularly comparing the effect of different labelling schemes, comparing and combining label interventions with other nutrition interventions, and surveying large samples over time.
Conclusion
The present study reviewed correlates of nutrition label use among college students and young adults. Reported prevalence of nutrition label use varied substantially across studies, but a weighted average reveals that 36·5 % of college students and young adults said they use nutrition labels always or often. Female gender, attitudes towards healthy diet, beliefs on the importance of nutrition labels in guiding food selection, self-efficacy, and nutrition knowledge and education were found to predict nutrition label use. While providing nutrition information at the point of purchase may nudge consumers towards a healthier diet( Reference Cioffi, Levitsky and Pacanowski 61 ), findings from the present review indicate the potential heterogeneity in the impact of nutrition labelling across population subgroups. Nutrition awareness campaigns and education programmes may be important mechanisms to promote nutrition label use among college students and young adults; however, they should be rigorously evaluated to determine whether label use leads to improvements in diet quality.
Acknowledgements
Financial support: This research received no specific grant from any funding agency in the public, commercial or not-for-profit sectors. Conflict of interest: none. Authorship: M.J.C. formulated the research question, performed the analysis and wrote the first draft; R.A. and B.E. oversaw the analysis and edited all drafts. Ethics of human subject participation: Not applicable.


