Energy intake in excess of energy expenditure and higher intakes of added sugars, SFA and Na contribute to unhealthy weight gain and/or chronic non-communicable diseases, including CHD and type 2 diabetes( Reference Keast, Fulgoni and Nicklas 1 – Reference Previdelli, de Andrade and Fisberg 3 ). Adolescence is an important period to understand dietary intake, because it is a period of transition from childhood to adulthood when teens become more independent in their food choices(4). Given the overabundance of foods and beverages available, targeting reductions in the amounts and percentage contribution of the most commonly consumed foods with these nutrients among adolescents may be an effective strategy to more closely align their diets with current dietary recommendations( 5 ). This approach may have the positive effect of increasing intakes of foods and beverages that contain the food groups to encourage and of decreasing nutrients to limit in the diets of adolescents( 5 – Reference Vedovato, Trude and Kharmats 9 ).
Cross-sectional data from six nationally representative surveys of food intake (1989 to 2010) with US children and adolescents revealed that total energy intake increased considerably from 1989 to 2004, and subsequently declined through 2010( Reference Slining, Mathias and Popkin 10 ). Seven food sources were consistently major contributors to total energy intake across all time points: sugar-sweetened beverages (SSB), pizza, higher-fat milk, grain-based desserts, breads, pasta dishes and savoury snacks. Intakes of higher-fat milk, meats and processed meat products, ready-to-eat cereals, hamburgers, fried potatoes, 100 % juice and vegetables decreased from 1989 to 2010, while intakes of low-fat milk, poultry, sweet snacks, candies, and tortillas and corn-based dishes increased over this period( Reference Slining, Mathias and Popkin 10 ). Although there may have been a decrease in total energy intake, adolescents were still consuming foods high in energy, which might affect overall diet quality( Reference Rodriguez, Madsen and Cotterman 11 – Reference Slining and Popkin 13 ). Food sources of energy, added sugars and SFA make major contributions to intakes of nutrients of public health concern (i.e. dietary fibre, vitamin D, Ca and K) as well as other essential nutrients( Reference Rodriguez, Madsen and Cotterman 11 – Reference Huth, Fulgoni and Keast 14 ).
SFA and Na are considered overconsumed nutrients that may pose a public health concern due to cardiovascular and metabolic diseases( 5 ). In addition, the 2015 Dietary Guidelines for Americans recommend limiting intakes of energy from solid fat (i.e. SFA and trans-fatty acids) and added sugars( 15 ). Linear trends in intakes of solid fats and added sugars decreased in adolescents aged 2–18 years from 1994 to 2010, but the mean intakes continue to exceed recommended limits( Reference Slining and Popkin 13 ). The top food sources of SFA were: cheese; milk; frankfurters, sausages, luncheon meats; beef; other fats and oils (e.g. butter and animal fats, margarine, cream cheese); milk desserts; cake, cookies, quick breads, pastry pies; and crackers, popcorn, pretzels, chips( Reference Keast, Fulgoni and Nicklas 1 ). The US population is consuming Na in excess of dietary guideline levels and snacking behaviours are contributing to the excessive intake over the 30 years, especially among adolescents. Salty snacks and desserts and sweets (i.e. grain-based desserts) were the top food sources of Na( Reference Dunford, Poti and Popkin 16 ). Average daily Na intake was highest among older (14–18 years old) school-aged children (3565 (se 120) mg) and lowest among females (2919 (se 74) mg) compared with younger (6–10 years old) children (3051 (se 61) mg) and males (3584 (se 102) mg), all exceeding recommended amounts( Reference Quader, Gillespie and Sliwa 12 ).
Understanding current food sources of energy intake and nutrients to limit among adolescents in the USA is important for designing age-specific strategies to help meet current dietary recommendations( 5 ). Although detailed lists of food sources of energy and nutrients among US children (2–18 years) and adults (≥19 years) from the National Health and Nutrition Examination Survey (NHANES) 2003–2006 have been published( Reference Keast, Fulgoni and Nicklas 1 , Reference O’Neil, Keast and Fulgoni 17 ), no study using recent NHANES data has examined the top food sources consumed by adolescents aged 10–19 years. The present study identifies the most commonly consumed food sources by adolescents (10–19 years) in terms of their contribution to energy, nutrients to limit and the total gram amount of foods consumed using nationally representative data from NHANES 2011–2014.
Methods
NHANES overview
The NHANES is a cross-sectional survey that uses a multistage stratified area probability sample of non-institutionalized individuals, that provides nationally representative estimates of the US population( 18 ). An overview of NHANES( 18 ) including the purpose, plan and operations, sample design, weighting procedures, analytic guidelines( Reference Zipf, Chiappa and Porter 19 ) and response rates and population totals( 20 ) is available elsewhere. In addition, a recent review article has been published describing NHANES in more detail, including analytical considerations and uses to inform public policy( Reference Ahluwalia, Dwyer and Terry 21 ). The survey examines approximately 5000 persons each year and data are released in 2-year cycles. Data were collected via a mobile examination centre throughout the year on both weekends and weekdays( 22 ).
Study sample
The WHO defines adolescents as those people between 10 and 19 years of age( Reference Anon 23 ). Therefore, data from adolescents aged 10–19 years participating in the NHANES 2011–2012 and 2013–2014 were combined to increase sample size, resulting in a final analytic sample of 3156 after excluding those with unreliable records as defined by US Department of Agriculture (USDA) staff. The unweighted response rates for the adolescents aged 10–19 years for NHANES 2011–2012 and 2013–2014 were 75·8 and 78·5 %, respectively( 24 , 25 ). Demographic information( 26 ) and self-reported physical activity levels( 27 ) were determined from the NHANES survey. Physical activity was classified into three levels: sedentary, moderate and vigorous, according to the individuals’ intensity level in a typical week( 27 ). The NHANES employs protocols and procedures that ensure confidentiality and protect individual participants from identification( 26 , 27 ).
Determination of dietary intake data
Dietary intake data were obtained from the in-person 24 h dietary recall interview using an automated multiple-pass method( Reference Blanton, Moshfegh and Baer 28 ). The source of food composition data was based on the 2011–2012 and 2013–2014 Food Patterns Equivalents Databases, which convert the foods and beverages in the Food and Nutrient Database for Dietary Studies to USDA Food Patterns components( 29 ). Added sugars were defined by the USDA as all sugars used as ingredients in processed and prepared foods such as breads, cakes, soft drinks, jams, chocolates and ice cream, or eaten separately or added to foods at the table (MyPlate). Added sugars were determined using the NHANES cycle appropriate MyPyramid Equivalents Databases for USDA Survey Food Codes from 2001 to 2008 (versions 1.0 and 2.0) until these were replaced by the Food Patterns Equivalents Database in 2005 for each NHANES release (Food Patterns). Trained interviewers collected the recall data in English or Spanish, as appropriate. Participants aged 12 years or older completed the dietary interview on their own, but proxy-assisted interviews were conducted with participants aged 10 and 11 years. Detailed description of the dietary interview methods is provided in the NHANES Dietary Interview Procedure Manual( 30 ). A single 24 h dietary recall administered in a sufficiently large population sample can adequately provide data to estimate population mean intakes( Reference Naska, Lagiou and Lagiou 31 ).
Food groupings
The What We Eat In America (WWEIA) food category classification system( 32 ) was used to classify all foods consumed (obtained from the individual food file and combination foods were evaluated at the item level of each food in the combination). From fifteen main groups of the 2011–2012 and 2013–2014 WWEIA food categorization system( 32 ), only twelve were included in the present study: Milk and Dairy; Protein Foods; Mixed Dishes; Grains; Snacks and Sweets; Fruits; Vegetables; Beverages, Non-alcoholic; Fats and Oils; Condiments and Sauces; Sugars; and Water. The other food groups were excluded because they were not commonly consumed in this target population (e.g. Infant Formula and Baby Food; Other (e.g. protein and nutritional powders); Alcoholic Beverages). From these twelve main groups, forty-one food subgroups (e.g. quick breads and bread products, ready-to-eat cereals, flavoured milk, yoghurt, cheese) were included to determine the rank order of contributors to total energy, Na, SFA, added sugars and total gram amount of foods/beverages consumed( 32 ). The food categories in the online supplementary material, Supplemental Table 1, describe the assignment of the 137 specific WWEIA food categories to major food groups (n 12) and subgroups (n 41)( 5 ).
Anthropometric measures
Height and weight were measured using procedures outlined in the NHANES Anthropometry Procedures Manual( 33 ). BMI was calculated as body weight (in kilograms) divided by the square of height (in metres)( 34 ). The Centers for Disease Control and Prevention’s growth chart programs were used to determine BMI-for-age percentiles; children with BMI ≥ 85th and <95th percentile and BMI ≥ 95th percentile were considered overweight or obese, respectively( 35 ).
Statistical analysis
Analyses were conducted using the statistical software packages SAS version 9.2 and SUDAAN version 11. Appropriate weights were used to adjust for oversampling of certain groups, non-response by some sample persons and the complex sample design of NHANES to obtain nationally representative estimates. Descriptive statistics (means and percentages, with their standard errors) for food sources on a population level using SAS PROC RATIO were determined for energy, Na, SFA, added sugars and total gram amount consumed reported on the day of the 24 h dietary recall. Mean per capita energy, total grams, Na, SFA and added sugars consumed from each food group were expressed as a percentage of the total to allow relativity across sex and age groups.
Results
Demographics and lifestyle characteristics
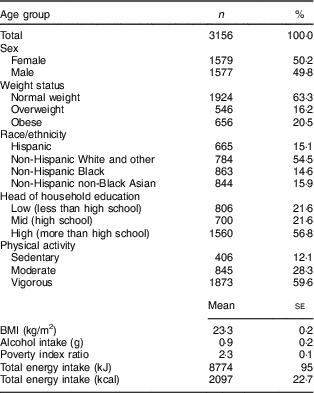
The sample from NHANES 2011–2014 included 3156 respondents aged 10–19 years with 53 % of the adolescents aged 10–14 years, who were equally represented by sex. Mean BMI was 23·3 (se 0·2) kg/m2, with 63·3 (se 1·6) % normal weight, 16·2 (se 0·9) % overweight and 20·5 (se 1·4) % obese. Most adolescents reported being non-Hispanic White (54·5 (se 3·3) %) and head of household education status being more than high school (56·8 (se 2·4) %). Most adolescents reported vigorous physical activity status (59·6 (se 1·51) %) followed by moderate (28·3 (se 1·4) %). On the day of the 24 h dietary recall, the mean energy intake was 8774 (se 95) kJ (2097 (se 22·7) kcal; Table 1).
Table 1 Demographic and lifestyle characteristics of US adolescents aged 10–19 years (n 3156), National Health and Nutrition Examination Survey 2011–2014
Contribution of foods to total energy intake
Table 2 shows the dietary sources of energy consumed from the WWEIA’s food subgroups. The more specific food categories are presented in the online supplementary material, Supplemental Table 2. The ten highest ranked subgroups contributed 55·1 % of total energy intake, including: 7·8 % from SSB (4·4 % from soft drinks); 6·9 % from sweetened bakery products (2·8 % from cookies and brownies); 6·6 % from mixed dishes – pizza; 5·8 % from bread, rolls and tortillas (3·0 % from yeast bread); 5·3 % from mixed dishes – grain-based (2·3 % from pasta mixed dishes, excludes macaroni and cheese); 5·1 % from mixed dishes – Mexican (3·2 % from burritos and tacos); 4·6 % from savoury snacks (2·0 % from tortilla, corn, other chips); 4·6 % from mixed dishes – sandwiches (1·2 % from hamburgers and 1·1% from chicken/turkey sandwiches); 4·4 % from milk (2·4 % from milk, reduced fat); and 4·0 % from poultry (2·2 % from chicken, whole pieces).
Table 2 Food sourcesFootnote * of mean and percentage of energy (kcal)† intake among US adolescents aged 10–19 years (n 3156), National Health and Nutrition Examination Survey 2011–2014
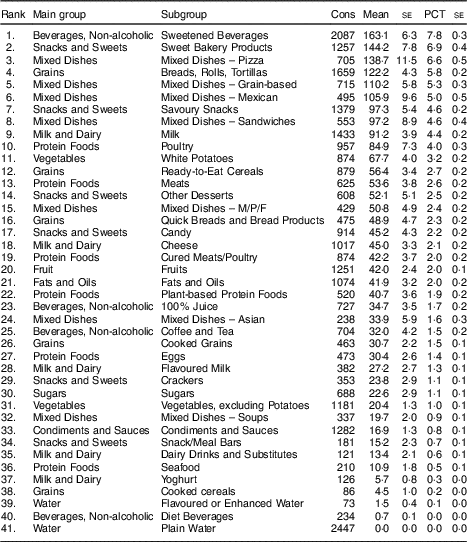
Cons, number of consumers; PCT, percentage contribution; M/P/F, meat/poultry/fish.
* All forty-one weighted subgroups of foods’ contribution to daily intake of energy.
† To convert to kJ, multiply kcal values by 4·184.
Contribution of foods to total grams consumed
All the top beverage sources (n 9) contributed 67·2 % of total grams consumed. Plain water contributed 33·1 % with tap water the most consumed category (19·5 %). The other three highest ranked beverage subgroups (and categories) were: 15·8 % from SSB (8·6 % from soft drinks); 7·2 % from milk (3·9 % from milk, reduced-fat); and 4·9 % from coffee and tea (3·8 % from tea). Further, all the top food sources (n 32) contributed 31·5 % of total grams consumed and the five highest ranked food subgroups (and categories) were: 2·9 % from fruits (0·8 % from apples); 2·7 % from mixed dishes – grain-based (1·4 % from pasta mixed dishes, excludes macaroni and cheese); 1·9 % from mixed dishes – pizza; 1·7 % from mixed dishes – Mexican (1·2 % from burritos and tacos); and 1·7 % from vegetables, excluding potatoes (0·3 % from other vegetables and combinations). Results are presented in Table 3 and the online supplementary material, Supplemental Table 3.
Table 3 Food sourcesFootnote * of mean and percentage of grams among US adolescents aged 10–19 years (n 3156), National Health and Nutrition Examination Survey 2011–2014
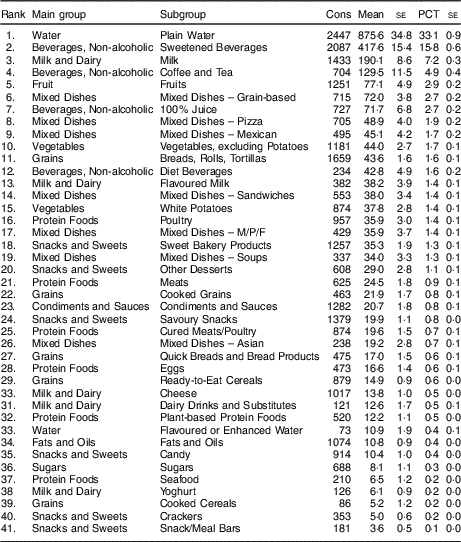
Cons, number of consumers; PCT, percentage contribution; M/P/F, meat/poultry/fish.
* All forty-one weighted subgroups of foods’ contribution to daily total gram intake.
Contribution of foods to total sodium consumed
Table 4 and the online supplementary material, Supplemental Table 4, present food subgroups (and categories) contributing to total Na consumed. The top ten sources contributed 58·0 % of the total and included: 8·7 % from mixed dishes – pizza; 6·7 % from mixed dishes – Mexican (4·6 % from burritos and tacos); 6·6 % from cured meats/poultry (4·7 % from cold cuts and cured meats); 6·5 % from mixed dishes – sandwiches (1·7 % from chicken/turkey sandwiches); 6·3 % from breads, rolls and tortillas (3·3 % from yeast breads); 6·1 % from mixed dishes – grain-based (3·1 % from pasta mixed dishes, excludes macaroni and cheese); 5·5 % from poultry (3·0 % from chicken, whole pieces); 4·1% from condiments and sauces; 3·9 % from mixed dishes – meat/poultry/fish (2·6 % from meat mixed dishes); and 3·6 % from cheese.
Table 4 Food sourcesFootnote * of sodium (mg), mean contribution and as a percentage of total sodium intake, among US adolescents aged 10–19 years (n 3156), National Health and Nutrition Examination Survey 2011–2014
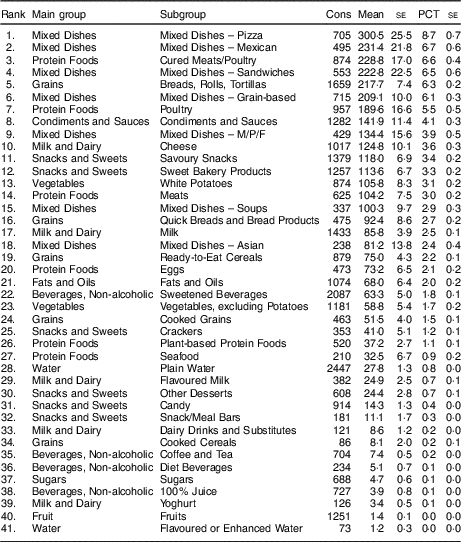
Cons, number of consumers; PCT, percentage contribution; M/P/F, meat/poultry/fish.
* All forty-one weighted subgroups of foods’ contribution of daily intake of Na.
Contribution of foods to total SFA consumed
The food subgroups (and categories) that contributed to total SFA are presented in Table 5 and the online supplementary material, Supplemental Table 5. The ten highest food sources contributed 64·4 % of total SFA consumed and included: 9·1 % from mixed dishes – pizza; 8·3 % from sweet bakery products (3·4 % from cookies and brownies); 7·9 % from mixed dishes – Mexican (5·2 % from burritos and tacos); 7·6 % from milk (4·8 % from milk, reduced fat); 6·9 % from cheese; 6·3 % from mixed dishes – sandwiches (2·0 % from burgers); 5·4 % from mixed dishes – grain-based (2·9 % from macaroni and cheese); 4·8 % from other desserts (4·6 % from ice cream and frozen dairy desserts); 4·2 % from fats and oils; and 3·9 % from meats (2·0 % from ground beef).
Table 5 Food sourcesFootnote * of SFA (g), mean contribution and as a percentage of total SFA intake, among US adolescents aged 10–19 years (n 3156), National Health and Nutrition Examination Survey 2011–2014
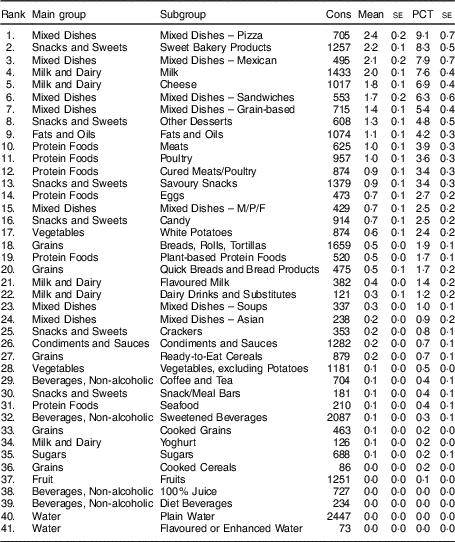
Cons, number of consumers; PCT, percentage contribution; M/P/F, meat/poultry/fish.
* All forty-one weighted subgroups of foods’ contribution of daily intake of SFA.
Contribution of foods to total added sugars consumed
The added sugar food subgroups (and categories) are presented in Table 6 and the online supplementary material, Supplemental Table 6. The top ten subgroups contributed 89·1 % of total added sugar intake. The top food sources were: 42·1 % from SSB (25·6 % from soft drinks); 12·1 % from sweet bakery products (5·0 % from cookies and brownies); 7·6 % from coffee and tea (6·9 % from tea); 6·1 % from candy (3·5 % from candy not containing chocolate); 5·5 % from other desserts (4·3 % from ice cream and frozen dairy desserts); 4·9% from sugars; 4·9 % from ready-to-eat cereals (4·3 % from ready-to-eat cereal, higher in sugar); 2·1 % from flavoured milk (0·6 % from flavoured milk, reduced fat); 1·9 % from breads, rolls and tortillas (1·0 % from yeast breads); and 1·8 % from quick breads (1·1 % from biscuits, muffins, quick breads).
Table 6 Food sourcesFootnote * of added sugar (teaspoons), mean contribution and as a percentage of total added sugar intake, among US adolescents aged 10–19 years (n 3156), National Health and Nutrition Examination Survey 2011–2014
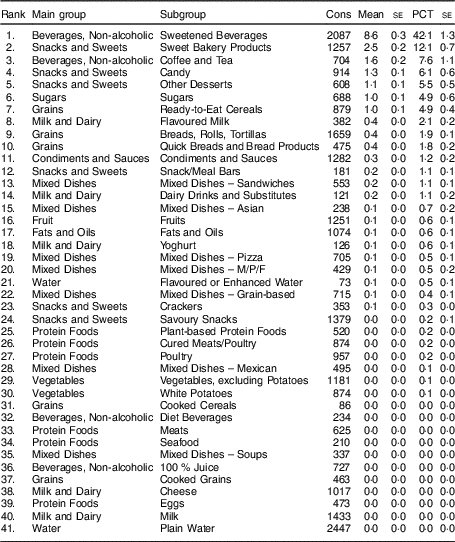
Cons, number of consumers; PCT, percentage contribution; M/P/F, meat/poultry/fish.
* All forty-one weighted subgroups of foods’ contribution of daily intake of added sugar.
Discussion
Identification of food sources for intakes of energy, total grams consumed and nutrients to limit may guide public health efforts to align adolescents’ diets more closely with current dietary recommendations. The present study provides the food sources of energy, nutrients to limit and total amount of grams consumed by a nationally representative sample of US adolescents; to our knowledge, this is the first time that data for this age group have been reported. While some food categories contributed a high percentage of total energy and total amount of grams consumed, such as milk and water, less desirable food sources, including SSB and sweetened bakery products, were also identified.
The present findings add to the literature that identifies intakes of SSB and sweetened bakery products as being major contributors of added sugars and SFA. However, the question that has not been addressed in the research field is whether there is an independent role of nutrients to limit and food sources, or if nutrients to limit and food sources simply add excessive energy to the diet leading to adverse health effects( Reference Bailey, Fulgoni and Cowan 36 ). For example, 100 % fruit juice contributes positively to nutrient intakes, but should be consumed in adequate portion sizes in order not to overconsume excess energy. On the other hand, flavoured teas and coffees contribute to higher amount of added sugars. A previous study( Reference Bailey, Fulgoni and Cowan 36 ) suggests that the role of SSB is probably larger than has been reported because the SSB category did not include sugar-sweetened tea and coffee.
Corroborating with a representative study using 2009–2012 data from NHANES( Reference Bailey, Fulgoni and Cowan 36 ) showed that the major food source of added sugars was sweet bakery products (i.e. cookies and brownies). The total intake of added sugars was 12 % in the adolescent population. Moreover, sweetened bakery products contributed to the intake of SFA in the diet of the US population( Reference Papanikolaou and Fulgoni 37 ). Therefore, practitioners, researchers and policy makers should continuously be working together to reduce intakes of added sugars and SFA from the food sources commonly consumed by adolescents, in accordance with the recommendations of the Dietary Guidelines for Americans( 5 ).
In the current study, adolescents reported consuming an average of 8774 kJ (2097 kcal)( 5 ), which is within current estimated daily energy needs( 38 ). However, approximately 37 and 20 % of adolescents were overweight or obese, respectively( Reference Skinner, Perrin and Skelton 39 ). By inference, many must be consuming more energy than they require. Moreover, studies have repeatedly shown under-reporting of energy intake based on self-reported data, specifically among overweight and obese individuals( Reference Rangan, Allman-Farinelli and Donohoe 40 – Reference Scagliusi, Ferriolli and Pfrimer 42 ).
Although previous studies with NHANES data did not evaluate adolescents specifically, consistent findings were found for children aged 6–18 years( Reference Quader, Gillespie and Sliwa 12 ) and ≥2 years( Reference Huth, Fulgoni and Keast 14 , Reference Bailey, Fulgoni and Cowan 36 , Reference Welsh, Sharma and Grellinger 43 ) in that the highest-ranking food sources of Na were pizza, mixed dishes – Mexican, mixed dishes – sandwiches, cheese, milk and poultry. For SFA, major food sources were beef, milk and cheese; and for added sugars major food sources were desserts, snacks, and SSB. Meeting nutrient intake recommendations while staying within energy needs has proven to be challenging for many adolescents( Reference Quader, Gillespie and Sliwa 12 , Reference Huth, Fulgoni and Keast 14 , Reference O’Neil, Keast and Fulgoni 17 ), potentially contributing to the high prevalence of overweight and obesity( Reference Skinner, Perrin and Skelton 39 ), premature risk for CVD and type 2 diabetes( Reference O’Connor, Evans and Burda 44 ) and a high likelihood of remaining with these adverse health conditions into adult life( Reference Celermajer and Ayer 45 ). Average Na intake among US adolescents is much higher than in younger children and adults( 32 ). Corroborating with a previous NHANES analysis( Reference Quader, Gillespie and Sliwa 12 ) the top food sources of Na were mixed dishes (i.e. pizza and Mexican), cured meats, bread rolls and tortilla, and savoury snacks, but with variation in the ranking of the top food sources’ contributions by different social demographic characteristics. A previous study( Reference Rehm and Drewnowski 46 ) of consumption trends showed that individuals aged 4–19 years significantly reduced their consumption of solid fats, added sugars and Na in the last decade because grocery stores, fast-food restaurants and full-service restaurants have been making an effort to reduce those nutrients to limit. To help US adolescents improve dietary habits and reduce intakes of Na, SFA and added sugars with better food choices, identifying food sources contributing to energy, nutrients to limit and total gram amount consumed is essential and needs continued monitoring.
Strengths of the present study are the use of a large, nationally representative database to examine food sources of selected nutrients. The limitations include self-reported measurements that may over- or under-report dietary intake and physical activity( Reference Naska, Lagiou and Lagiou 31 ). Results need to be interpreted with caution because adolescents might be over-reporting their intakes of healthier foods and under-reporting their intakes of food sources of nutrients to limit in the diet, particularly when using a one 24 h dietary recall( Reference Collins, Watson and Burrows 47 ). Further, under-reporting is greater in those who are overweight or obese compared with those in the healthy weight range( Reference Scagliusi, Ferriolli and Pfrimer 42 , Reference Rangan, Flood and Gill 48 ) and findings might need to be interpreted with caution. To reduce the impact of misreporting, data were expressed as percentage contributions of food sources to energy, grams and nutrients to limit( Reference Collins, Dewar and Schumacher 49 ). A single day’s intake may not be representative of an individual’s usual intake but given large sample sizes does adequately represent mean intakes. Also, the identification of food sources of nutrient intakes is a limitation because this depends on a food grouping system that may not be universally used. For example, other evidence using the NOVA classification system( Reference Collins, Dewar and Schumacher 49 ) and the Food Pyramid Groups( Reference Lipsky, Nansel and Haynie 50 ) have identified some foods that were in the top intake sources of adolescents, while in the present analysis those food sources were not among the top major contributors. Finally, the study used cross-sectional data from which casual relationships cannot be drawn.
Conclusion
Given adolescence is an important period of transition from childhood to adulthood with increased freedom of food choices, understanding dietary intake during this period is important( Reference Lipsky, Nansel and Haynie 50 ). The present study provides detailed information on the food sources contributing to total energy, total grams, Na, SFA and added sugars consumed by a representative sample of US adolescents aged 10–19 years. A large proportion of total energy consumed was from energy-dense food groups (e.g. SSB and sweet bakery products), but also from some major food sources contributing important vitamins and minerals (e.g. beef, cheese and milk)( Reference Huth, Fulgoni and Keast 14 ). Awareness of food sources may be useful to create or refine dietary strategies within public health initiatives to improve the diets of adolescents.
Acknowledgements
Financial support: This research received no specific grant from any funding agency in the public, commercial or not-for-profit sectors. This work is a publication of the USDA/ARS Children’s Nutrition Research Center, Department of Pediatrics, Baylor College of Medicine, Houston, TX, USA. The contents of this publication do not necessarily reflect reviews or policies of the USDA, nor does mention of trade names, commercial products or organizations imply endorsement from the USDA. Conflict of interest: As Vice President of Nutrition Impact, LLC, V.F. performs data analyses of large government databases like NHANES for numerous members of the food, beverage and dietary supplement industry. T.N. has received numerous grants from the food and beverage industry and federal agencies throughout her career. Authorship: All authors contributed to the development of this study. A.C.L. contributed to interpretation of data, drafting the manuscript and critical revision of the manuscript for scientific content. T.B. contributed to critical revision of the manuscript for scientific content. D.T. contributed to critical revision of the manuscript for scientific content. S.T. contributed to critical revision of the manuscript for scientific content. C.O’.N. contributed to critical revision of the manuscript for scientific content. V.F contributed to statistical analysis and critical revision of the manuscript for scientific content. T.N., the senior researcher of this project, participated in study concept and design, acquisition of data, interpretation of data and critical revision of the manuscript for important scientific content. Ethics of human subject participation: As it was a secondary analysis which lacked personal identifiers, this study did not require institutional review beyond the approval from the Centers for Disease Control and Prevention, National Center for Health Statistics Research Ethics Review Board (https://www.cdc.gov/nchs/nhanes/irba98.htm, accessed 6 April 2018).
Supplementary material
To view supplementary material for this article, please visit https://doi.org/10.1017/S1368980018002884


