INTRODUCTION
In view of the threat of a future pandemic outbreak of a highly pathogenic influenza strain with possibly devastating numbers of deaths, health authorities all over the world are designing plans to prepare adequate responses to such an outbreak. Possible intervention strategies range from treatment with antiviral drugs, contact tracing and isolation, increasing social distances by closing schools and other public meeting places, to vaccination with possibly badly matched vaccines. The expected effects of those strategies or their combinations have to be assessed and responses have to be designed depending on the specific aim of the intervention. Specific aims can be protecting certain age groups from infection and death, spreading the epidemic peak in time, or keeping the health-care demand manageable. The use of mathematical and simulation models has become an accepted means to test and evaluate the effectiveness of different interventions under specific and varying conditions [Reference Halloran1–Reference Bansal, Pourbohloul and Meyers6].
A central element of dynamic transmission models is the way contacts between individuals that can lead to transmission of the pathogen are described in the model. For example, when the population is stratified by age, one has to specify the numbers of contacts that individuals of different age groups have with each other in a given time unit. For pathogens that are spread via infectious droplets or aerosols contacts that can lead to transmission between individuals could be two-way conversations or coughing at each other. Unfortunately, currently there is a notorious lack of empirical data about the frequencies of such contacts between and among age groups [Reference Wallinga, Edmunds and Kretzschmar7]. A pioneering study was conducted by Edmunds et al. [Reference Edmunds, O'Callaghan and Nokes8], and more recent studies have been done by Edmunds et al. [Reference Edmunds9], Wallinga et al. [Reference Wallinga, Teunis and Kretzschmar10], and Beutels et al. [Reference Beutels11]. The study population in Edmunds et al. [Reference Edmunds, O'Callaghan and Nokes8, Reference Edmunds9] was a convenience sample of university co-workers. In Wallinga et al. [Reference Wallinga, Teunis and Kretzschmar10] the study used data collected much earlier in two cities in The Netherlands, where representative population samples were asked about their contacts. The study of Beutels et al. [Reference Beutels11] was an online survey with the aim of comparing different survey methods in their results.
Although there might be various modes of transmitting a respiratory infection [Reference Tellier12] and different pathogens might differ in their transmissibility, it was shown by Wallinga et al. [Reference Wallinga, Teunis and Kretzschmar10] that social contacts can be considered a valid proxy for measuring contact distributions relevant for transmission of respiratory infections. Social contact data provided a sound empirical basis explaining serological data for different airborne infections such as mumps and influenza in different populations. This does not imply that the measured social contact data are equivalent with the direct transmission route for airborne infections, only that they can be used as a proxy for describing quantitatively the unobservable distributions of actual infectious contacts.
In analyses of the effectiveness of intervention strategies for pandemic influenza it has consistently been hypothesized that children play a central role in the transmission dynamics, because of frequent contacts within their own age group and by connecting all age groups through their widespread age range of contacts [Reference Germann5, Reference Hill and Longini13]. Moreover, it has been found that children are the first population group to be diagnosed with influenza in a syndromic surveillance system and cases in children are predictive for population mortality with some time delay [Reference Brownstein, Kleinman and Mandl14]. Therefore, interventions aimed at children and youths should be very effective. Such interventions are the closing of schools and keeping children at home or targeted vaccination of children where a vaccine is available. In the United States, the Advisory Committee for Immunization Practices (ACIP) has recently extended its vaccination recommendation to include all children aged 2–5 years in the annual influenza vaccination programme [Reference Smith15]. Following that recommendation, it was proposed to investigate the effect on herd immunity of the vaccination of children by conducting a large-scale community-based vaccination trial [Reference Halloran and Longini16, Reference Longini and Halloran17].
Model estimates of the effectiveness of strategies aimed at children rest crucially on the model assumptions about contact rates and types of contacts among children and between children and adults. As data about the frequencies of those contacts have been scarce, modellers have been forced to make assumptions about those parameters, or try to estimate them indirectly from estimates for the force of infection of childhood diseases [Reference Hethcote18–Reference Kanaan and Farrington21]. The data presented here are a first step towards providing empirical data about close contacts of children with all age groups of the population. In a survey conducted in an elementary school in Germany, all children were asked to complete a questionnaire about their contacts at school and outside school. Here we present an analysis of the survey results and discuss their implications for targeted interventions against respiratory-spread pathogens.
METHODS
Sample and study design
The study was conducted in a primary school in Solingen, Germany in June/July 2004. The selection of this school from 24 schools in the town was based on convenience considerations; within the school all classes were surveyed. Primary schools in North-Rhine Westphalia consist of grades 1–4 (age 6–10 years), the selected school with 310 pupils was one of the bigger primary schools in Solingen. There were three classes of each grade and the separate groups were randomly selected to report their contacts on different days of the week, so that in each grade one of the groups provided contacts for Sundays and two other groups for working days. Of the 310 children, 296 were at school on the days when the study was performed; of the 296 distributed questionnaires 262 children returned the questionnaires on the assigned day or later. Twenty-seven of the returned questionnaires were incomplete and were therefore excluded from the former analysis resulting in final sample size of 235 children with a 79·4% response rate. Participation was voluntary, permission for conducting the study was obtained from the headmaster, and parental consent was obtained by a letter accompanying the distributed questionnaire.
Questionnaire
The questionnaire was developed in form of a diary to record all contacts during one day. A contact was defined as a person with whom the child spoke or played with. The operationalization of the social contact as conversational was based on the earlier study by Edmunds et al. [Reference Edmunds, O'Callaghan and Nokes8]. The diary followed the course of the day by activities, starting with activities in the morning after awaking, on the way to school, playing during breaks, attending after-school daycare and other activities after school until going to bed. Children were asked to report all contacts apart from those with classmates and their teacher. Information about the numbers of classmates and teachers on the given day was obtained from school records and added to contacts reported by the children. At the end of the questionnaire the children were asked to list all contacts reported during the day and give some additional information regarding the age of contact persons. This could either be the exact age, or one of five age groups as follows (exact ages were categorized according to the age intervals in parentheses): age group 1 (preschool children: 0–5 years); age group 2 (peers: 6–10 years); age group 3 (adolescents: 11–20 years); age group 4 (younger adults, parents' age: 21–50 years); age group 5 (older adults, grandparents' age: >50 years). In the following we will refer to these age groups when we consider ages of contact persons. The respondents' ages will be categorized into grades 1–4 if necessary.
The children were also asked how often they met these contact persons. We defined two groups according to frequency of meeting contact persons: rare, which included for the first time, less than once per month and a couple of times per month and frequent contacts, which included often, several times per week and almost every day. A second version of the questionnaire was developed for Sunday and followed the course of the day by 2-h units. In the following we use the terms private contacts to describe contacts directly reported by the children and contacts at school to describe contact numbers obtained from school records of class sizes. The questionnaire also collected information on household size and composition including the ages of all persons living in the household.
The questionnaire was retrospective, i.e. children were asked to report contacts of the previous day (this is the reason why Saturdays were excluded). The questionnaire was pilot tested prior to the study with youngest children (6 years) during class. After the self-administered version proved too difficult for some of the children, the decision was made to distribute the questionnaire as a voluntary homework so that it could be completed with the help of the parents. Before the questionnaires were distributed the importance of contacts for the transmission of infectious diseases and what types of contacts are relevant for droplet infections was explained extensively to the children. In a separate questionnaire parents were asked about illnesses of their children in the last 6 months.
Statistical analysis
We present the data on the number of contacts using boxplots and histograms, which were made using the software program R. Association between the number of contacts and selected characteristics was analysed using negative binomial regression as implemented in the SAS procedure proc genmod. Obtained estimates were transformed by an exponential function, so they can be interpreted as equivalents of relative risk. Logistic regression was used to investigate the association between being ill in the past 6 months and the number of private contacts on the day of data collection on one side and the number of family members on the other side. For the presentation of proportions of contacts with different recurrence (every day, often, several times per month, less than once per month or first time) and contacts with persons from different age groups the number of contacts was aggregated within grades. This way of presentation does not take individual variation into account.
Contact rates and effects of intervention
We used a formula derived by Anderson & May [Reference Anderson and May22] to compute the effective contact rate from the data. The effective contact rate C describes the contact rate in a heterogeneous population that is effective for transmission of infection and determines the expected number of secondary infections that a typical infected index case will produce in a susceptible population. C can be computed from the mean m and the variance v of the number of contacts in a population subgroup by
To compare the effects of vaccination and school closure in the study population we assumed that a vaccine with n% efficacy would reduce the number of contacts of a respondent by n%. We assumed that the coverage is 100%. Furthermore, we assumed that school closure would remove all school contacts completely. We then compared the effects of a vaccine with 90%, 70%, and 50% efficacy with the effects of school closure by comparing the resulting distributions of the number of contacts in the survey population. This is not intended to be a modelling study, rather a first quantitative interpretation of the contact data in terms of transmission of infection. A full modelling study would require contact data from other age groups.
RESULTS
Characteristics of the sample
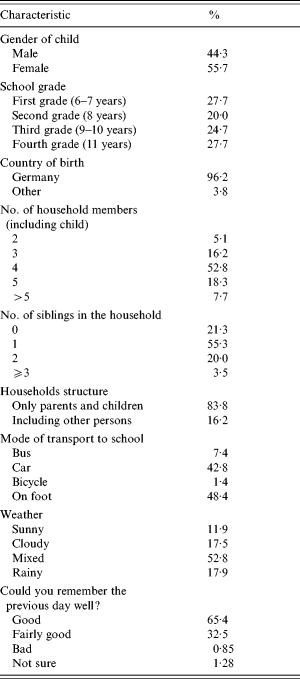
The participants were aged between 6 and 13 years, with a slightly higher proportion of girls (Table 1). Most of children were born in Germany and were living in households with 4–5 family members. About half of the children travel to school by foot and another 43% are driven by car, with only 7% using local transportation. Most of the children stated they could remember their contacts well or fairly well.
Table 1. Characteristics of the sample (n=235)
* Including grandparents.
Number of reported contacts
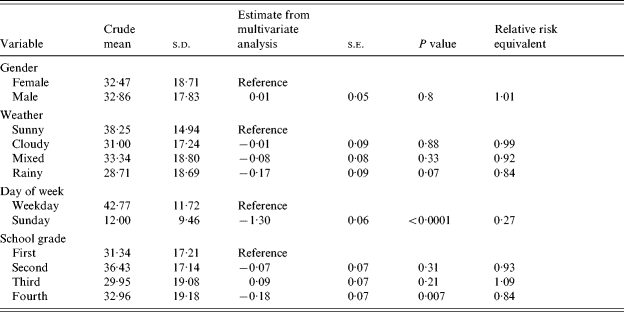
A mean number of contacts per day with children was 25·1 (s.d.=16·5, min. 0, max. 67) and with adults 7·5 (s.d.=5·0, min. 1, max. 47). A total mean of contacts per day was 32·7 (s.d.=18·2, min. 1, max. 78). The number of all reported contacts varied strongly by the day of week, with about four times fewer contacts on Sundays than on weekdays (Fig. 1). This can be explained by a strong contribution of contacts at school to the overall number of contacts (Fig. 2). The frequency distributions of the number of private contacts and contacts at school were strongly skewed and could be well approximated by negative binomial distributions. For the distribution of the number of contacts at school we used a negative binomial distribution shifted by 20 along the x-axis, because that reflects the minimum class size. The shifted distribution had a mean of 12·0 and a variance of 77·3, so in total the mean number of contacts at school was 32. For private contacts the mean of the negative binomial distribution was 11·2 and the variance was 40·4. The effective contact rate for school contacts was 38·4, and for private contacts it was 14·8. There was little variation in the crude number of all reported contacts by different characteristics, apart from the difference between weekdays and Sunday (Table 2, first column). After adjusting for all other variables in multivariate regression only the weekday displayed significant difference, but there was also some trend in the number of contacts related to the weather with 16% lower number of contacts on rainy days than on sunny days. The correlation between the numbers of private contacts and contacts at school was weak (Fig. 3).
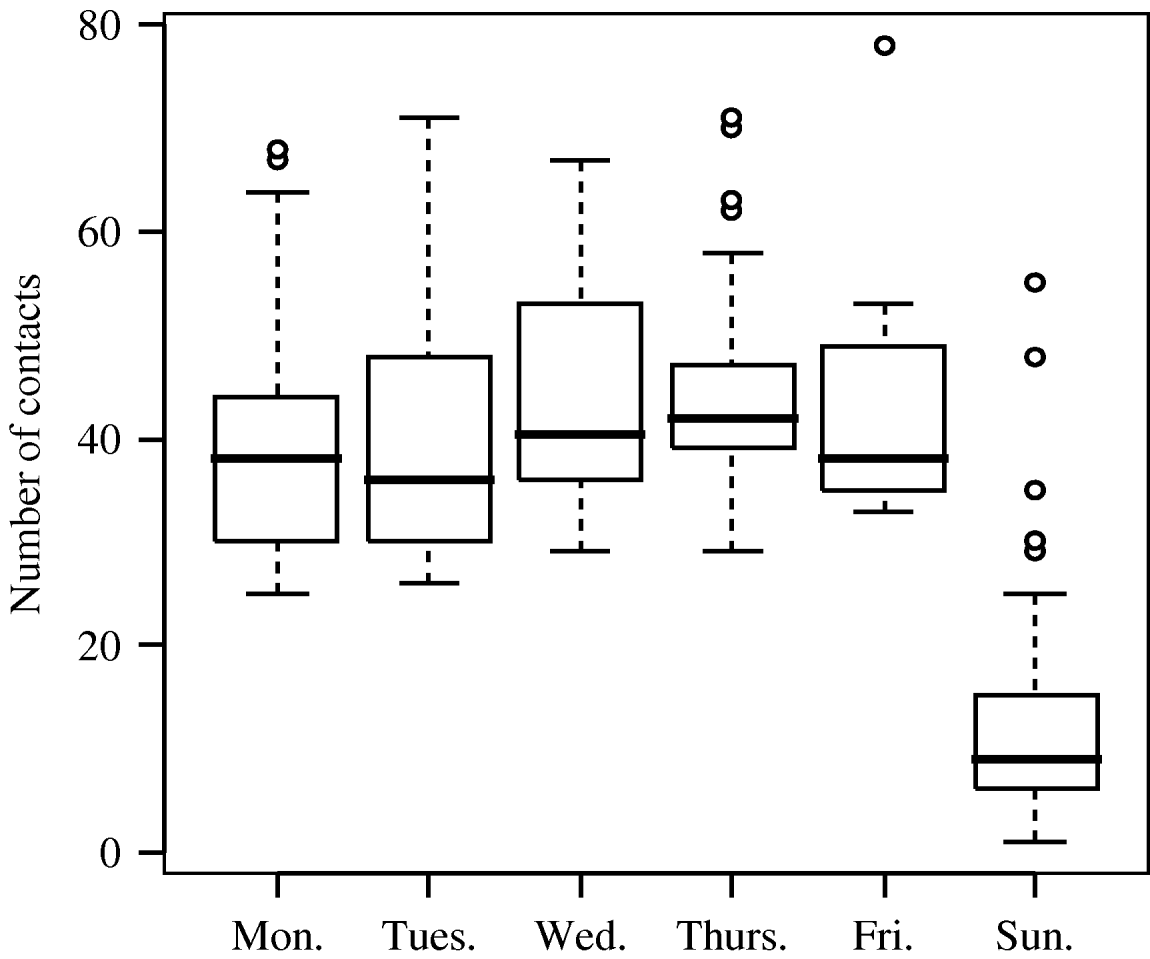
Fig. 1. The numbers of all reported contacts by day of the week.
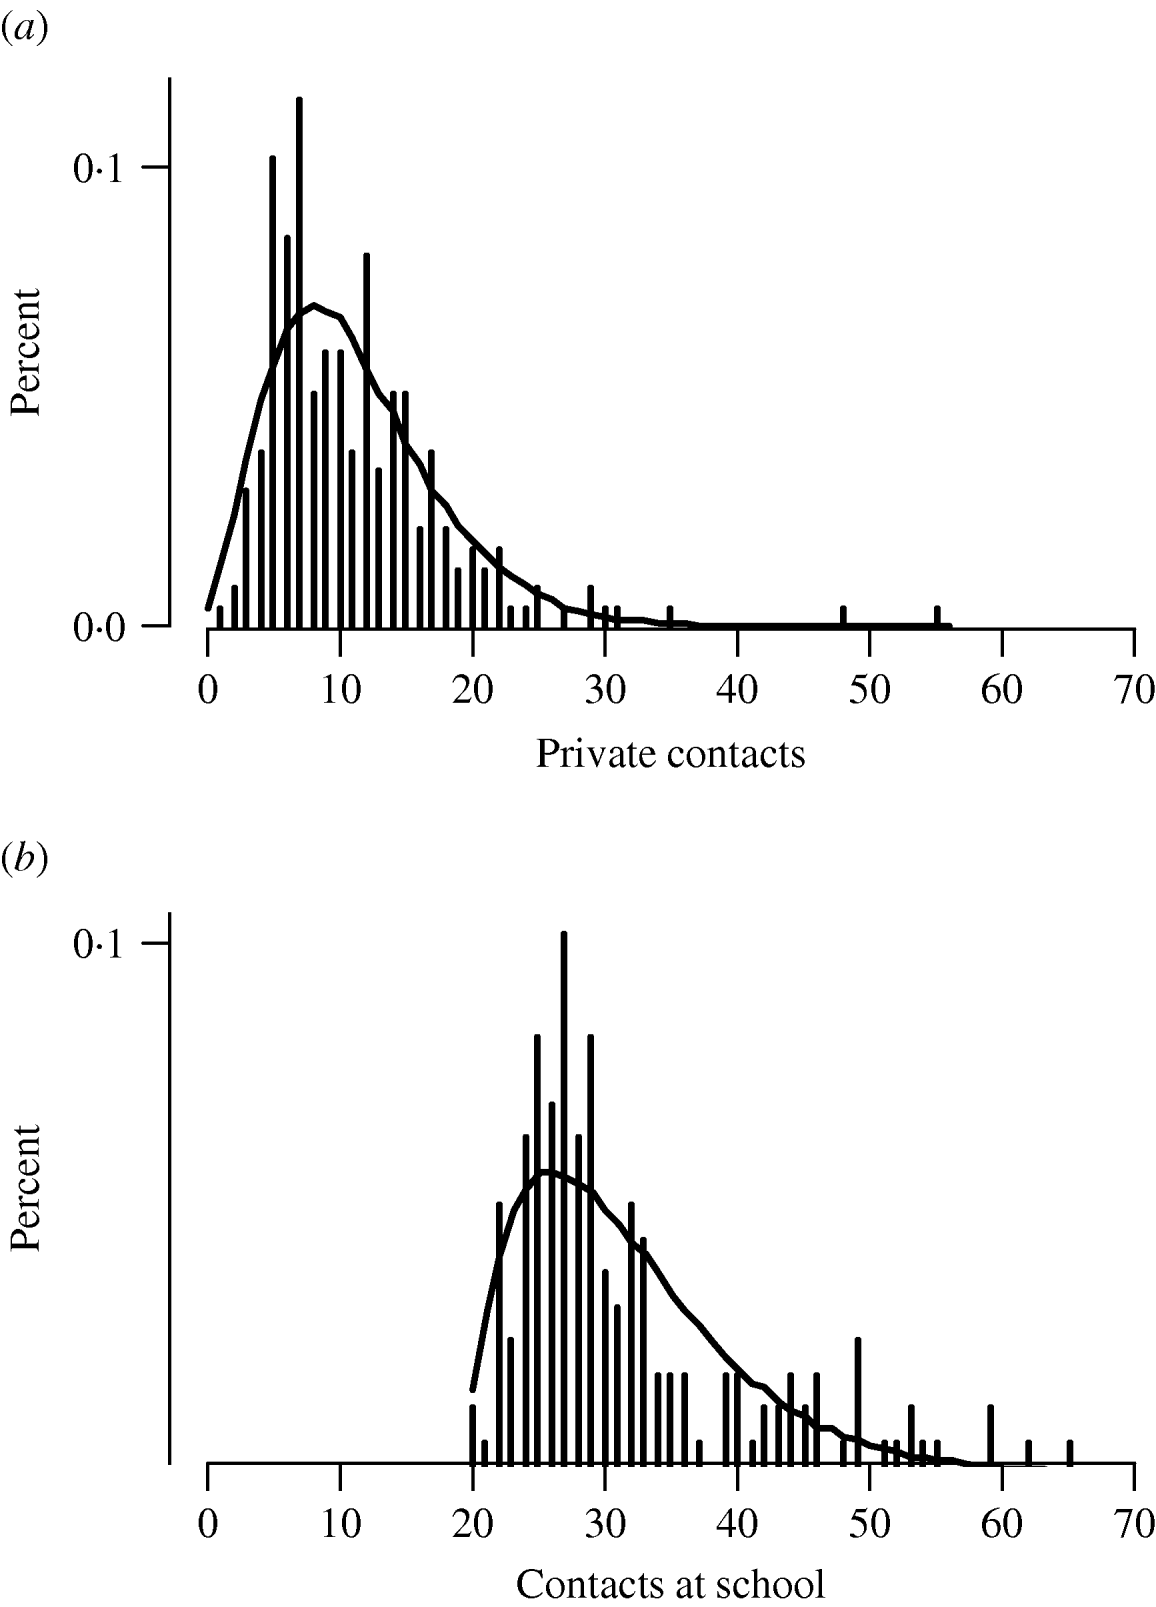
Fig. 2. The distributions of the numbers of (a) private contacts and (b) contacts at school.
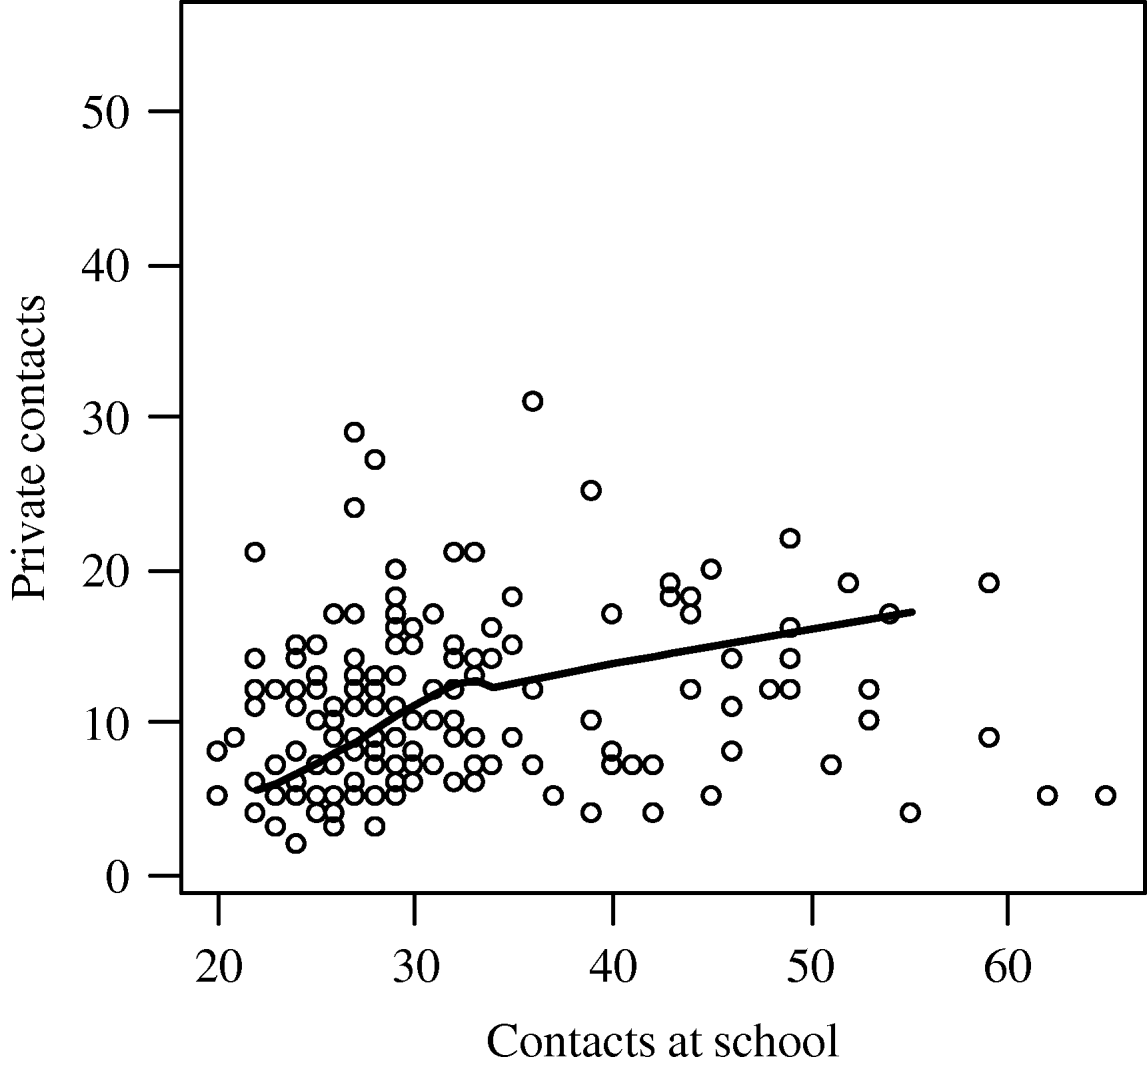
Fig. 3. The number of private contacts is plotted against the number of school contacts for each respondent. For small contact numbers there is a weak positive correlation, while overall the number of private contacts appears to be uncorrelated with the number of school contacts.
Table 2. Association between the number of all reported contacts and selected characteristics of the children (multivariate analysis by negative binomial regression)
Number of private contacts by age group and frequency of meeting
Whereas most of the contacts at school are within the same age group, private contacts were most frequently in the age group of adults aged <50 years which included the parents (Fig. 4). When the private contacts were aggregated within grades, 40% of the contacts of the children were with adults aged <50 years (parents' age group) and 30% with same-age children, leaving about 10% for adolescents, babies or older adults (grandparents' group) (Table 3a). Around 60% of the contacts were every day or often contacts, but between 10% and 18% were rare (less than once per month) or first-time contacts (Table 3b). The variation by grade was negligible. Again we fitted negative binomial distributions to the numbers of contacts with different age groups. It is striking that numbers of contacts outside the own age group are almost Poisson distributed with a variance to mean ratio of about 1, while contacts within the own age group display a strong skewness with a variance to mean ratio of 2·8 (Table 4). The effective contact rates are 1·9 (contacts with younger children), 5·7 (contacts with peers), 3·4 (contacts with older adolescents), 5·6 (contacts with adults, parent group), and 2·7 (contacts with adults, grandparents' group). In other words, the contribution to transmission of a respiratory infection would be greatest to the own age group and to the parents' age group.
Table 3. Proportions of contacts with persons of different age categories and recurrence of contacts for children in grades 1–4. The numbers of contacts with persons from each age category were aggregated within grades of respondents
(a) Fraction of contacts with persons in different age groups for children in grades 1–4

(b) Fraction of contacts reported to occur in different categories describing recurrence

(c) Distribution of rare contacts (several times per month or less) across age categories of contact persons

(d) Distribution of frequent contacts (every day or often) across age categories of contact persons

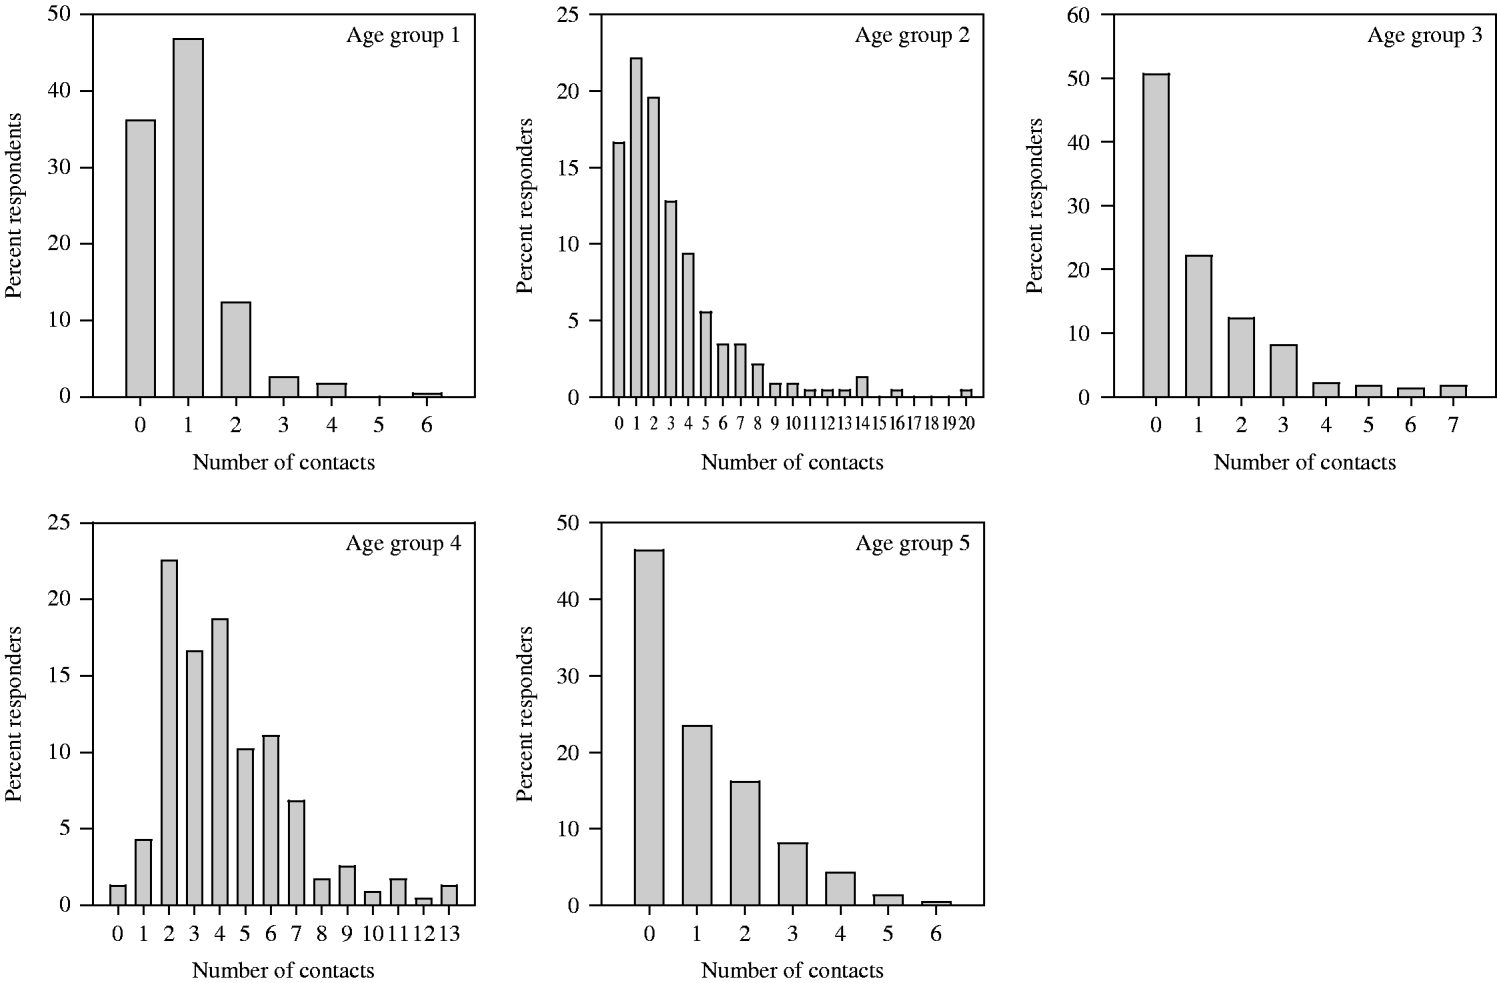
Fig. 4. Distribution of the number of private contacts across age groups. The ages of contacted persons are given in the following categories: age group 1 (preschool children), age group 2 (peers), age group 3 (adolescents), age group 4 (younger adults – parents' age), age group 5 (older adults – grandparents' age).
Table 4. Means and variances of the fitted negative binomial distributions to data presented in Figure 4. The age categories refer to the age of contacted persons (see Methods section)

Number of contacts and being ill in the last 6 months
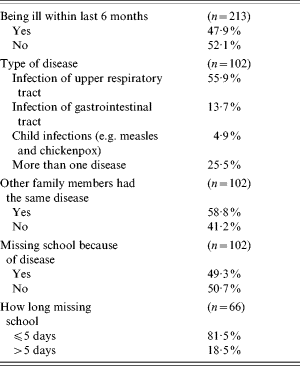
For 213 (91%) children the additional questionnaire related to illness was available, about half of the children had an infectious disease in the past 6 months, in most cases it was infection of the upper respiratory tract (Table 5). We could demonstrate no effect of the number of households members or private contacts on the assigned day on the risk of being ill, but we found an indication for an effect of the binary variable of having siblings vs. not having siblings in simple logistic regression. After adjusting for the two other variables having siblings was associated with an odds ratio of 2·45 (95% CI 1·04–5·75, P=0·04) with having been ill within the past 6 months.
Table 5. Information about children being ill in the last 6 months
Possible effects of vaccination and school closure
The distribution of the number of contacts under school closure can be described by the number of private contacts on weekdays. On average, the number of private contacts on weekdays compares well with the mean number of contacts on Sundays, but the variance on Sundays is larger, probably due to group activities on Sundays. If we assume that the number of contacts on Sundays is a good representation of contact behaviour in case of school closure, we would get an effective contact rate of 19·5.
For vaccination with efficacies of 90%, 70%, and 50%, we get effective contact rates of 4·6, 13·8, and 23·0 on school days. Thus, for a vaccine with an efficacy of somewhat more than 60% the effect of vaccination with a coverage of 100% equals the effect of school closure on the effective contact rate. Keeping in mind that the basic reproduction number of influenza has been estimated at around 2 [Reference Ferguson4, Reference Mills, Robins and Lipsitch23], these effects could be sufficient to contain the further spread of influenza.
DISCUSSION
To the best of our knowledge the present study is the first to collect data specifically on school children in the 6–12 years age group regarding contacts that are relevant for the spread of respiratory-spread agents. An earlier study [Reference Wallinga, Teunis and Kretzschmar10] reported contact frequencies in that age group as part of a larger representative population survey. In the survey reported here, school and other contacts were distinguished, the ages of contact persons were recorded and the numbers of contacts were given by weekday and weather conditions. In addition, we had some information about respiratory illness of respondents in the 6 months before the survey. The distributions of the numbers of contacts both for contacts at school and outside school were highly skewed, but there was little variation with age, sex, or weather conditions. The only major variation in the total number of contacts was between Sundays and weekdays, because there are no school contacts on Sundays.
Those results suggest that contact behaviour of children might be easily described quantitatively without taking too many population heterogeneities into account. The heterogeneity that leads to the skewed distributions of numbers of contacts seems to be variability between individuals and not among population groups. This has implications for the way mathematical models for the spread of respiratory infections should be designed. As emphasized by earlier studies age is the most important determinant for the number of contacts and for how contacts are distributed among the population. Furthermore, different types of contacts can be distinguished depending on the social environment (school, family) in which they take place. The distributions of numbers of contacts for those social environments are independent, but display similar qualitative features. This supports a model structure as used by Longini et al. [Reference Longini2] where the community is subdivided into different social environments in which contacts and transmission take place.
The numbers of contacts cannot easily be compared with the numbers given by Wallinga et al. [Reference Wallinga, Teunis and Kretzschmar10], because they recorded the number of conversations with different people during one week, whereas in our study the definition of a contact was somewhat broader, and we only asked about the numbers for one day. The distribution of contacts over age groups, however, is very similar in the two studies, with the own age group and young adults receiving by far the most contacts from children aged 6–12 years.
Concerning the planning of intervention measures for the case of an outbreak of pandemic influenza our data provides some quantitative information for a possible effect of school closure on the contact frequency and therefore transmission rates. Mean contact rates on Sundays were fourfold lower than on weekdays. The effective contact rate on Sundays was estimated at 19·5, whereas the total effective contact rate on weekdays was around 53, so school closure would imply a reduction to less than half the effective contact rate.
Our distinction between contacts at school and private contacts provides a quantitative basis for evaluating and comparing the effects of vaccinating school-age children and school closure. With vaccination one reduces the transmission probability in all contacts by a factor depending on the vaccine efficacy. In contrast, school closure leads to a reduction of the number of contacts and therefore the upper tail of the contact distribution is removed, which might have a disproportionally large effect as the tail of the distribution contributes strongly to the effective contact number. A combination of those intervention measures might be considered, for example it might be advantageous to close schools until all children have been vaccinated to reach an optimal impact of both measures. For a comprehensive analysis of those interventions a full mathematical model of influenza transmission has to be developed that requires contact data in other age groups.
A limitation of our study is that it is restricted to one school in a specific country setting. To have more representative information more surveys in different settings need to be conducted. This is underway at present in a collaborative effort of a large research group funded by the European Community (POLYMOD project). The strength of our study is that it recruited an unselected sample of all children attending the school with a fairly high response rate. While this can only be a first step in gaining more insight into contact patterns leading to the spread of respiratory infections, it currently provides unique information about the contact patterns of school-aged children.
ACKNOWLEDGEMENTS
We are indebted to the school staff who provided support and the children who participated in the study. This study benefited from discussions as part of POLYMOD, a European Commission project funded within the Sixth Framework Programme (contract no. SSP22-CT-2004-502084).
DECLARATION OF INTEREST
None.


