Social inequalities in adult cardiovascular risk factors are well described in many contexts worldwide( Reference Loria, Arroyo and Fernandez 1 – Reference Kim, Lee and Park 4 ). Furthermore, populations that have undergone very rapid economic transitions, from very low income and subsistence conditions to environments conducive to high energy intake, have experienced dramatic increases in CVD and diabetes( Reference Loria, Arroyo and Fernandez 1 , Reference Veazie, Ayala and Schieb 2 ). Less is known about the effect of change in socio-economic status (SES) during childhood on the development of cardiovascular risk( Reference Kagura, Adair and Pisa 5 , Reference Starkey and Revenson 6 ). The role of changing SES related to the worldwide rise in childhood obesity and development of adolescent hyperlipidaemias has not been adequately studied. Over the last several decades, such changes in the socio-economic landscape were experienced in Chile following major advancements in infrastructure, quality of education, access to potable water, sanitation and health care( Reference Albala, Vio and Kain 7 – Reference Muzzo, Burrows and Cordero 11 ). Chile also experienced a concomitant rise in adverse health risk factors, including poor diet, sedentary behaviour, smoking and alcohol consumption( Reference Albala, Vio and Kain 7 , Reference Kain, Uauy and Vio 8 , Reference Vio and Albala 10 ). Pervasive undernutrition in Chile in the 1960s–1980s was supplanted by overnutrition. Beginning in the late 1980s, the diet resembled a Western diet replete with high energy and hydrogenated fats( Reference Albala, Vio and Kain 7 , Reference Vio and Albala 10 , Reference Muzzo, Burrows and Cordero 11 ). Consequently, overweight and obesity rates increased in Chilean adults and children. By 2015, the prevalence of obesity was 24–25 % in pre-school, kindergarten and first-grade students and 12–13 % for high-school freshmen( Reference Lira and Vio 12 ).
In Chile, obesity, hypertension and metabolic syndrome are more prevalent in low-SES children than high-SES children( Reference Albala, Vio and Kain 7 , Reference Liberona, Castillo and Engler 9 , Reference Vio and Albala 10 , Reference Olivares, Bustos and Lera 13 ). Low-SES households consume half of the fruits and vegetables recommended by the WHO, instead consuming more processed foods, which are inexpensive and accessible( Reference Liberona, Castillo and Engler 9 , Reference Olivares and Bustos 14 ). In addition, there are disparities in physical activity. Children of high-SES households have more physical activity than children of low-SES households, possibly because of better access to secure recreational facilities( Reference Liberona, Castillo and Engler 9 , Reference Burrows, Díaz and Sciaraffia 15 ). There has been scant research on how changing SES influences these health behaviours. The few longitudinal studies reporting changes in SES and their influences on outcomes have focused on obesity, but results have been inconsistent. Some previous cohort studies found that upward SES mobility was protective against physical health problems and obesity for children and adolescents( Reference Boylan, Gill and Hare-Bruun 16 – Reference Savitsky, Manor and Friedlander 18 ). In contrast, other cohort studies reported that upward SES mobility in infancy and childhood resulted in higher obesity in childhood and adulthood, respectively( Reference Starkey and Revenson 6 , Reference Aitsi-Selmi, Batty and Barbieri 19 ). None of these studies were based in Chile.
Plasma HDL-cholesterol (HDL-C), LDL-cholesterol (LDL-C), TAG and total cholesterol (TC) concentrations are surrogate markers for cardiovascular risk in children and adolescents( Reference Amutha, Pradeepa and Chella 20 , Reference Sultan, Dowling and Kirton 21 ). Low HDL-C, high LDL-C, high TAG and high TC concentrations are associated with higher cardiovascular risk( 22 ). Results of cross-sectional studies are mixed, but many report lower concentrations of HDL-C and higher concentrations of LDL-C, TAG and TC among low-SES children, independent of other cardiometabolic risk factors( Reference Savitsky, Manor and Friedlander 18 , Reference Velásquez, Barón and Solano 23 – Reference Manios, Dimitriou and Moschonis 25 ). The purpose of the present study was to determine whether changes in SES over time from infancy to adolescence are associated with plasma HDL-C, LDL-C, TAG and TC concentrations in adolescence in the Santiago Longitudinal Study (SLS). A secondary objective was to assess associations between SES in infancy and adolescence with HDL-C, LDL-C, TAG and TC in adolescence.
Methods
Study design and population
The present study includes 665 adolescents (51·6 % male) who were part of infancy Fe-deficiency anaemia projects and follow-up study in Santiago, Chile( Reference Lozoff, De Andraca and Castillo 26 ). Between 1991 and 1996, 4- to 6-month-old infants were recruited from community clinics in four low- to middle-income, working class communities near the research centre, the Institute for Nutrition and Food Technology (INTA), University of Chile. Inclusion criteria were uncomplicated, singleton, term, vaginal birth with birth weight of 3 kg or more, no major congenital abnormalities and no prior Fe therapy. As part of a preventive trial, infants without Fe-deficiency anaemia were randomly assigned to high- or low-Fe supplementation, or usual nutrition. Primarily breast-fed infants were randomized to vitamins with or without Fe. The conditions lasted 6 months when infants were 6–12 months of age. Details about the enrolment and trial are described elsewhere( Reference Lozoff, De Andraca and Castillo 26 ). Those who had Fe-deficiency anaemia at 6 months and the next non-anaemic control entered a neuromaturation study where infants received medicinal Fe (n 135; Fig. 1)( Reference Roncagliolo, Garrido and Walter 27 ).

Fig. 1 (colour online) Flowchart of selected sample from the Santiago Longitudinal Study (NIH, National Institutes of Health; SES, socio-economic status; HDL-C, HDL-cholesterol; LDL-C, LDL-cholesterol)
Follow-up studies occurred at 5, 10, 16 and 21 years. At 5 years, 888 participants had comprehensive assessments of health and development. At 16 years, 679 participants from the 5-year follow-up participated in a study of adolescent obesity and cardiovascular risk( Reference Burrows, Correa-Burrows and Reyes 28 ), of whom 673 had complete laboratory data. Of these, 511 (76·8 %) had SES information at 1 year, 665 (100·0 %) at 5 years, 585 (88·0 %) at 10 years and 597 (89·8 %) at 16 years. The final sample for the present study included 665 participants with complete SES data for at least two time points and HDL-C, LDL-C, TAG and TC at 16 years. The study was approved by institutional review boards at INTA, University of Chile, University of California, San Diego and the University of Michigan. Parents or primary caregivers provided informed written consent and children provided informed written assent, according to the norms for Human Experimentation, Code of Ethics of the World Medical Association (Declaration of Helsinki, 1995).
Variables
The exposure of interest was change in SES, which was assessed using the modified Graffar Index at 1, 5, 10 and 16 years( Reference Graffar 29 , Reference Méndez Castellano and Méndez 30 ). This index is based on thirteen items scored from 0 to 5 with higher scores indicating lower SES: (i) number of people in a household ‘eating from one pot’ (in the same house); (ii) father’s presence in household; (iii) head of household’s highest educational level; (iv) head of household’s current occupation; (v) retirement and health insurance; (vi) property ownership; (vii) type of house construction; (viii) characteristics of kitchen; (ix) sewage/plumbing; (x) water infrastructure; (xi) number of garbage collections per week; (xii) count of household possessions (car/automobile, refrigerator, stereo, washing machine, black and white television, colour television); and (xiii) necessity of two people sharing a bed or overcrowding. Graffar variables were reverse coded for the present study for ease of interpretation. Thus, higher index scores indicate higher SES and could range from 0 to 65. The change in SES was calculated as the difference in SES indices between 1 and 5, 5 and 10, 10 and 16, and 1 and 16 years.
To represent SES, a principal components factor analysis with varimax rotation was used to extract orthogonal factors from the modified Graffar Index variables at 1 year (see online supplementary material, Supplemental Table 1). The eigenvalues of the correlation matrix from principal components analysis demonstrated that the first factor explained 19·9 % of the variability in the data and the second explained 12·4 % of the variability. Subsequent factors explained little variability. Therefore, only the first two factors were retained. Factor 1 included number of people eating from one pot or in the same house, property ownership, type of housing construction, characteristics of kitchen, water infrastructure and count of household possessions, which we term ‘environmental capital’. Factor 2 included head of household education, head of household occupation, retirement and health insurance, and necessity of people sharing a bed or overcrowding, which we term ‘social capital’. Variables highly correlated with each factor were weighted against their eigenvectors. The same two factors representing SES at 1 year (environmental and social capital) were used to represent SES at every other time point. Environmental and social capital ranged from 0 to 16 and 0 to 12, respectively.
The outcome variables for the present study were plasma concentrations of HDL-C (mg/dl), LDL-C (mg/dl), TAG (mg/dl) and TC (mg/dl) at 16 years, which were determined by dry analytical methodology (Vitros®; Ortho Clinical Diagnostics Inc., Raritan, NJ, USA) after a 12 h overnight fast.
Covariates at 16 years included BMI Z-score (WHO norms); age (years); parent-reported family history of diabetes, high cholesterol, hypertension or heart attack before age 60 years (yes, no); and infancy Fe group (high Fe, low Fe, no added Fe, neuromaturation study).
Statistical analysis
Means and standard deviations were calculated for continuous variables in adolescence (age, BMI, HDL-C, LDL-C, TAG, TC); environmental and social capital at 1, 5, 10 and 16 years; and change in environmental and social capital from 1 to 5, 5 to 10, 10 to 16, and 1 to 16 years (Table 1). Frequency distributions were calculated for categorical variables in adolescence (sex; parental history of diabetes, high cholesterol, hypertension, heart attack; supplementation group). Frequencies of low HDL-C, high LDL-C, high TAG and high TC were also reported using cut-off points defined by the American Academy of Pediatrics Committee on Nutrition( Reference Daniels and Greer 31 ). HDL-C concentrations ≤38 mg/dl for girls and ≤34 mg/dl for boys were considered ‘low’, LDL-C concentrations ≥129 mg/dl for girls and ≥123 mg/dl for boys were considered ‘high’, TAG concentrations ≥112 mg/dl for girls and ≥125 mg/dl for boys were considered ‘high’, and TC concentrations ≥198 mg/dl for girls and ≥183 mg/dl for boys were considered ‘high’.
Table 1 Descriptive statistics of adolescents aged 16–17 years, Santiago, Chile (N 665)
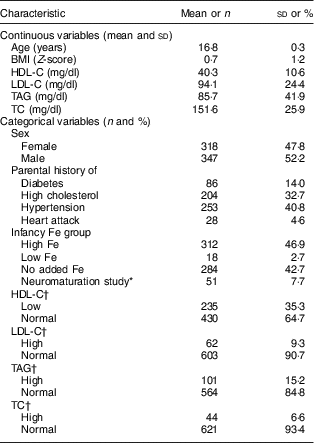
HDL-C, HDL-cholesterol; LDL-C, LDL-cholesterol; TC, total cholesterol.
* Participants in the neuromaturation study were infants found to have Fe-deficiency anaemia at age 6 months and the next non-anaemic infant (control) whose neurodevelopment was evaluated with neurophysiological and electrophysiological techniques.
† By age and sex according to Daniels and Greer( Reference Daniels and Greer 31 ): low HDL-C, ≤38 mg/dl for girls and ≤34 mg/dl for boys; normal HDL-C, >38 mg/dl for girls and >34 mg/dl for boys; high LDL-C, ≥129 mg/dl for girls and ≥123 mg/dl for boys; normal LDL-C, <129 mg/dl for girls and <123 mg/dl for boys; high TAG, ≥112 mg/dl for girls and ≥125 mg/dl for boys; normal TAG, <112 mg/dl for girls and <125 mg/dl for boys; high TC, ≥198 mg/dl for girls and ≥183 mg/dl for boys; normal TC, <198 mg/dl for girls and <183 mg/dl for boys.
As a previous study of this cohort found sex differences in the relationship between various cardiovascular risk factors and meeting criteria for the metabolic syndrome( Reference Burrows, Correa-Burrows and Reyes 28 ), we used two-way ANOVA to test interactions between sex and changes in environmental and social capital on the outcomes (HDL-C, LDL-C, TAG, TC).
Generalized linear models were used to analyse unadjusted (Model 1) and adjusted (Model 2) associations between environmental and social capital at 1 year and 16 years and outcomes (HDL-C, LDL-C, TAG, TC) at 16 years. Model 2 adjusted for confounders identified a priori from the literature: sex( Reference Burrows, Correa-Burrows and Reyes 28 ); age( Reference Mahley, Arslan and Pekcan 32 ); and parental history of high cholesterol( Reference Lauer, Lee and Clarke 33 ), diabetes( Reference Purnell, Dev and Steffes 34 ), hypertension( Reference Facchini, Ida Chen and Clinkingbeard 35 ) and heart attack.
Three separate generalized linear models were constructed to analyse associations between the change in environmental and social capital between 1 and 5, 5 and 10, 10 and 16, and 1 and 16 years, and continuous outcomes (HDL-C, LDL-C, TAG, TC) at 16 years. Model 1 did not adjust for any variables. Model 2 adjusted for confounders (stated above). The final model (Model 3) additionally included baseline environmental or social capital. The baseline value considered for each association was the first value involved in the SES change. For example, environmental capital at 5 years was considered baseline for the environmental capital change between 5 and 10 years. Pearson correlation coefficients were examined to assess potential collinearity between baseline SES and changes in SES. Significance was determined using the Wald F test. Parameter coefficients, standard errors and P values were reported. All analyses were calculated using the statistical software package SAS version 9.4.
Results
Sample characteristics
The mean age of participants in adolescence was 16·8 years and 52·2 % were male (Table 1). Overall, 35·3 % of adolescents had low HDL-C, 9·3 % had high LDL-C, 15·2 % had high TAG and 6·6 % had high TC. The mean environmental and social capital increased between each time point, with the largest changes occurring from 1 to 5 years and from 1 to 16 years (Table 2). From 1 to 16 years, 66·0 % of families increased in environmental capital, 32·1 % decreased and 1·9 % did not change. From 1 to 16 years, 61·8 % of families increased in social capital, 28·9 % decreased and 9·3 % did not change. There was no evidence of collinearity between baseline SES and changes in SES.
Table 2 EnvironmentalFootnote * and socialFootnote † capitalFootnote ‡ derived from principal components analysisFootnote § of the modified Graffar IndexFootnote ║ at 1, 5, 10 and 16 years, and change from years 1 to 5, 5 to 10, 10 to 16, and 1 to 16, Santiago, Chile
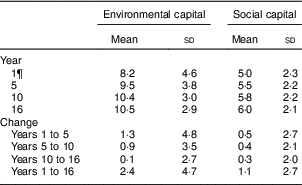
* Environmental capital included: water infrastructure, type of housing construction, characteristics of kitchen, count of household possessions, property ownership and number of people eating from one pot or in the same house. Score range: 0 to 16.
† Social capital included: head of household education, head of household occupation, necessity of people sharing a bed or overcrowding, and retirement and health insurance. Score range: 0 to 12.
‡ Higher capital = higher socio-economic status.
§ Principal components factor analysis included an orthogonal varimax rotation.
║ According to Méndez Castellano and Méndez( Reference Méndez Castellano and Méndez 30 ).
¶ Missing data: year 1, n 154; year 10, n 80; year 16, n 68; years 1 to 5, n 154; years 5 to 10, n 80; years 10 to 16, n 124; years 1 to 16, n 201.
Environmental and social capital and HDL-cholesterol
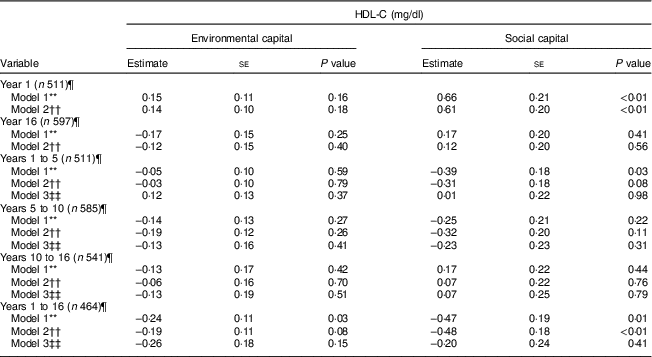
There was an association between increasing environmental capital from 1 to 16 years with lower HDL-C (P = 0·03) which was no longer significant after adjusting for age, sex and parental history of diabetes, high cholesterol, hypertension and heart attack (Table 3).
Table 3 Unadjusted and adjusted associations between environmentalFootnote * and socialFootnote † capitalFootnote ‡ in infancy and adolescence and change in environmental and social capital from years 1 to 5, 5 to 10, 10 to 16, and 1 to 16, derived from principal components analysisFootnote § of the modified Graffar IndexFootnote ║, and HDL-cholesterol (HDL-C) levels in adolescence, Santiago, Chile
* Environmental capital included: water infrastructure, type of housing construction, characteristics of kitchen, count of household possessions, property ownership and number of people eating from one pot or in the same house.
† Social capital included: head of household education, head of household occupation, necessity of people sharing a bed or overcrowding, and retirement and health insurance.
‡ Higher capital = higher socio-economic status.
§ Principal components factor analysis included an orthogonal varimax rotation.
║ According to Méndez Castellano and Méndez( Reference Méndez Castellano and Méndez 30 ).
¶ Missing data:year 1, n 154; year 10, n 80; year 16, n 68; years 1 to 5, n 154; years 5 to 10, n 80; years 10 to 16, n 124; years 1 to 16, n 201.
** Model 1 is unadjusted.
†† Model 2 adjusted for sex; age; family history of high cholesterol, diabetes, hypertension and heart attack; and supplementation group.
‡‡ Model 3 adjusted for sex; age; family history of high cholesterol, diabetes, hypertension and heart attack; supplementation group; and baseline capital (the first value involved in the capital change; i.e. environmental capital at year 1 was considered baseline for the environmental capital change between years 1 and 5).
There was an association between social capital at 1 year and higher HDL-C during adolescence in the unadjusted and adjusted models (P<0·01). Increasing social capital from 1 to 16 years was negatively associated with HDL-C at 16 years in the unadjusted and adjusted models (P≤0·01). This association was no longer significant after adjusting for baseline social capital in infancy (Table 3).
Environmental and social capital and LDL-cholesterol
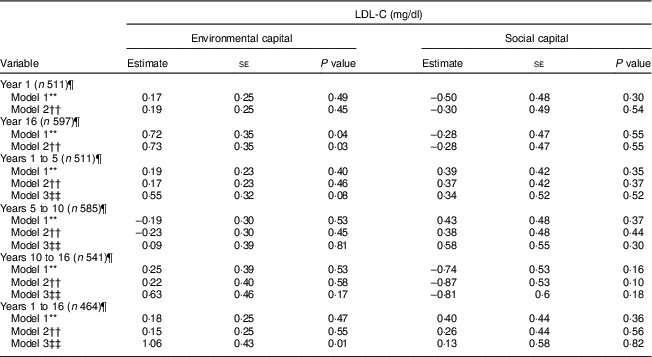
Environmental capital at 16 years was associated with higher LDL-C during adolescence in Models 1 and 2 (P = 0·04 and 0·03, respectively; Table 4). Increasing environmental capital from 1 to 16 years was associated with higher LDL-C in adolescence, after adjusting for environmental capital in infancy (P = 0·01). We did not find associations of social capital or change in social capital with LDL-C (P>0·10).
Table 4 Unadjusted and adjusted associations between environmentalFootnote * and socialFootnote † capitalFootnote ‡ in infancy and adolescence and change in environmental and social capital from years 1 to 5, 5 to 10, 10 to 16, and 1 to 16, derived from principal components analysisFootnote § of the modified Graffar IndexFootnote ║, and LDL-cholesterol (LDL-C) levels in adolescence, Santiago, Chile
* Environmental capital included: water infrastructure, type of housing construction, characteristics of kitchen, count of household possessions, property ownership and number of people eating from one pot or in the same house.
† Social capital included: head of household education, head of household occupation, necessity of people sharing a bed or overcrowding, and retirement and health insurance.
‡ Higher capital = higher socio-economic status.
§ Principal components factor analysis included an orthogonal varimax rotation.
║ According to Méndez Castellano and Méndez(30).
¶ Missing data: year 1, n 154; year 10, n 80; year 16, n 68; years 1 to 5, n 154; years 5 to 10, n 80; years 10 to 16, n 124; years 1 to 16, n 201.
** Model 1 is unadjusted.
†† Model 2 adjusted for sex; age; family history of high cholesterol, diabetes, hypertension and heart attack; and supplementation group.
‡‡ Model 3 adjusted for sex; age; family history of high cholesterol, diabetes, hypertension and heart attack; supplementation group; and baseline capital (the first value involved in the capital change; i.e. environmental capital at year 1 was considered baseline for the environmental capital change between years 1 and 5).
Environmental and social capital and total cholesterol
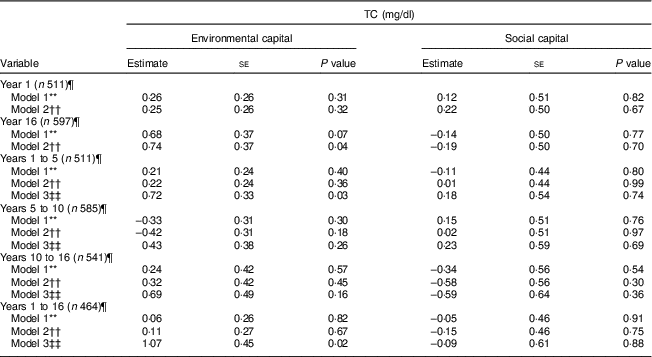
Environmental capital at 16 years was associated with higher TC during adolescence in Model 2 (P = 0·04; Table 5). Increasing environmental capital from 1 to 5 years (P = 0·03) and from 1 to 16 years (P = 0·02) were associated with higher TC in adolescence, after adjusting for environmental capital in infancy. We did not find associations of social capital or change in social capital with TC (P>0·30).
Table 5 Unadjusted and adjusted associations between environmentalFootnote * and socialFootnote † capitalFootnote ‡ in infancy and adolescence and change in environmental and social capital from years 1 to 5, 5 to 10, 10 to 16, and 1 to 16, derived from principal components analysisFootnote § of the modified Graffar IndexFootnote ║, and total cholesterol (TC) levels in adolescence, Santiago, Chile
* Environmental capital included: water infrastructure, type of housing construction, characteristics of kitchen, count of household possessions, property ownership and number of people eating from one pot or in the same house.
† Social capital included: head of household education, head of household occupation, necessity of people sharing a bed or overcrowding, and retirement and health insurance.
‡ Higher capital = higher socio-economic status.
§ Principal components factor analysis included an orthogonal varimax rotation.
║ According to Méndez Castellano and Méndez(30).
¶ Missing data: year 1, n 154; year 10, n 80; year 16, n 68; years 1 to 5, n 154; years 5 to 10, n 80; years 10 to 16, n 124; years 1 to 16, n 201.
** Model 1 is unadjusted.
†† Model 2 adjusted for sex; age; family history of high cholesterol, diabetes, hypertension and heart attack; and supplementation group.
‡‡ Model 3 adjusted for sex; age; family history of high cholesterol, diabetes, hypertension and heart attack; supplementation group; and baseline capital (the first value involved in the capital change; i.e. environmental capital at year 1 was considered baseline for the environmental capital change between years 1 and 5).
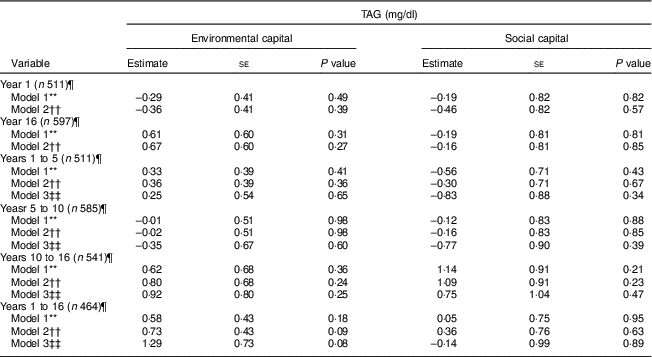
These findings did not vary by sex (P>0·24). Additionally, we did not find associations between environmental or social capital or change in environmental or social capital and TAG (P≥0·08; Table 6).
Table 6 Unadjusted and adjusted associations between environmentalFootnote * and socialFootnote † capitalFootnote ‡ in infancy and adolescence and change in environmental and social capital from years 1 to 5, 5 to 10, 10 to 16, and 1 to 16, derived from principal components analysisFootnote § of the modified Graffar IndexFootnote ║, and TAG levels in adolescence, Santiago, Chile
* Environmental capital included: water infrastructure, type of housing construction, characteristics of kitchen, count of household possessions, property ownership and number of people eating from one pot or in the same house.
† Social capital included: head of household education, head of household occupation, necessity of people sharing a bed or overcrowding, and retirement and health insurance.
‡ Higher capital = higher socio-economic status.
§ Principal components factor analysis included an orthogonal varimax rotation.
║ According to Méndez Castellano and Méndez( Reference Méndez Castellano and Méndez 30 ).
¶ Missing data: year 1, n 154; year 10, n 80; year 16, n 68; years 1 to 5, n 154; years 5 to 10, n 80; years 10 to 16, n 124; years 1 to 16, n 201.
** Model 1 is unadjusted.
†† Model 2 adjusted for sex; age; family history of high cholesterol, diabetes, hypertension and heart attack; and supplementation group.
‡‡ Model 3 adjusted for sex; age; family history of high cholesterol, diabetes, hypertension and heart attack; supplementation group; and baseline capital (the first value involved in the capital change; i.e. environmental capital at year 1 was considered baseline for the environmental capital change between years 1 and 5).
Discussion
Over one-third of Chilean adolescents in our study had low HDL-C at age 16 years, 9·3 % had high LDL-C, 15·2 % had high TAG and 6·6 % had high TC. Higher social capital in infancy, assessed by head of household education, occupation, retirement and health insurance, and lower necessity of sharing a bed, was associated with higher HDL-C during adolescence. Environmental capital in adolescence, which included lower number of people eating from one pot, property ownership, house construction, kitchen characteristics, water infrastructure and household possessions, was associated with higher LDL-C and TC during adolescence. Increasing environmental capital from 1 to 16 years was associated with higher LDL-C in adolescence. Additionally, increasing environmental capital from 1 to 5 years and from 1 to 16 years were associated with higher TC. Finally, increasing social capital from 1 to 16 years was associated with lower HDL-C, but this association was no longer significant after holding baseline social capital constant.
Our finding that 35·3 % of adolescents had low HDL-C is similar to that in a study by Barja et al. who found low concentrations of HDL-C in 31·4 % of a sample of Chilean schoolchildren aged 10–14 years( Reference Barja, Barrios and Arnaiz 36 ). These findings are consistent with the interpretation by Barja et al. that the Chilean diet follows a more atherogenic pattern than the international norm( Reference Barja, Barrios and Arnaiz 36 ). High consumption of ultra-processed foods, carbohydrates, snacks, cereals and sweets are associated with low HDL-C( Reference Tavares, Fonseca and Rosa 37 ) and are more common among children from low-SES neighbourhoods( Reference Albala, Vio and Kain 7 , Reference Liberona, Castillo and Engler 9 ).
Our finding that social capital in infancy was associated with greater HDL-C in adolescence is in accord with other studies( Reference Velásquez, Barón and Solano 23 , Reference Buitrago-Lopez, van den Hooven and Rueda-Clausen 24 , Reference Ruiz, Bosch and Rodriguez 38 ). At least one other study has shown that children of higher SES are less likely to have dyslipidaemia and lower HDL-C than children of low-SES families, which may in part be attributed to better access to nutritious foods( Reference Buitrago-Lopez, van den Hooven and Rueda-Clausen 24 ). Our study also demonstrated that positive change in social capital from 1 to 16 years was associated with lower HDL-C. To assess associations between the change in social capital (e.g. head of household’s education, occupation, retirement and health insurance, and lower necessity of sharing a bed) and lipoproteins, we held social capital in infancy constant. The finding that the association was no longer significant after controlling for social capital at infancy suggests that social capital in infancy may have a greater influence on later HDL-C levels than subsequent changes in social capital. These results are also consistent with a large US multisite longitudinal study which showed that SES in infancy had a larger impact on adiposity in the first 10 years of life compared with changes in SES in childhood( Reference Starkey and Revenson 6 ).
Many studies have demonstrated associations between low SES and increases in LDL-C and TC( Reference Savitsky, Manor and Friedlander 18 , Reference Buitrago-Lopez, van den Hooven and Rueda-Clausen 24 , Reference Manios, Dimitriou and Moschonis 25 ). Our study suggests that certain aspects of SES are especially relevant. We found that higher environmental capital (e.g. lower number of people eating from one pot, property ownership, house construction, kitchen characteristics, water infrastructure and household possessions) in adolescence was associated with higher LDL-C and TC in adolescence. In countries that have undergone a rapid social and nutritional transition, higher SES may promote sedentary behaviour and increase Western dietary patterns high in carbohydrates and simple sugars, thereby increasing LDL-C and TC( Reference Buitrago-Lopez, van den Hooven and Rueda-Clausen 24 , Reference Ruiz, Bosch and Rodriguez 38 ).
The apparent contradictory finding that social capital in infancy and environmental capital in adolescence were associated with greater HDL-C and LDL-C in adolescence, respectively, may be a reflection of measurements of social and environmental capital at different time points. It is conceivable that high social capital during infancy has long-term benefits for HDL-C into adolescence, whereas environmental capital in adolescence has a greater short-term influence on LDL-C in adolescence. Greater head of household education, occupation and health insurance early in life, represented by social capital, may indicate a better understanding of paediatric nutrition and better access to healthy foods over time. Greater property ownership, house construction and household possessions, represented by environmental capital, may relate to increased sedentary behaviour in the short term.
Positive changes in environmental capital from infancy to adolescence were associated with greater LDL-C and TC during adolescence. Additionally, positive changes in environmental capital from 1 to 5 years were associated with greater TC during adolescence. We are unaware of previous studies examining associations between changing SES and HDL-C, LDL-C, TAG or TC in a paediatric cohort. Previous studies of associations between SES change in childhood and cardiometabolic risk have been inconsistent. Some report benefits of upward SES mobility on cardiometabolic risk( Reference Boylan, Gill and Hare-Bruun 16 – Reference Savitsky, Manor and Friedlander 18 ), whereas others do not( Reference Starkey and Revenson 6 , Reference Aitsi-Selmi, Batty and Barbieri 19 ). In contrast to our study, these studies considered only occupation, education and income as measures of SES. In our study, environmental capital included measures of household infrastructure. Studies of adults in Jerusalem and Great Britain (aged 30–35 years and 44–45 years) have shown that upward SES mobility in childhood was positively associated with HDL-C and negatively associated with LDL-C( Reference Savitsky, Manor and Friedlander 18 , Reference Power, Atherton and Strachan 39 ). Those studies of adults are in contrast to our findings among adolescents in a country with a rapidly expanding economy. One might hope that the positive effects of increasing environmental capital on SES will manifest for this cohort in adulthood. However, the contexts of these two studies are quite different from our study in Chile. The two reference studies focus on upward mobility in more stable economies, whereas ours takes place during a rapid economic transition with dramatic changes in the food and physical activity environments. It is conceivable that increasing environmental capital throughout childhood may influence behaviours, such as dietary preferences, that increase LDL-C. These behaviours during the first 5 years of life may be particularly influential on TC in adolescence. These results suggest that the rapid increase in environmental capital may pose health risks if not accompanied by an increase in educational and social capital. The divergent findings from the three studies suggest that experiencing dramatic society-wide economic and environmental changes is not comparable to and does not have the same health effects as upward mobility.
Environmental and social capital and the change in environmental and social capital were not found to be associated with TAG in adolescence. Since TAG are strongly affected by recent diet( Reference Sadrzadeh and Kline 40 ), it is possible that our one-time measurement of TAG is insufficient to adequately assess associations with environmental and social capital.
There are a few notable limitations of the present study. First, the sample of adolescents was recruited from neighbourhoods of low to middle SES and thus is not representative of the larger population of Chilean youth( Reference Delva, Lee and Sanchez 41 ). Second, despite the temporal precedence of change in SES measured since infancy related to HDL-C, LDL-C, TAG and TC measured in adolescence, we cannot infer causality. Third, the modified Graffar Index was designed to differentiate SES within low-income populations( Reference Graffar 29 ). As SES improved for this cohort over the 16 years of study, some of the variables became irrelevant, such as access to sewers. Therefore, the measure may have become less useful in differentiating between levels of lower SES.
Notwithstanding these limitations, the longitudinal nature of the study design allowed us to assess the change in specific dimensions of SES over time. These results demonstrate that there may be early-life sensitive periods related to the role of SES in relation to lipoprotein concentrations later in life.
Conclusion
In a Chilean cohort, we found evidence to show that improvements in environmental capital throughout childhood, over a period of rapid economic transition, were associated with higher LDL-C and TC concentrations. However, social capital in infancy was associated with higher HDL-C in adolescence, while environmental capital in adolescence was associated with higher LDL-C and TC in adolescence.
Acknowledgements
Financial support: The project was supported by the National Heart, Lung, and Blood Institute (NHLBI) (principal investigator S.G., grant number R01HL088530) and the National Institute of Child Health and Human Development (NICHD) (principal investigator B.L., grant number R01HD14122) (principal investigators B.L. and S.G., grant number R01HD33487). The NHLBI and NICHD had no role in the design, analysis or writing of this article. Conflict of interest: None declared. Authorship: Z.J.M., E.B. and S.G. conceived the research question and designed the study. Z.J.M. conducted statistical analyses and wrote manuscript drafts. E.B., R.B., B.L. and S.G. contributed to data interpretation and revisions of the manuscript. Ethics of human subject participation: This study was conducted according to the guidelines laid down in the Declaration of Helsinki and all procedures involving human subjects were approved by institutional review boards at INTA, University of Chile, University of California, San Diego and the University of Michigan. Written informed consent was obtained from all subjects.
Supplementary material
To view supplementary material for this article, please visit https://doi.org/10.1017/S1368980018003087


