In developing countries, diet quality is frequently measured through diet variety indices (counts of unique foods or predefined food groups)( Reference Ruel 1 ), but variety is only one dimension of healthy eating( Reference Ruel 1 , Reference Murphy, Foote and Wilkens 2 ). These contexts are now showing an increased coexistence of diseases associated with overnutrition( Reference Waijers, Feskens and Ocke 3 – Reference Kant 6 ), alongside those associated with undernutrition( Reference Uauy, Albala and Kain 7 – Reference Uauy and Kain 10 ), especially affecting the health of vulnerable segments of society( Reference Pena and Bacallao 11 ). This issue points to the importance of improving assessments of diet quality in developing countries. While existing indicators have been applied to samples in developing countries( Reference Previdelli, Andrade and Pires 12 – Reference Fisberg, Slater and Barros 15 ), differences in eating patterns affect the soundness of this approach. Many indicators are based on dietary guidelines of the countries in which they were developed( Reference Kennedy, Ohls and Carlson 16 – Reference Haines, Siega-Riz and Popkin 18 ), reflecting local food patterns and nutritional concerns and priorities expressed by experts of those countries. For example, as the US-based Healthy Eating Index (HEI) penalizes the over-consumption of fats( Reference Kennedy, Ohls and Carlson 16 ), it would mask deficiencies in fat intake still present in resource-poor settings. The Diet Quality Index-International (DQI-I)( Reference Kim, Haines and Siega-Riz 19 ) partly addresses these issues, but it was developed for individual-level assessments and not for households. However, in developing countries data are collected at the household level, as individual-level data collection is prohibitive in cost. The development of a household-level indicator of dietary quality is a plausible solution to this problem, since studies comparing individual-level diet data with household-level data have found a close relationship between the two( Reference Ghosch, Pellett and Aw-Hassan 20 – Reference Becker 23 ). The current paper presents the Household Diet Quality Indicator (HDQI) for El Salvador, tackling the needs outlined above, as a household-level diet quality indicator addressing nutritional issues in a population undergoing nutritional transition. We applied the indicator to a sample from vulnerable, potentially food-insecure communities in El Salvador.
Experimental methods
Study sample
The data used were collected in 2009 by the Regional Program of Food Security in Central America (PRESANCA) from a non-random sample of communities in border municipalities selected on the basis of high rates of chronic malnutrition and vulnerability from climatic and environmental conditions( 24 ). The original sample contained 167 households, but twenty-seven households with estimated energy intakes above 16 736 kJ/d per AE (4000 kcal/d per AE) were excluded from the analysis, resulting in a sample size of 140 households (855 individuals). The Tufts University Institutional Review Board granted exemption status for the study on July 2010, as a study based on secondary data analysis.
Food consumption assessment
Food consumption was assessed with a validated FFQ( Reference Bermudez 25 ) collecting household intake in the ‘previous week’ of fifty-nine food items grouped into nine categories (basic grains, other grains, dairy/eggs, meats, vegetables, fruits, added fats, sugars, other miscellaneous foods). The questionnaire was administered by trained interviewers using open-ended questions to collect frequency of consumption and portion size. Completed questionnaires were checked for quality control. Nutrient intakes from foods reported in the FFQ were obtained using a composite nutrient database( 26 , 27 ). Energy requirements estimations were based on WHO recommendations( 28 ). ‘Adult equivalents’ (AE) were calculated following FAO procedures( Reference Swindale and Ohri-Vachaspati 29 ). Analyses excluded household members younger than 1 year of age, as they are primarily breast-fed.
Development of the Household Diet Quality Indicator (HDQI)
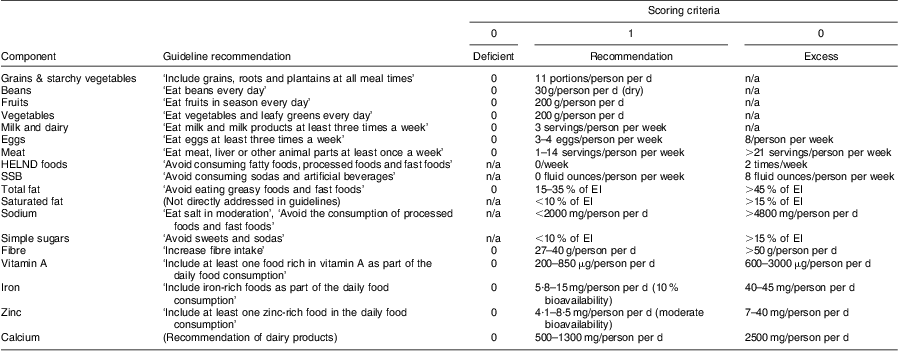
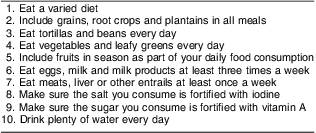
The 2008 Salvadorian dietary guidelines (see Appendix)( 30 ) were reviewed and eighteen components were identified (nine foods and nine nutrients). The components were quantified using WHO dietary goals for the prevention of chronic diseases and other resources( 31 – 37 ). Each component received a proportional score between 0 and 1, penalizing both over- and under-consumption, where appropriate (Table 1). The HDQI score was obtained by aggregating the component scores, and translated into a 100-point scale. Households were then split into two categories at the median.
Table 1 HDQI quantification and scoring criteria by component

HDQI, Household Dietary Quality Indicator; HELND, high-energy, low-nutrient-density; SSB, sugar-sweetened beverages; EI, energy intake; n/a, not applicable.
Food-based component recommendations were quantified at the individual level using AE units. The grains and starchy vegetables component (‘grains/starches’) was quantified by aggregating the grains and starchy vegetables recommendations using the US Department of Agriculture's MyPlate food pattern based on a 11 715 kJ/d (2800 kcal/d) diet( 37 ). The bean, fruit and vegetable component scoring criteria were based on the WHO dietary goals for the prevention of chronic diseases( 31 ). Beans are one of the staple foods of the Salvadorian diet and the main source of protein for households without access to animal products. The WHO recommendation for fruit and vegetable intake( 31 ) was divided into the two different components, as they contribute different benefits to the diet( Reference van't Veer, Jansen and Klerk 38 ). The fruit component assessed consumption of whole fruits only, and not juice. The dairy component recommendation was based directly on the Salvadorian dietary guidelines. Over-consumption was not penalized because of the importance of milk products as a source of calcium. Eggs were assessed separately from dairy, as an important source of animal protein. The recommendation was based on the Salvadorian and WHO recommendations( 30 , 31 ) and an upper limit was set based on recent cholesterol recommendations( 39 ). The meat component reflects the minimum established by the Salvadorian guidelines and concerns kidney problems and obesity associated with excess consumption( Reference Walker, Rhubart-Berg and McKenzie 40 ), with an upper limit based on the American Heart Association recommendations( Reference Lichtenstein, Appel and Brands 35 ). Finally, the HDQI assessed intake of high-energy, low-nutrient-density (HELND) foods (sweets and manufactured snacks) using frequency and intake of sugar-sweetened beverages (SSB; fruit and carbonated drinks) using the Harvard Healthy Beverage Plan( Reference Popkin, Armstrong and Bray 36 ) (Table 1).
Nutrient-based components were calculated using WHO recommendations( 31 , 32 ), based on total household energy intake (EI) or by aggregating the individual household member recommendations, except in the case of fibre, where AE were used. Scoring of these components penalized excess and deficient consumptions, except in the case of saturated fat, sodium and simple sugars, where only excesses were penalized. Deficient intakes in total fat (<15 % of EI) were penalized because of the importance of this nutrient for fat-soluble vitamin absorption and other bodily functions. Upper levels for total fat, saturated fat and sodium used the ones established in the HEI( Reference Fogli-Cawley, Dwyer and Saltzman 17 ). No source was available to establish an upper level for simple sugars; therefore we used a 50 % increase from the established recommendation as the upper limit for this component. Simple sugars included those added to foods (sugar, honey, jams) and those coming from drinks (sodas, juices) and food (ice cream, cookies, candy) sources. Excess fibre consumption was penalized given the high wholegrain intake in this population and the potential for gastrointestinal discomfort and reduced mineral bioavailability( Reference Hallberg 41 , Reference Harland 42 ). The vitamin A, calcium, iron and zinc components were assessed based on WHO recommendations( 32 ), using ‘moderate’ (30 %) bioavailability for zinc and 10 % bioavailability for iron( 32 ). Individual nutrient recommendations were aggregated and compared with the household intake using a proportion of recommendation consumed ratio (PRCR), where PRCR<1 indicated an intake below the recommendation. Excess intakes for these micronutrients were assessed by aggregating individual upper tolerable levels (UL), set by age/gender group( 43 ), at the household level and calculating an excess consumption ratio (ECR), based on household recommendations. If the PRCR exceeded the ECR, the household was classified as exceeding the recommendation, and received a score of zero for the component.
Expert consultation
In 2011, twenty-eight representatives with an average of 15 years of experience working with nutrition and food security issues reviewed a first proposal for the HDQI. The organizations represented included academic institutions, government agencies and professional associations. Experts reported high agreement with the indicator as a measure of diet quality for Salvadorian households (88 %). Feedback collected during this consultation was used in the final development of the indicator.
Statistical analyses
The data were analysed using the statistical software package Stata/IC 11·2. The HDQI distribution was assessed through skewness and kurtosis analysis. Spearman rank-order correlation was used to measure inter-item correlations between the indicator components. Household intakes for each component were classified according to the level of adherence with the HDQI recommendations (adherent, below or above recommended intake range). In the case of vitamin A, calcium, zinc and iron, households were classified as above the recommendation if consumption was more than two times the recommendation. Variety indicators were used to assess the indicator's face validity( Reference Kant 6 ), including the number of different predefined food groups consumed (grains/starches, beans, fruit, vegetables, eggs, dairy, added fats, meat), the total number of unique foods consumed and the variety within selected food groups. Student's independent-samples t tests and correlations were used to compare these variety indicators and nutrient and energy intakes between households with scores above and below the median.
Results
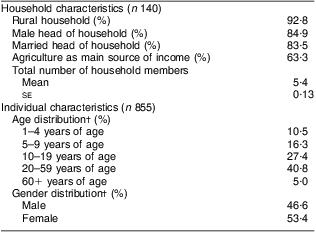
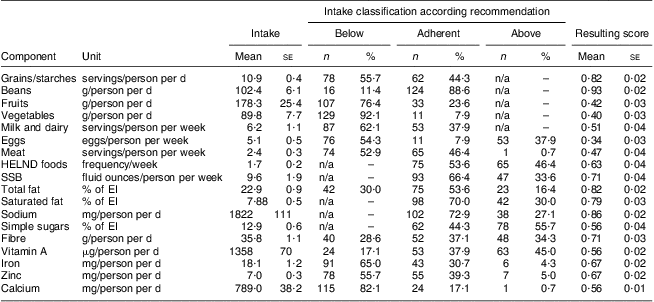
Most households were located in rural areas, with married, male household heads and agriculture as the primary source of income (Table 2). Most households (79·3 %) presented both deficiencies and excesses in consumption in at least one HDQI component. Adherence was high for the bean, sodium and saturated fat components. Almost all of the households were below the recommended intake for vegetables, calcium and fruits. Household intakes were above recommended levels notably for simple sugars, HELND foods and vitamin A (Table 3). The consumption of vitamin A was highly correlated with the consumption of simple sugars (ρ = 0·84, P < 0·00). About one-third of households (33·6 %) exceeded the upper limit for simple sugar consumption. Four households (2·9 %) exceeded the UL for vitamin A. While more than half of the households presented intakes within the recommended range for total fat, 30 % of households failed to consume the minimum recommendation. The consumption of dairy and meat was low, but the egg consumption showed intakes above and below the recommendation (Table 3). Also, thirty-three (23·6 %) households exceeded the upper intake limit (data not shown). The bean component presented the highest mean score (0·93) and the egg component presented the lowest (0·34). Inter-component correlations were low or moderate( Reference Dallal 44 ), with the highest correlation shown between the saturated fat and sodium component scores (ρ = 0·5, P < 0·05). The resulting mean HDQI score was 63·5 (sd 8·7, range 43·6–90·0). The HDQI score was normally distributed (skewness/kurtosis test for normality, P = 0·38). Households were split evenly above and below the median score (62·7, interquartile range 11·53), with seventy households in each category. Households above the median had a mean HDQI score of 70·5 (sd 5·9, range 62·7–90·0). Households below the median had a mean score of 56·5 (sd 4·5, range 43·6–62·7).
Table 2 Household- and individual-level demographic characteristics of the study sample; 140 households (855 individuals) from vulnerable, border communities in El Salvador, 2009

†Children younger than 1 year of age were excluded from the analysis.
Table 3 Food intakes by HDQI component: mean component intakes and their standard errors, evaluation of intakes according to HDQI criteria and resulting mean individual scores and their standard errors; 140 households (855 individuals) from vulnerable, border communities in El Salvador, 2009

HDQI, Household Dietary Quality Indicator; HELND, high-energy, low-nutrient-density; SSB, sugar-sweetened beverages; EI, energy intake; n/a, not applicable.
Mean intakes were calculated using adult equivalents, where appropriate.
The sample had a mean energy intake of 9234 (sd 3330; range 760–3968) kJ/d per AE. Households with HDQI scores above the median had a mean energy intake of 9406 (sd 2866) kJ/d per AE, while the households below the median had a mean intake of 9058 (sd 3753) kJ/d per AE. These differences were not significant (t = −0·62, P = 0·54) and energy intake was weakly correlated with the HDQI score (ρ = 0·23, P = 0·007).
Diet variety was low, especially when measured as the count of unique foods consumed. Variety indicators were significantly different between households with HDQI scores above and below the median, except for variety in the grains/starches and SSB. Households with scores above the median presented more varied diets v. households with below-median score, except in the case of HELDN foods where variety was lower (Table 4). Correlation analysis showed that the HDQI score was positively associated with variety in unique foods, food groups, unique number of fruits and meats consumed, and negatively associated with variety in HELND foods and SSB (Table 4). The HDQI was significantly and positively associated with protein, vitamin C and potassium intakes (Table 5).
Table 4 Mean dietary variety indicators (overall and by HDQI classification) with their standard errors and correlation with HDQI score; 140 households (855 individuals) from vulnerable, border communities in El Salvador, 2009

HDQI, Household Dietary Quality Indicator; HELND, high-energy, low-nutrient-density; SSB, sugar-sweetened beverages
Mean values were significantly different from those of households with HDQI score above the median: *P < 0·05.
Table 5 Mean intakes of selected nutrients (overall and by HDQI classification) with their standard errors and correlation with HDQI per adult equivalent unit; 140 households (855 individuals) from vulnerable, border communities in El Salvador, 2009

HDQI, Household Dietary Quality Indicator.
Mean values were significantly different from those of households with HDQI score above the median: *P < 0·05.
Discussion
The HDQI was applied to resource-poor Salvadorian households, revealing a relatively low diet quality. Low ratings for the HDQI score came from both excesses and deficiencies, stressing the need to meet nutritional requirements within recommended ranges. Excesses were found in vitamin A, iron, eggs and sugar consumption, while the deficiencies came from not eating enough fruit, vegetables, meats, dairy and total fat, and in some households, eggs. This reflects the unique feature of this indicator. For example, if excesses in micronutrients and deficiencies in total fat had not been penalized, these would have been masked by higher HDQI scores. Therefore, the indicator underscores the importance of assessing both spectrums of consumption, especially in populations at risk of excess and deficient consumption for certain nutrients. The high consumption of simple sugars raises the risk of vitamin A toxicity in some households given El Salvador's mandatory sugar fortification policy( Reference Dary 45 ). Household intakes were within the recommendations for sodium and saturated fat components. However, as sodium assessment did not include added salt at the table, there might be an underestimation in this component.
The indicator behaved as expected and there is no evidence that the indicator is biased towards households consuming more energy. The HDQI was positively correlated with overall diet variety indicators and negatively correlated with indicators of a low quality diet (variety in HELND foods and SSB). However, the indicator was not correlated with the different types of fat (Table 5). While the overall sample presented low fat intakes, this issue may also be indicative that the HDQI is not capturing differences between fats. More studies are needed to test and refine the indicator with samples presenting more variability in diets and diet quality.
The study had some limitations associated with the use of an FFQ and secondary data analysis. Food intake was collected for a 1-week period, which may not be indicative of the usual diet. The predetermined number of food items in the FFQ may cause measured intakes to differ from actual intakes. FFQ are limited by recall bias. Food consumption was collected at the household level and we do not have information on who was present during the FFQ administration, which may reduce the accuracy of the information reported. As the HDQI is a household-level indicator, results should not be extrapolated to individuals living in the household, as intra-household food allocation might affect individual-level diet quality. In addition, the use of secondary data did not allow assessment of other healthy living recommendations found in the Salvadorian dietary guidelines (water intake, weight control, processed food consumption). The assessment of ‘processed’ foods is especially important in the context of nutritional transition, due to the high fat and sodium content( Reference Popkin 8 , Reference Bermudez, Hernandez and Mazariegos 46 ). Future research should include dietary assessment tools that collect this information. Another factor to consider is the intake of dietary supplements and micronutrient supplementation for children under 5 years of age and pregnant/lactating women. Although the use of dietary supplementation may not be widespread in the sample included in the present study, future studies in more affluent settings should collect this information.
The strength of the HDQI is that it assesses diet quality in households beyond energy adequacy and variety measures alone, commonly used in developing country settings. The results presented herein contribute to the literature by calling attention to the possibility of both deficiencies and excesses in vulnerable, potentially food-insecure households in countries undergoing epidemiological and nutritional transitions. Consultations with experts resulted in local approval of the HDQI and enthusiasm for possible applications in El Salvador. While the HDQI could be used as a measure of adherence to the dietary guidelines, the indicator was constructed as a measure of diet quality informed by the guidelines. Future revisions of the indicator should occur, in conjunction with future revisions of the dietary guidelines, with the potential to include more recommendations addressing the growing rate of diet-related non-communicable chronic diseases. More research is needed to continue testing the HDQI against anthropometric and health indicators. Future research could also explore the application of the HDQI in other regions of Latin America with similar dietary patterns and concerns as those found in El Salvador.
Acknowledgements
Sources of funding: Support for completion of the study was provided by the Regional Program of Food Security in Central America (PRESANCA). Ethics: The research was conducted with the approval of the Tufts University Institutional Review Board. Conflicts of interest: The authors have no conflict of interest from the publication of this research. Authors’ contributions: M.F. developed the indicator, analysed the data and wrote the article, and co-facilitated the expert consultation session; R.F.H. provided statistical analysis and indicator development input; E.M. contributed to the conceptual development of the indicator; P.P.d.F. provided support and co-facilitation during the expert consultation; H.D. supported management of the study data; O.I.B. guided the indicator development and analysis process, and co-facilitated the expert consultation process. All co-authors made substantial contributions to data analysis and interpretation and the writing of the manuscript. Acknowledgements: The authors thank Dr Johanna Dwyer (Senior Scientist, Tufts University USDA Human Nutrition Research Center on Aging) for her feedback on an earlier version of the manuscript.
Appendix
Dietary guidelines for El Salvador: general messages ( Reference Swindale and Ohri-Vachaspati 29 ) (author translation)


