It is now well-recognised that vitamin D deficiency is common worldwide, both among children and adults(Reference Braegger, Campoy and Colomb1,Reference Spiro and Buttriss2) . Vitamin D plays an essential role in mineral and bone homoeostasis by regulating Ca and phosphate metabolism, and its deficiency during childhood is known to cause rickets or osteomalacia. Recent studies have shown that vitamin D deficiency may also cause or be associated with many other conditions affecting children or young adults including asthma, type 1 diabetes, infectious diseases and autism spectrum disorder(Reference Ali, Cui and Pertile3–Reference Holick8). While more research is needed to determine the causal relationship between vitamin D insufficiency and the aforementioned sequelae, these findings imply that maintaining normal vitamin D levels in children may have clinical benefits beyond preventing rickets.
There are two main sources of vitamin D in humans: diet-derived and solar-induced vitamin D. Dietary sources of vitamin D include fatty fish, cod liver, vitamin D-fortified foods and vitamin supplements. UV B radiation from sunlight is absorbed by 7-dehydrocholesterol in the skin, which constitutes the first step in vitamin D formation. Vitamin D synthesis from sunlight accounts for 80–90 % of total vitamin D in adults(Reference Zittermann, Schleithoff and Koerfer5,Reference Holick, Feldman, Pike and Bouillon9) . The vitamin D production process in the skin can be affected by multiple factors, such as skin pigmentation, age, clothing type, sunscreen use, time spent in daylight, season, latitude and cloud cover(Reference Holick, Feldman, Pike and Bouillon9,Reference Elsori and Hammoud10) .
There has been considerable debate regarding whether sunlight exposure should be encouraged for infants to prevent vitamin D deficiency(Reference Holick8,Reference Misra, Pacaud and Petryk11) . While several studies have implied potential beneficial effects of sunlight exposure on vitamin D sufficiency(Reference Jain, Gupta and Kalaivani12–Reference Wall, Grant and Jones14), the American Association of Pediatrics states that sunlight exposure to maintain vitamin D is not recommended for infants younger than 6 months due to the potential harms of excessive sunlight exposure(Reference Balk, Binns and Brumberg15). Ideally, recommendations on sunlight exposure should be tailor-made for each country or region based on race, geography and culture; however Japan has not established guidelines for vitamin D supplementation due – at least in part – to knowledge gap regarding the natural history of vitamin D status among young infants. There have been reports showing seasonality of vitamin D levels in both children and pregnant women in Japan(Reference Ando, Morisaki and Asakura16–Reference Shibata, Suzuki and Sekiya18), suggesting that sun exposure has an influence on vitamin D status during infancy and childhood in this population. Seasonality in vitamin D status among 3- and 4-month-old infants living in northern Japan has also been reported(Reference Tomimoto and Kinjou19). We have recently documented that vitamin D levels do not exhibit seasonality in 1-month-old healthy Japanese infants using liquid chromatography with tandem mass spectrometry (LC-MS/MS)(Reference Hara, Ikeda and Koyama20), but seasonality at 2 months has yet to be addressed. The 2-month mark is of particular interest because many Japanese caregivers often wait until the first well-child visit at 1 month before bringing their infants outside, though this cultural behaviour has never been quantitatively investigated. It also remains unclear whether vitamin D status during early infancy depends on sunlight exposure to the same extent as it does in adults.
In order to address these questions, we retrospectively evaluated the vitamin D status of 1- and 2-month-old Japanese infants born in Saitama City Hospital, Saitama, Japan at 35·9° North latitude.
Methods
Study population and data collection
This retrospective cohort study was conducted in Saitama City Hospital, which lies at a latitude of 35·9° North and is located 25 km North of Tokyo. All study subjects were born at Saitama City Hospital, and blood was drawn for any indication such as suspected jaundice, from those aged 1–2 months between August 2017 and September 2021 at the outpatient clinic for well-baby check-ups. Infants were not eligible if they were supplemented with vitamin D, born at <36 weeks of gestation, had low Apgar scores, were born to a mother treated with medications that are known to affect either Ca or Mg metabolism in the perinatal period, such as magnesium sulphate, or born to a mother with any clinical conditions known affecting Ca metabolism. Demographic, health information and laboratory data, including perinatal history, weight, height, nutrition, amount of formula intake and outdoor activity, were collected from electronic medical records. Infants who were exclusively breastfed were classified into the ‘breastfed group;’ those with mixed regimens or only formula were classified into the ‘mixed-fed group’.
The frequency of outdoor activities was semi-quantitatively analysed using the original scoring system as follows: mothers were questioned regarding the outdoor activities of their infants during their health check-ups at 1 and 2 months of age by the same investigator. The questions were answered on a scale of 0–3 (0 = hardly ever going out, 1 = once a week, 2 = twice a week, 3 = more than twice a week).
Serum 25(OH)D measurement
The total serum circulating 25(OH)D was assessed by chemiluminescence immunoassay using the Liaison® 25 OH Vitamin D Total Assay with Precision and a Liaison® XL Analyzer (DiaSorin Inc.). If the serum 25(OH)D level was below 4·0 ng/ml, which is the lower detection threshold for chemiluminescence immunoassay, the value was converted to 2·0 ng/ml. We adopted serum 25(OH)D levels of <12 ng/ml as the definition of vitamin D deficiency, as has been used elsewhere(Reference David21).
Statistical analysis and justification of sample size
Data are expressed as the median (interquartile range) for all variables, except parity, mode of delivery, sex and an outdoor activity score. Given that the Shapiro–Wilk test showed that the assumption of normality was violated, we performed Kruskal–Wallis tests with Dunn’s post-hoc tests to determine the monthly variation of serum 25(OH)D. Multiple linear regression analysis was performed to assess the association between serum 25(OH)D levels and variables including the daily amount of formula intake, BMI and outdoor activity scores. Patients whose outdoor activity scores were not recorded were excluded from the multiple linear regression analysis. P < 0·05 was considered statistically significant.
In this study, we retrospectively collected as many samples as possible from infants who had phlebotomies for other medical indication. Ex-post minimal detectable effect size for monthly comparison of serum 25(OH)D levels was calculated as follows. The minimal monthly number of 2-month-old patients in this study was recorded as fourteen infants in April; hence, this number was selected for the sample size. In a previous study(Reference Tomimoto and Kinjou19), the maximum monthly standard deviation of serum 25(OH)D during the study period was 7·87 ng/ml in June; therefore, the estimated standard deviation was conservatively set to 8·0 ng/ml. Using the aforementioned sample size and estimated standard deviation and assuming a two-sided 5 % significance level with 80 % statistical power, 8·80 ng/ml was calculated as the minimally detectable effect size to reject the null hypothesis that the mean of 25(OH)D is no different between the two groups with an equal-variance t-test. All analyses were performed using JMP, Version 11.2.0 (SAS Institute Inc.).
Ethical approval
This study was conducted according to the guidelines laid down in the Declaration of Helsinki, and all procedures involving human subjects/patients were approved by the Research Ethics Committee of the Saitama City Hospital (# H29-31). All participants’ caregivers gave written informed consent, and they were given the chance to opt-out.
Results
Description of the study population
As shown in Fig. 1, data on 692 blood samples from 388 infants were available during the study period. Data were available at both 1 and 2 months for 304 infants. Of 378 samples obtained from 1-month-old infants, 178 and 200 were breastfed and mixed-fed, respectively. Of 314 samples obtained from 2-month-old infants, 183 and 131 were breastfed and mixed-fed, respectively. The baseline clinical characteristics and laboratory data of the infants at each age are summarised in Table 1. Among the breastfed infants, 170 of the 178 1-month-old infants and 155 of the 183 2-month-old breast infants demonstrated serum 25(OH)D levels below 12 ng/ml. Among the mixed-fed infants, fifty-four of the 200 1-month-old infants and sixteen of the 131 2-month-old infants demonstrated serum 25(OH)D levels below 12 ng/ml. As shown in Table 2, median BMI values at birth, 1 month and 2 months of age were within the 25th to 75th percentiles, according to the Manual for the Assessment of Growth of Japanese Infants and Children in 2012 from the National Center for Child Health and Development(22).
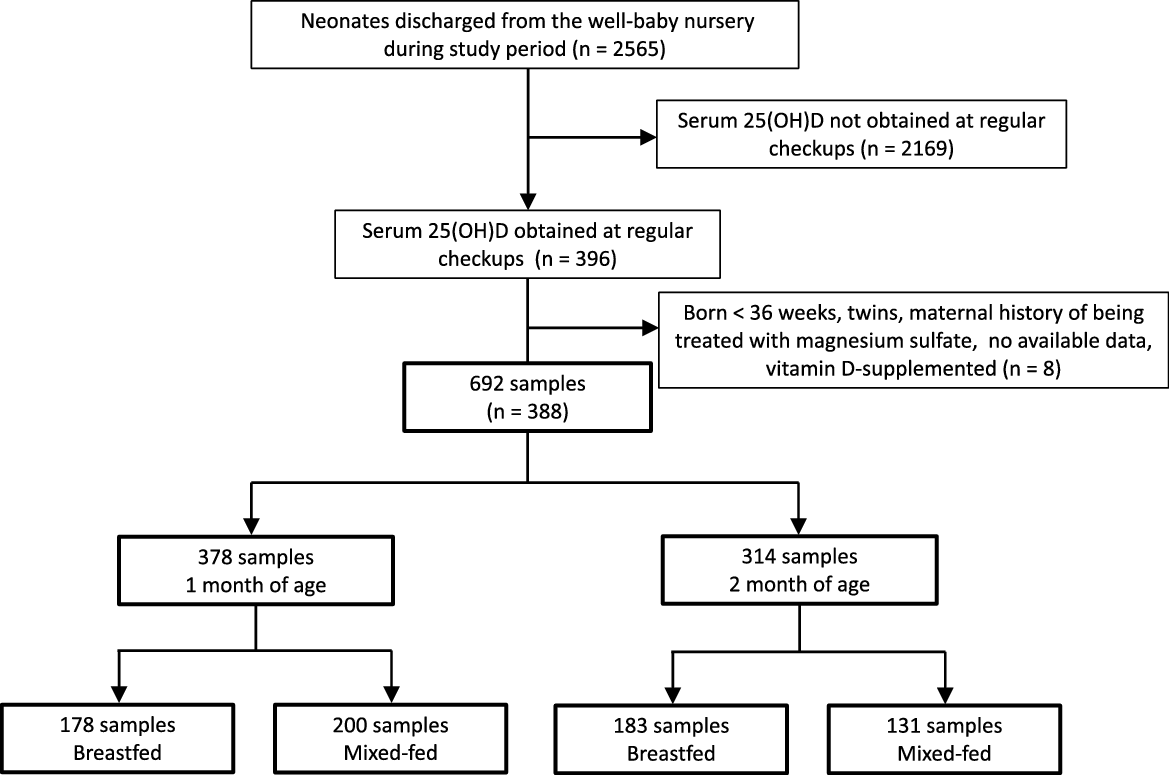
Fig. 1. Flow chart describing patient selection and type of nutrition.
Table 1. The baseline characteristics of the study subjects are categorised according to the month of age and nutritional methods

Table 2. BMI (kg/m2) of study subjects grouped by age and sex
(Median values and interquartile ranges)

Data are presented as median (IQR).
The italic numbers indicate Japanese standards.
Seasonal variation of 25(OH)D concentrations
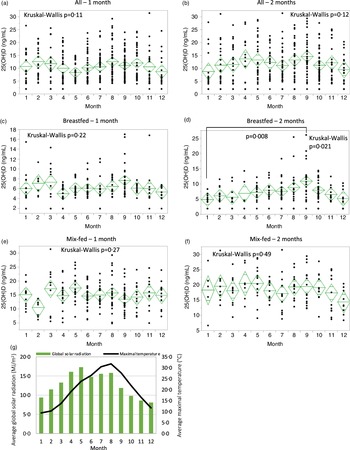
The monthly distribution of serum 25(OH)D concentrations in all infants at 1 or 2 months of age did not show significant variation (Fig. 2(a)–(b)). Significant monthly variations in 25(OH)D concentrations were detected in the breastfed group at 2 months with maximal and minimal levels in September and January, respectively, whereas the breastfed group at 1 month and the mixed-fed group at both 1 and 2 months did not show any significant variation (Fig. 2(c)–(f)). Analysis of publicly available meteorological data from 1991 to 2020 revealed that monthly averages of global solar radiation (MJ/m2) in the Tokyo area(23) and the maximal temperatures in Saitama city(24) were highest in May and August, respectively (Fig. 2(g)).

Fig. 2. Monthly distribution of serum 25(OH)D levels throughout the year. All infants at 1 (a) and 2 months of age (b), breastfed infants at 1 (c) and 2 months of age (d), mixed-fed infants at 1 (e) and 2 months of age (f). The line bisecting the diamond indicates the mean value, and the upper and lower vertices signify the 95 % CI. Kruskal–Wallis test was used to compare the overall means, and Dunn’s post-hoc test was used to compare the means from month to month. P < 0·05 was considered statistically significant. (g) Monthly averages of global solar radiation (MJ/m2) in the Tokyo area and maximal temperature (°C) in Saitama city from 1991 to 2020.
Frequency of outdoor activities
As shown in Table 1, an outdoor activity score of 0 was most common at 1 month (83·9 %) and a score of 3 was most common at 2 months (81·2 %), respectively.
A significant relative contribution of formula intake to serum 25(OH)D
In order to assess the relative contribution of formula intake and outdoor activity to the vitamin D status of participants, we performed a multiple linear regression analysis. BMI was also included in the analysis, as its negative correlation with vitamin D status in children has been reported(Reference Zakharova, Klimov and Kuryaninova25). As shown in Table 3, the analysis revealed the amount of formula intake to be a significant positive predictor of serum 25(OH)D levels in both 1- (t = 17·96, standardised β = 0·68, P < 0·0001) and 2-month-old (t = 16·30, standardised β = 0·70, P < 0·0001) infants. BMI was also found to be significantly correlated with decreased 25(OH)D levels only in 1 month-old infants (t = -2·55, standardised β = -0·10, P = 0·01). The outdoor activity scores in both 1- and 2-month-old infants showed no significant contribution to 25(OH)D levels. Similar results were obtained using the same analysis for male and female subgroups, with the exception that the BMI of 1-month-old female infants was not significantly associated with 25(OH)D levels (Table 3).
Table 3. Multiple linear regression model predicting serum 25(OH)D concentration for each month
(95 % confidence intervals and standard errors)

* The number of cases is lower than that in Table 1 due to missing values.
Squared multiple correlation coefficient (R 2) = 0·47, P < 0·0001 for 1-month-old all infants, R 2 = 0·47, P < 0·0001 for 1-month-old male infants, R 2 = 0·47, P < 0·0001 for 1-month-old female infants, R 2 = 0·48, P < 0·0001 for 2-month-old all infants, R 2 = 0·47, P < 0·0001 for 2-month-old male infants and R 2 = 0·47, P < 0·0001 for 2-month-old female infants.
R 2 was adjusted for the df.
Discussion
Although seasonal variability of vitamin D status in children has been reported in multiple different regions, the relationship between seasons and vitamin D status during early infancy has been poorly investigated, especially among East-Asian populations(Reference Jain, Gupta and Kalaivani12–Reference Wall, Grant and Jones14). Furthermore, little is known about the influence of both dietary and non-dietary factors on infantile vitamin D status. Here, we addressed those knowledge gaps in healthy Japanese infants aged 1 and 2 months in Saitama city (35·9° N latitude) by retrospectively analysing their serum 25(OH)D levels, outdoor activities and nutrition. Our data revealed that seasonal variation in serum 25(OH)D levels of breastfed infants manifests at 2 months, aligning with increased frequency of outdoor activities. We also found a significant correlation between formula intake and serum 25(OH)D concentrations. These data provide new insights into how multiple factors influence vitamin D status during early infancy.
To our knowledge, this study comprises the first evidence to support seasonal variation in 25(OH)D levels of breastfed newborns as early as 2 months in any East Asian population. Notably, the emergence of vitamin D seasonality at 2 months coincided with a significant increase in outdoor activity scores, suggesting that elevated 25(OH)D levels might be related to sunlight exposure. While Hara et al. have reported the seasonal variation in maternal serum 25(OH)D levels in Japanese postpartum women(Reference Hara, Ikeda and Koyama26), the 25(OH)D from mothers has a half-life of 2–3 weeks in the blood(Reference Cooper, Curtis, Moon and Feldman27). Therefore, serum 25(OH)D levels in 1- and 2-month-old infants in this study are thought to be unaffected by maternal 25(OH)D supply through the umbilical cord. Our data on outdoor activity seemingly reflect a Japanese traditional practice in which caregivers tend to wait until their children’s first well-child visit, which is normally at 1 month of age, before taking them outside. Interestingly, the highest 25(OH)D level in our participants was found in September, not in May or August, when global solar radiation and temperature were at their highest. It is possible that the intense August heat in Saitama city may dissuade caregivers from taking their infants outside. While increased vitamin D levels have been observed in many regions typically during the summer season(Reference Jain, Gupta and Kalaivani12,Reference Wall, Grant and Jones14,Reference Davies, Bates and Cole28,Reference Kasahara, Singh and Noymer29) , there have been a few exceptions among certain regions and populations. For example, limited 25(OH)D seasonality has been observed in Arab women living in Israel who wear long garments that cover a large surface of the skin and who engage in fewer outdoor activities due to cultural and religious norms(Reference Saliba, Rennert and Kershenbaum30). Furthermore, in Saudi Arabia, lower vitamin D levels have been reported during the summer, implying that excessively high solar radiation and temperature preclude people from getting enough sunlight exposure(Reference Saadi, Nagelkerke and Benedict31). Taken together, our results provide additional evidence suggesting that geographical and cultural factors could influence infants and their caregivers’ behaviour and, as a result, their vitamin D status.
While breastfed infants showed seasonal 25(OH)D variation at 2 months, no significant seasonal 25(OH)D variation was seen among all participants at either 1 or 2 months. This result led us to further investigate how much formula intake, outdoor activity and BMI contribute to serum 25(OH)D levels. We used multiple linear regression analysis to analyse the relative contributions of both sunlight exposure and formula intake to the vitamin D status of infants. The analysis revealed that the amount of formula intake contributed the most to serum 25(OH)D levels at both 1 and 2 months. Considering that 25(OH)D concentrations in breast milk from Japanese women have been reported to be 1/50 of those in commercially available standard formula in Japan(Reference Tsugawa, Nishino and Kuwabara32), our results suggest that dietary 25(OH)D intake is the most important predictor of serum 25(OH)D levels, with sunlight exposure having a minor impact at 1 and 2 months. Interestingly, there was also a significant but less robust correlation between BMI and serum 25(OH)D levels at 1 month. While the negative correlation between BMI and serum 25(OH)D levels has previously been reported in adults and adolescents, data in young children, especially those who are younger than 1 year old, have been limited(Reference Zakharova, Klimov and Kuryaninova25,Reference Lagunova, Porojnicu and Lindberg33,Reference Strucińska, Rowicka and Dyląg34) . Our findings unexpectedly provide novel evidence suggesting that a negative correlation between BMI and serum 25(OH)D also exists in infants. It is unclear why such a correlation was not identified in our 2-month-old group, and further investigation is needed.
This study has several limitations. First, because this was a single-centre study, our findings do not necessarily apply to all Japanese infants. Second, participants in our study had a clinical indication for taking a blood sample, which may have led to selection bias. Third, our semi-quantitative analysis for outdoor activities may not accurately reflect the degree of sunlight exposure. Fourth, the minimal sample size per month was not large enough to detect the minimal clinically significant effect size of serum 25(OH)D, which is 8 ng/ml based on the literature(Reference David21). Lastly, since we lack data on serum 25(OH)D levels among mothers and the umbilical cord, we could not analyse the correlation between mother and child. Therefore, we cannot exclude the possibility that the seasonal variation in 25(OH)D of 2-month-old breastfed infants was the result of higher 25(OH)D levels in breast milk due to maternal sun exposure.
In summary, we retrospectively assessed serum 25(OH)D seasonality in breastfed Japanese infants starting at 2 months, when caregivers start to take their infants outside more frequently than at 1 month, suggesting that the vitamin D status of young infants is influenced by sunlight exposure. Nonetheless, our result that formula intake contributes the most to serum 25(OH)D levels in all infants suggests that vitamin D status during the first 2 months after birth is heavily attributable to diet. Such data add to our understanding of the link between dietary and non-dietary factors and vitamin D status during early infancy in the East-Asian population and may aid in the development of better vitamin D management strategies for infants.
Acknowledgements
The authors express our deepest gratitude to Dr Tomonobu Hasegawa, a professor in the Department of Pediatrics, Keio University School of Medicine, Tokyo, Japan for his excellent instruction, and Dr Masashi Mikami from Division of Biostatistics, Department of Data Science, Clinical Research Center, National Center for Child Health and Development, Tokyo, Japan, for his expert advice on the statistical analysis and minimal detectable effect size calculation of this study. The authors also acknowledge Cyrus Ghaznavi for constructive comments on the manuscript.
This research received no specific grant from any funding agency, commercial or not-for-profit sectors.
K. T. analysed data and wrote the manuscript. T. A. and K. H.-I. participated in the data analysis and writing of the manuscript. K. I. is responsible for study design and data collection and participated in the writing of the manuscript. All authors have read and approved the final manuscript.
The authors declare no conflicts of interest associated with this manuscript.