Hostname: page-component-586b7cd67f-rcrh6 Total loading time: 0 Render date: 2024-11-26T15:00:35.095Z Has data issue: false hasContentIssue false

Wettability effect on displacement in disordered media under preferential flow conditions

Published online by Cambridge University Press:  17 November 2023
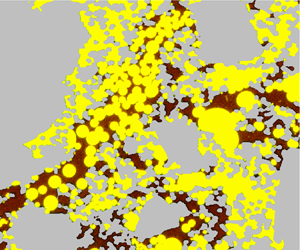
Wenhai Lei
Affiliation:
Department of Engineering Mechanics, Tsinghua University, Beijing 100084, China
Wenbo Gong
Affiliation:
Department of Engineering Mechanics, Tsinghua University, Beijing 100084, China
Moran Wang*
Affiliation:
Department of Engineering Mechanics, Tsinghua University, Beijing 100084, China
*
Email address for correspondence: [email protected]

Abstract

Preferential flow in a porous medium is commonly encountered in many practical applications. Our previous studies have discovered the preferential flow-induced non-monotonic wettability effect on displacement (J. Fluid Mech, vol. 942, 2022a, R5), but whether this non-monotonic rule is consistent for different disordered media and the impact of the interplay between the disorder and wettability under preferential flow conditions is still not well understood. Here, we combine microfluidic experiments, pore-scale simulations and theoretical analysis to study the impact of the disorder on the invading process where wettability varies from strongly water wet to strongly oil wet. Even though the strongly disordered matrix varies to a uniform state, the generality of the preferential flow-induced non-monotonic wettability effect is still proved. However, the previous pore-scale dynamics based on the strongly disordered matrix cannot explain the invading behaviour in the uniform matrix under preferential flow conditions. New mechanisms for the uniform matrix are further investigated by pore-scale modelling, which indicates that the balance of microscopic imbibition ability and the macroscopic interfacial stability dominate the invading process. We derive a theoretical model to describe the wettability effect and predict the optimal contact angle, which fits well with experimental and simulation results. Our work extends the understanding of the impact of preferential flow conditions on the wettability effect and is also of practical significance for engineering applications, such as geological CO2 sequestration, enhanced hydrocarbon recovery, soil wetting, liquid-infused material fabrication and microfluidic device design.

Type
JFM Papers
Copyright
© Tsinghua University, 2023. Published by Cambridge University Press

1. Introduction

Flow heterogeneity is ubiquitous in multiphase displacements in porous media because fluid prefers to flow through where the resistance is lowest. This uneven flow usually refers to preferential flow as a ‘winner-takes-all’ phenomenon (Xie et al. Reference Xie, Lei, Balhoff, Wang and Chen2021). The frequent occurrence of this phenomenon has drawn extensive research attention due to its importance in numerous natural and industrial processes, such as microfluidic logic control (Cybulski, Garstecki & Grzybowski Reference Cybulski, Garstecki and Grzybowski2019), liquid-infused material fabrication (Yasuga et al. Reference Yasuga2021), biomedical research (Sackmann, Fulton & Beebe Reference Sackmann, Fulton and Beebe2014), geological CO2 sequestration (Huppert & Neufeld Reference Huppert and Neufeld2014), enhanced hydrocarbon recovery (Blunt Reference Blunt2017) and remediation of contaminated groundwater sources (Pak et al. Reference Pak, Fernando de Lima Luz, Tosco, Costa, Rosa and Archilha2020). During multiphase displacement in these engineered porous media, the preferential flow pathway (PFP) will be formed spontaneously due to heterogeneous porous structures or point-to-point injection methods, where invading fluid skirts around the defending phase-bearing matrix region so that these regions are trapped (Lei et al. Reference Lei, Lu, Wu, Yang and Wang2022b). Wettability, characterized by the contact angle between the fluid–fluid interface and solid architecture, also has a prominent role in the fluid dynamics and displacement efficiency in porous media. Under the hydrophilic condition, water tends to fill smaller pores or spread along the channel corners to trap the non-wetting fluids (Zheng et al. Reference Zheng, Lei, Ju and Wang2021), otherwise, water will burst into the pores to occupy the pore space from its centre under the hydrophobic condition (Edery, Berg & Weitz Reference Edery, Berg and Weitz2018). Both wettability and preferential flow conditions have a profound influence on the fluid dynamics, flow patterns and displacement efficiency, therefore, it is crucial to understand the wettability effect on multiphase flow in a porous medium under preferential flow conditions, which is the theme of this paper.

To reveal the wettability effect on multiphase displacement at the pore scale, an enormous number of experimental, theoretical and numerical studies have been conducted and are still ongoing (Cieplak & Robbins Reference Cieplak and Robbins1988, Reference Cieplak and Robbins1990; Holtzman & Segre Reference Holtzman and Segre2015; Trojer, Szulczewski & Juanes Reference Trojer, Szulczewski and Juanes2015; Jung et al. Reference Jung, Brinkmann, Seemann, Hiller, Sanchez de la Lama and Herminghaus2016; Zhao, Macminn & Juanes Reference Zhao, Macminn and Juanes2016; Hu et al. Reference Hu, Wan, Kim and Tokunaga2017, Reference Hu, Lan, Wei and Chen2019; Primkulov et al. Reference Primkulov, Talman, Khaleghi, Rangriz Shokri, Chalaturnyk, Zhao, Macminn and Juanes2018, Reference Primkulov, Pahlavan, Fu, Zhao, Macminn and Juanes2019, Reference Primkulov, Pahlavan, Fu, Zhao, Macminn and Juanes2021; Lei et al. Reference Lei, Lu, Liu and Wang2022a). Customarily, for mechanism studies at the pore scale, without losing generality, the displacement efficiency is quantified as the displacing fluid saturation at the final steady state to characterize the displacement process. Microfluidic experiments or pore-scale numerical simulations provide us with convenient tools to observe multiphase flow dynamics and reveal displacement mechanisms (Singh et al. Reference Singh, Jung, Brinkmann and Seemann2019). However, whether the effect of wettability on displacement efficiency is monotonic (Cieplak & Robbins Reference Cieplak and Robbins1988, Reference Cieplak and Robbins1990; Holtzman & Segre Reference Holtzman and Segre2015; Jung et al. Reference Jung, Brinkmann, Seemann, Hiller, Sanchez de la Lama and Herminghaus2016; Singh et al. Reference Singh, Scholl, Brinkmann, Michiel, Scheel, Herminghaus and Seemann2017) or non-monotonic (Trojer et al. Reference Trojer, Szulczewski and Juanes2015; Zhao et al. Reference Zhao, Macminn and Juanes2016; Primkulov et al. Reference Primkulov, Talman, Khaleghi, Rangriz Shokri, Chalaturnyk, Zhao, Macminn and Juanes2018, Reference Primkulov, Pahlavan, Fu, Zhao, Macminn and Juanes2019, 2021; Lei et al. Reference Lei, Lu, Liu and Wang2022a) is still controversial.

In their pioneering pore-scale work, Cieplak & Robbins (Reference Cieplak and Robbins1988, Reference Cieplak and Robbins1990) classified the local meniscus motion into three types: burst, touch and overlap modes. They found that, as the affinity between the invading fluid and the solid got stronger, the meniscus motion would change from burst to overlap mode to stabilize the displacement front up to a critical wetting condition. Holtzman & Segre (Reference Holtzman and Segre2015) also found that a decreased contact angle makes the invasion pattern more compact by cooperative pore filling. Later, some studies on the effect of structural disorder and its coupling with wettability were conducted through microfluidic experiments and pore-scale simulation (Holtzman Reference Holtzman2016; Hu et al. Reference Hu, Lan, Wei and Chen2019; Wang et al. Reference Wang, Chauhan, Pereira and Gan2019). These works provide a basic understanding of matrix flows in porous media such that a smaller contact angle of invading phase, or a more uniform structure, can make the displacement pattern more stable. However, the non-monotonic wettability effect on displacement was also observed by experiments and numerical simulations recently. By changing the fluid properties (viscously unfavourable fluid–fluid displacement, viscosity ratio M = 1:360) and injecting from the microfluidic disk centre, Zhao et al. (Reference Zhao, Macminn and Juanes2016) achieved a non-monotonic wettability rule on a regular structure with vertical posts in microfluidic chips. These experimental observations of displacement patterns can also be reflected by the modified network models where the best displacement generally corresponded to the cooperative pore-filling mode (Primkulov et al. Reference Primkulov, Talman, Khaleghi, Rangriz Shokri, Chalaturnyk, Zhao, Macminn and Juanes2018, Reference Primkulov, Pahlavan, Fu, Zhao, Macminn and Juanes2019, Reference Primkulov, Pahlavan, Fu, Zhao, Macminn and Juanes2021).

Seeking to provide a possible explanation of the abovementioned contradiction about the monotonic or non-monotonic wettability effect in the pore-scale studies, our previous studies found that the preferential flow condition may be an important factor resulting in the non-monotonic wettability effect (Lei et al. Reference Lei, Lu, Liu and Wang2022a). The pore-scale mechanisms about the formation of this non-monotonic wettability effect were identified so that cooperative pore filling under weakly water-wet conditions yields the best displacement, while corner flow under strongly water-wet conditions and Haines events under strongly oil-wet conditions decrease the displacement efficiency. However, these investigations are based on strongly disordered media, whether this non-monotonic wettability effect and corresponding pore-scale fluid dynamics can be extended to different disordered media remains unclear. Therefore, the influence of the interplay of the topological disorder of matrix structures and the wettability on multiphase displacement under preferential flow conditions needs to be further investigated.

To examine the generality of the preferential flow-induced non-monotonic wettability effect and provide a more comprehensive understanding of the coupling effect of the wettability and geometric disorder of the matrix structure on multiphase displacement processes under preferential flow conditions, we conducted visualization experiments on microfluidic chips under a wide range of contact angles $\theta $ ($23^\circ \le \theta \le 127^\circ $). The preferential flow condition is realized by designing a microfluidic chip with an artificial PFP together with a parallel matrix porous structure. Three different disordered matrix structures were designed based on a random generation algorithm to realize different pore-size distributions. A series of microfluidic experiments were performed under preferential flow conditions, compared with piston-type flooding on pure matrix structures. The mechanisms were analysed by microfluidic experiments, pore-scale simulations and theoretical analyses. Our results demonstrate that the preferential flow condition can induce a robust non-monotonic wettability effect on displacement efficiency, while the pore-scale mechanism leading to this non-monotonic wettability effect is different for the different disorders of the matrix structure. It originates from different microscale physics, such as the competition between sweeping ability and carrying ability in the strongly disordered matrix region and the balance between microscopic imbibition ability at the pore scale and interfacial stability of macroscopic patterns in the uniform matrix region. Our findings provide insights into ways of controlling the wettability effect by preferential flow conditions and provide design principles for multiphase flow in engineered porous media such as fabrics, paper, membranes, microfluidic devices and exchange columns concerning their desired immiscible displacement behaviour.

2. Materials and methods

2.1. Experimental section

2.1.1. Design and fabrication of microfluidic chips

In this work, we would like to use a microfluidic chip with a PFP (PFP-type microfluidic chips) and compare the multiphase displacement with that on a matrix porous structure (Matrix Structure, MS-type microfluidic chips) (figure 1). To consider the generality of the non-monotonic wettability effect proposed by Lei et al. (Reference Lei, Lu, Liu and Wang2022a), three different disordered matrix structures with obviously different pore-size distributions were designed using the regeneration method (Wang & Pan Reference Wang and Pan2008; Lei et al. Reference Lei, Liu, Xie, Yang, Wu and Wang2020). According to the dimensionless deviation of the pore-size distribution by the mean pore size, we define the disorder degree as $\sigma = \sqrt {{\sum [{{({d_i} - \bar{d})}^2}{\delta _i}]} } /\bar{d}$, where ${d_i}$ is the ith pore hydraulic diameter, ${\delta _i}$ is the pore volume ratio, $\bar{d}$ is the mean pore hydraulic diameter. Here, $1/{d_i} = 1/{w_i} + 1/h$, where ${w_i}$ is the ith pore width and h is the depth of microfluidic chips. These three generated structures present strongly disordered ($\sigma = 0.28$) (figure 1a1–a3), weakly disordered ($\sigma = 0.25$) (figure 1b1–b3) and uniform ($\sigma = 0.22$) (figure 1c1–c3) matrix structures. It is worth noting that the strongly disordered matrix structures (figure 1a1–a3) of PFP-type and MS-type are the same as our previous work (Lei et al. Reference Lei, Lu, Liu and Wang2022a).

Figure 1. Different microfluidic chip patterns with different disordered matrix structures. (a1–a3) Strongly disordered matrix structures, (b1–b3) weakly disordered matrix structures and (c1–c3) uniform matrix structures in PFP-type and MS-type microfluidic chips and their corresponding pore-size distributions.

The inlet and outlet are along the PFP region to realize a large amount of invading phase through a small fraction of the pore space as in nature and the displacement is driven by shear or capillary forces under preferential flow. The porosities of these matrix structures are $\phi = 0.45$, which are the same as the PFP region, while the permeability ratio between the PFP region and matrix region is larger than 10:1 calculated by three-dimensional (3-D) lattice Boltzmann simulations (Xie, Lei & Wang Reference Xie, Lei and Wang2018). The particle packing structure was chosen as the PFP region to lead to a PFP actively and enhance the repeatability of experiments. The pore volume (PV) of the PFP region is 0.15 μl and the matrix region is 0.84 μl. The length and width of the matrix region are 8 and 6 mm, respectively. The width of the PFP region is 1.08 mm. The typical geometry information is shown in figure 1(a1), and the depths of all microfluidic chips are set as 40 μm. The buffer layers in the inlet and outlet are designed to reduce the end effect (Unsal et al. Reference Unsal, Mason, Morrow and Ruth2009).

After the design patterns were created, they were imported into AutoCAD using LISP (list procession language). Due to the small pore structures and complex porous geometries, the microfluidic chips were fabricated with silicon material. Then the porous structure was made from a silicon wafer using micro-fabrication techniques, including standard photolithography and inductively coupled plasma-deep reactive ion etching (Lei, Lu & Wang Reference Lei, Lu and Wang2023). After the porous pattern was etched to the target depth on the silicon wafer, the wafer was then heated to 1000 $^{\circ}{\rm C}$ under oxygen to create a uniform $0.1\,{\rm \mu}{\rm m} $ silicon dioxide layer on the etched pore channels. The patterned silicon-based chip was then anodically bonded to the 0.5 mm thick Pyrex plate (Schott, German) and diced to form a microfluidic chip. A detailed description of the manufacture of microfluidic chips is given by Chomsurin & Werth (Reference Chomsurin and Werth2003). Finally, before experiments, the microfluidic chips were cleaned with 50 PV standard cleaning solution SC-1 (70 vol.% deionized water, 15 vol.% ammonium hydroxide, 15 vol.% hydrogen peroxide) and 50 PV deionized water sequentially (Grate et al. Reference Grate, Warner, Pittman, Dehoff, Wietsma, Zhang and Oostrom2013). Based on the characterization of the fabrication roughness by atomic force microscope, the surface of microfluidic pore space is smooth that the root mean square roughness (RRMS) is 1.4 nm, average roughness (RA) is 1.2 nm and peak-to-valley roughness (Rt) is 8.2 nm, therefore, the microchannels can be considered to have smooth walls.

2.1.2. Alternation of fluid wettability and characterization

In microfluidic experiments, the intrinsic wettability of invading fluid/defending fluid/solid system was controlled by adjusting the invading fluid property for the same defending fluid and solid. The defending phase is fluorescent dyed oil (decane) with 100 ppm Nile Red and the corresponding dynamic viscosity is 0.84 mPa s. A large number of fluids were tested to achieve a wide range of wettability for the same solid material. Finally, five fluids were selected due to their substantial impacts on the contact angle θ, but weak impacts on viscosity μ, interfacial tension $\gamma $, etc. A detailed formulation of these invading fluids has been described in our previous work (Lei et al. Reference Lei, Lu, Liu and Wang2022a). The wettability variation from strongly oil wet to weakly water wet can be realized by the surfactant solution (Sulfobetaine 12, S12; Macklin). Nano-emulsion with surfactant (NES) is a new solution synthesized in our laboratory by 10 vol.% Span, 5 vol.% Tween, 60 vol.% mineral oil and 25 vol.% deionized water, which can be combined with S12 to realize moderately and strongly water-wet conditions.

The intrinsic contact angle was characterized as system wettability. Firstly, the silicon wafer was ultrasonically cleaned with acetone, ethanol and deionized water for five minutes sequentially. Then, the dried silicon wafer was soaked in a decane-filled reservoir for 24 h. Finally, a small droplet of invading fluid was set on this silicon wafer in this decane-filled reservoir, and the corresponding contact angle was measured by the Young–Laplace method for the following 24 h. Contact angle results of different injection fluids versus immersion times are shown in figure 2. Considering the microfluidic experiments’ time, the contact angles measured in 4 h were chosen as the characteristic contact angle θ to represent the system wettability. We can obtain characteristic contact angles varying from $\theta = 23^\circ $ (strongly water wet, 0.2 wt.% S12 + 3 vol.% NES), $\theta = 45^\circ $ (moderately water wet, 0.2 wt.% S12 + 1 vol.% NES), $\theta = 67^\circ $ (weakly water wet, 0.2 wt.% S12), $\theta = 89^\circ $ (neutral condition, 0.1 wt.% S12) to $\theta = 127^\circ $ (strongly oil wet, 0.05 wt.% S12). The viscosity μ of these injection fluids was 1.1–1.2 mPa s measured by our laboratory rheometer (Hakke MarsIII, Thermo Scientific, USA). Interfacial tension $\gamma $ (6.6–15.4 mN m−1) and contact angle θ ($23^\circ \unicode{x2013} 127^\circ $) were measured in our laboratory by a Drop Shape Analyzer (DSA25, Krüss, Germany) using the pendant drop and Young–Laplace fitting method.

Figure 2. Intrinsic contact angles of different invading fluid–defending fluid–solid systems during 24 h. The y-axis error bar is generated from more than 10 measurements in each condition. The experimental temperature is 20 °C and the relative humidity is 57%.

2.1.3. Experimental set-up and procedure

The experimental set-up consists of injection pumps, a fluorescence microscope (Nikon, SMZ18) with a high-speed camera (Nikon, DS-Ri2), microfluidic chips and a computer, as shown in figure 3. The magnification can be adjusted from 0.5X to 13.5X with the view field ranging from 28 mm × 17.62 mm to 1.03 mm × 0.68 mm. The cleaned microfluidic chips were assembled by a homemade fixture and the corresponding displacement process was recorded by the camera through the fluorescence microscope. The microfluidic chip was flooded with nitrogen for 1 h to replace the initial air, and then saturated by the fluorescent dyed oil (100 ppm Nile Red in decane, ${\mu _{oil}} = 0.84\ \textrm{mPa}\ \textrm{s}$) under a higher pressure to dissolve and take away nitrogen. Then, the invading fluids are injected at a constant flow rate to start the displacement experiments. In these displacement systems, the viscous fingering phenomena can be ignored, because the viscosity ratio $M = {\mu _{inv}}/{\mu _{def}} = 1.3\unicode{x2013} 1.4$ is far beyond the condition for viscous fingering ($M < {10^{ - 2}}$) in the classical Lenormand phase diagram (Lenormand, Touboul & Zarcone Reference Lenormand, Touboul and Zarcone1988; Zhang et al. Reference Zhang, Oostrom, Wietsma, Grate and Warner2011; Guo & Aryana Reference Guo and Aryana2019). The dimensionless flow rate is provided by the constant capillary number ($Ca = {\mu _{inv}}{u_i}/\gamma = 2.1 \times {10^{ - 5}}$) (Lenormand et al. Reference Lenormand, Touboul and Zarcone1988; Primkulov et al. Reference Primkulov, Pahlavan, Fu, Zhao, Macminn and Juanes2021), where ${u_i} = LQ/V$ is the characteristic velocity in pores, with the length of the microfluidic chip in the flow direction L, the injection flow rate Q and the PV of the microfluidic chip V. To ensure a stable phase saturation at the final stage (incremental recovery less than 0.1% per 1 PV injection), the total displacing fluid for each experiment should be larger than 200 PVs.

Figure 3. Microfluidic experiment set-up. (a) The experiment platform in our laboratory consists of several pumps, a microscope with a camera, a computer and a microfluidic chip. (b) The corresponding schematic diagram.

2.1.4. Image processing and data analysis

The displacement processes have been quantified through the Image Processing Toolbox of MATLAB. The system is imaged with a high spatial resolution (4908 × 3264). Based on the designed porous structure and macroscopic size of the microfluidic chips (see figure 1), for the PFP-type microfluidic chips, the magnification is set as 1.5X, thus the view field is 9.42 mm × 6.26 mm with 1.92 μm pixel−1; for the MS-type microfluidic chips, the magnification is set as 1.2X, thus the view field is 11.78 mm × 7.83 mm with 2.40 μm pixel−1. The time resolution is chosen as 1 s. Our microscopic system can provide simultaneous multiscale visualization of both the pore-scale fluid physics and the macroscopic displacement patterns. A developed MATLAB program was used for image processing and data analysis. First, the experimental image stacks were filtered by a Gauss filter and converted into a binary form with invading fluid in white and defending fluid in black by using the Otsu method. Considering that only the oil phase can emit fluorescence signals, all binarized images need to be subtracted from the first oil-saturated image to identify the invaded phase at each time. Then, after removing noise the white and black pixel ratio was counted to calculate displacement efficiency. Finally, the evolution of the number and volume fraction of ganglia or clusters were identified to evaluate displacement processes quantitatively.

2.2. Numerical simulation

Pore-network models are intuitive and computationally inexpensive (Fatt Reference Fatt1956; Blunt Reference Blunt2001; Patzek Reference Patzek2001; Joekar Niasar et al. Reference Joekar Niasar, Hassanizadeh, Pyrak-Nolte and Berentsen2009). The porous geometry in the pore-network model is approximated by a pore-throat network, and the flow follows the fully developed Poiseuille flow law. Unlike the quasi-static pore-network model to simulate the equilibrium states, which is controlled by entry capillary pressure only, here, we apply the dynamic pore-network model to consider the effect of the competition between viscous forces and capillary forces on displacement processes under preferential flow conditions. The fundamentals of the dynamic pore-network model are introduced in Appendix A. The relatively low computational cost makes them convenient for exploring the wettability effect on multiphase flow in a complex matrix structure under preferential flow conditions.

3. Results and discussion

3.1. Wettability effects on displacement patterns

A series of displacement experiments have been performed on the microfluidic chips under preferential flow conditions (PFP-type) and compared with matrix structures under piston-type flooding conditions (MS-type) with different disordered matrix structures. Figure 4 shows the representative multiphase distributions of PFP type (figure 4a1–o1) and MS type (figure 4a2–o2) at two different stages, the through and final stages. The wettability ranges from strongly water wet (figures 4a1,f1,k1 and a2,f2,k2), moderately water wet (figures 4b1,g1,l1 and b2,g2,l2), weakly water wet (figures 4c2,h2,m1 and c2,h2,m2), neutral (figures 4d1,i1,n1 and d2,i2,n2) and strongly oil wet (figures 4e1,j1,o1 and e2,j2,o2) conditions. The disorder degree of matrix structures varies from strongly disordered structures (figures 4a1–e1 and a2–e2), and weakly disordered structures (figures 4f1–j1 and f2–j2) to uniform structures (figures 4k1–o1 and k2–o2).

Figure 4. Wettability effects on multiphase distributions on the (a1–o1) PFP-type and (a2–o2) MS-type microfluidic chips. These porous structures contain (a1–e1,a2–e2) strongly disordered, (f1–j1,f2–j2) weakly disordered and (k1–o1,k2–o2) uniform matrix structures. Yellow is the defending fluid (oil), and grey is the solid structure. The black is the invading fluid (water) at the breakthrough stage, and the black plus brown is the invading fluid at the final stage. From left to right, multiphase distributions are obtained under the strongly water-wet, moderately water-wet, weakly water-wet, neutral and strongly oil-wet conditions, respectively.

By comparing the multiphase distributions at the breakthrough and final stage on PFP- and MS-type microfluidic chips, those are significantly dependent on wettability, flow conditions and the disorder of the matrix porous structures. The displacement patterns under preferential flow conditions (PFP type) are quite different from that under matrix flow (MS type), and the classical invasion patterns proposed by Cieplak & Robbins (Reference Cieplak and Robbins1988, Reference Cieplak and Robbins1990). The preferential flow condition and disordered matrix structure can promote different invading modes; for example, increasing the disorder of the matrix structure in PFP-type microfluidic chips makes the invading mode more complex, while this difference in MS-type microfluidic chips is not obvious. The disorder degree and preferential flow conditions will lead to different invading behaviours.

The evolution of the defending phase (oil) saturation S during the flooding can provide quantitative insight into the phase configuration. Figure 5 shows that the defending fluid saturation variation in PFP-type microfluidic chips will continue for a longer time than that in MS-type microfluidic chips. The saturation variation in the PFP-type microfluidic chip is more sensitive to wettability alteration than that for the MS-type microchips. Moreover, the more uniform the matrix structure, the later the drastic change of saturation will occur during the displacement in PFP-type microfluidic chips (figure 5a1–c1). In MS-type microfluidic chips, the saturation variations are nearly constant after breakthrough stages (figure 5a2–c2), and the disorder degree nearly does not affect the saturation variation rule. The disorder degree and preferential flow conditions are responsible for different invading processes.

Figure 5. Wettability effects on defending fluid (oil) saturation evolution in the (a1–c1) PFP-type and (a2–c2) MS-type microfluidic chips. Developments of the defending fluid (oil) saturation with injection fluid PVs where these porous structures contain (a1,a2) strongly disordered, (b1,b2) weakly disordered and (c1,c2) uniform matrix structures.

3.2. Robust non-monotonic wettability effects on displacement efficiency

The invading fluid saturations (${S_{inv}}$) at the breakthrough and final stages are calculated, and the displacement efficiency is defined as the invading fluid saturation at the final stable stage (${E_d} = {S_{inv}}$). As the contact angle decreases, the invading fluid saturation (Sinv) increases monotonically for both PFP-type and MS-type structures at breakthrough stages (figure 6ac), which agrees with the recent results qualitatively in that a stronger water-wet condition leads to a higher ${S_{inv}}$ (Bakhshian et al. Reference Bakhshian, Rabbani, Hosseini and Shokri2020; Wolf, Siebert & Surmas Reference Wolf, Siebert and Surmas2020). However, the maximum displacement efficiency appears at weakly water-wet conditions for all PFP-type microfluidic chips with different disordered matrix structures at the final stages. Here, ${E_d}$ increases on decreasing the contact angle from large values until a critical wetting transition, after which the displacement becomes less efficient (figure 6bf). Such a result elucidates that the preferential flow-induced non-monotonic wettability effect is general, whatever the disorder degree of the matrix structure. In contrast, the displacement efficiency maintains its monotonic dependence on the wettability of the MS-type microfluidic chip, and the displacing process almost completes after the breakthrough. Although these non-monotonic wettability effects are consistent qualitatively, the pore-scale mechanisms are different comparing the phase distribution influenced by the strongly disordered matrix structure and uniform structure, as shown in figure 4.

Figure 6. Wettability effects on displacement efficiency in the PFP- and MS-type microfluidic chips at the breakthrough stage (a,c,e) and final (post-breakthrough) stage (b,d,f). These porous structures contain (a,b) strongly disordered, (c,d) weakly disordered and (e,f) uniform matrix structures. The x-axis error bar is generated from the contact angle measurements and the y-axis error bar is generated from the three repeated displacement experiments in each condition.

For the strongly and weakly disordered matrix structures (figures 4a1–e1 and f1–j1), the pore-scale physics behind this non-monotonic wettability effect on multiphase displacement under preferential flow conditions can still be described by our previous theory (Lei et al. Reference Lei, Lu, Liu and Wang2022a), which is controlled by the sweeping ability (figure 7a) and carrying ability (figure 7c) of the invading fluid. The largest cluster of the defending phase at the final stage can be used to evaluate the sweeping ability, which represents the residual phase not swept by the invading fluid, while the isolated ganglia (droplets and columns) of defending phase can be used to evaluate the carrying ability, which represents the defending fluid detached from the solid structures by the invading fluid but not produced. For PFP-type microfluidic chips with disordered matrix structures, decreasing the contact angle will lead to a stronger sweeping ability (lower volume fraction of the largest cluster) (figure 8a), but will also reduce the carrying ability (higher volume fraction of isolated ganglia) (figure 8c). Therefore, in the strongly disordered matrix region of the PFP-type geometries, the synergistic balance between the sweeping ability and carrying ability of the invading fluid leads to the highest displacement efficiency. In contrast, there is a monotonic wettability effect observed in the MS-type microfluidic chips, the sweeping ability and carrying ability for this piston-type injection design are at nearly the same low level for all wettability conditions (figure 7a,c).

Figure 7. Topology analysis of the largest cluster and isolated ganglia of the defending phase. The volume fraction of the largest cluster in the whole pore space of matrix region in PFP-type and MS-type microfluidic chips with (a) strongly disordered and (b) uniform matrix structures. The volume fraction of isolated ganglia in the whole pore space of matrix region in PFP-type and MS-type microfluidic chips with (a) strongly disordered and (b) uniform matrix structure.

Figure 8. Invading fluid morphology under different wettability conditions in (ae) PFP- and (fj) MS-type microfluidic chips with a strongly disordered matrix structure. These patterns correspond to the final stage of the experiments. Black is the connected invading phase and blue is the disconnected invading phase. The volume fraction of connected and disconnected invading phases present different variation trends with wettability conditions in (k) PFP-type and (l) MS-type microfluidic chips. (m) Enlarged image of red box in (a) about the formation and trapping process of disconnected invading phase and defending phase droplets in the transport channel. Yellow is the defending fluid and grey is the solid structure. The brown is the invading fluid.

Figure 8 gives a clearer explanation of carrying ability by the topology analysis of invading phase for PFP-type microfluidic chips with a strongly disordered matrix structure. A stronger water-wet condition will cause the invading phase to transfer to disconnected invading pathways with isolated defending phases trapped in the deep matrix region (figure 8ae). It is a non-monotonic trend of volume fraction of connected invading phase in PFP-type microfluidic chips (figure 7k), while it is nearly constant for MS-type microfluidic chips (figure 7l) with nearly the same invading patterns (figure 7fj). The snap-off phenomena will occur frequently in the strongly water-wet condition, which limits connected invading pathways. Isolated ganglia and a disconnected invading phase pathway will suppress the invading process in the deep matrix region by the Jamin effect (figure 8a,m). The Jamin effect is defined as the flow resistance produced by the droplet deformation during two-phase flow through a pore-throat channel, which is a phenomenon originating from the difference of capillary pressure between two sides of the trapped droplet (Green & Willhite Reference Green and Willhite1998). Therefore, stronger water-wet conditions will decrease the carrying ability conversely for PFP-type microfluidic chips with strongly disordered matrix structures.

For PFP-type microfluidic chips with uniform matrix structures (figure 4k1–o1), although the non-monotonic wettability effect is still valid under preferential flow conditions, it is obvious that the previous theory proposed by Lei et al. (Reference Lei, Lu, Liu and Wang2022a) is no longer applicable (figure 4). For PFP-type microfluidic chips, decreasing contact angle affects sweeping ability non-monotonically (figure 7b), and the carrying abilities are nearly the same without corner flow-induced snap-off phenomena in the matrix structures (figure 7d). There is no suppression effect of the carrying capacity under strongly water-wet conditions due to the small size ratio of the pore and throat (Cha et al. Reference Cha, Xie, Feng and Balhoff2021). The geometry condition for the snap-off criterion in the rectangular channel can be derived as $(1/{w_p} + 1/d) - (1 - \tan \,\theta )/\min ({w_t},d) < 0$, where ${w_p}$ and ${w_t}$ are the width of the pore and throat, respectively, and d is the depth of the microfluidic chip. When ${w_t} > d$, the geometry condition can be described as $1/{w_p} + \textrm{tan}\,\theta /d < 0$, which is impossible for snap-off. When ${w_t} < d$, the geometry condition can be described as $1 - \textrm{tan}\,\theta - k > {w_t}/d$, where $k = {w_t}/{w_p}$. The more uniform structure and thus larger k will make the geometric condition more difficult to achieve for snap-off. Therefore, the apparently non-monotonic trend of sweeping ability is directly responsible for the non-monotonic wettability effect in PFP-type microfluidic chips with uniform matrix structures.

Figure 9 presents the sweeping area and edge variation in different wettability conditions for PFP-type microfluidic chips with a uniform matrix structure. As the contact angle decreases, its microscopic imbibition ability becomes stronger, which is reflected in the deeper imbibition at the inlet position. However, we found that when the contact angle is smaller than the critical point (figure 7b), as the contact angle decreases, the trapping area near the exit position becomes larger, which is reflected in the sweeping edge variation (figure 9f), and under strongly water-wet conditions, it quickly imbibes into the deep matrix area and traps a large cluster (figure 9a). However, the pore-scale mechanism of the balance of the microscopic imbibition ability and macroscopic sweeping interface variation are still not clear; we should provide new insight into the underlying mechanism to elucidate this effect for the uniform matrix structures under preferential flow conditions.

Figure 9. Sweeping ability variation with contact angles in PFP-type microfluidic porous media with a uniform matrix structure. (ae) The largest cluster and sweeping edge curves under different wettability conditions. (f) Comparison of sweeping edge curves under strongly water-wet (25°), weakly water-wet (67°) and strongly oil-wet (127°) conditions.

3.3 Pore-scale mechanisms for the uniform matrix under preferential flow conditions

3.3.1. Pore-network numerical simulations

To provide an improved understanding of the pore-scale mechanisms of PFP-type geometries with a uniform matrix structure, we simulated the dynamics of two-phase flow in these PFP-type geometries by dynamic pore-network models. The geometry set-up of this problem along with the boundary conditions and fluid properties are the same as the abovementioned microfluidic experiments, as shown in figure 4(k1–o1). We use a relative integer value of contact angle to explore the wettability effect on the trend of displacement efficiency (contact angle = 15°, 30°, 60°, 88°, 120°). However, it needs to be pointed out that the neutral condition (contact angle = 90°) is a huge challenge for the pore-network model, so we choose contact angle = 88°. Figure 10 presents the displacement processes, and the corresponding quantitative results of defending phase (oil) saturation evolution, invading phase saturation at the breakthrough stage and displacement efficiency at the final stage. The numerical simulation exhibits the experimentally observed invasion patterns, saturation evolution rule and topology results (figure 10). The wettability has a great influence on the multiphase flow pattern and fluid saturation (figure 10f), and it shows a monotonic wettability effect at the breakthrough stage (figure 10g) but a non-monotonic wettability rule at the final stage (figure 10h). The topology analysis of the numerical simulation results also showed similar trends to the experiments, that is, the largest cluster showed a non-monotonic law (figure 10i), while the volume fraction of isolated oil droplets was small and almost constant (figure 10j). It is worth noting that the simulated flow area at strongly oil-wet conditions is smaller than the experimental results, as shown in figure 4(o1) and figure 10(e). This may arise from the fact that the wettability in the experiments exhibits not only the intrinsic contact angle but also its contact angle may vary with time during the invading process, as shown in figure 2. Its dynamic contact angles may also have an impact on the pore-scale invading pathway in this situation (Al-Futaisi & Patzek Reference Al-Futaisi and Patzek2003; Valvatne & Blunt Reference Valvatne and Blunt2004). Moreover, the fabrication roughness on the channel wall may also lead to the wetting transition effect (Wang, Pereira & Gan Reference Wang, Pereira and Gan2020). Regardless, the numerical simulation results are qualitatively correct about the wettability effect on the displacement process and displacement efficiency.

Figure 10. Dynamic pore-network simulation results of wettability effect on displacement process in PFP-type microchips with a uniform matrix structure. (ae) Representative invading and defending phase distributions in the PFP-type porous structure under different contact angles. (f) Evolution of the oil saturation with the PVs. Variation in the oil saturation versus the contact angle θ at (g) the breakthrough stage and (h) the final stage. The comparison of volume fraction of (i) largest cluster and (j) isolated ganglia between simulation results and experimental results. (k) Simulation results of sweeping edge curves under strongly water-wet (15°), weakly water-wet (60°) and strongly oil-wet (120°) conditions.

To explore the invading dynamics, the pressure distributions at the breakthrough stage and final stage are analysed based on dynamic pore-scale simulations, as shown in figure 11. Something inspiring can be found in comparisons between each wettability condition. At strongly water-wet conditions, the higher pressure in the matrix region and the largest pressure gradient will be achieved near the inlet point (figure 11a,f), which may result in an unstable invading interface along the PFP direction, as shown in figure 10(a,k). As the contact angle increases, the higher-pressure area can spread along the PFP direction in the matrix region, thus a wider and more stable invading interface can be achieved, as shown in figure 10(c,k). However, as the contact angle is near to or larger than 90°, the pressure is hard to transport into the deep matrix region, as shown in figure 11(d,e) at the breakthrough stage, and figure 11(i,j) at the final stage. It can be concluded that the best displacement is achieved by balancing the microscopic imbibition ability and the macroscopic interfacial stability in the matrix region along the PFP direction. By comparing the pressure distribution at both the breakthrough stage and the final stage, it can be found that weakly water-wet conditions can present a more stable and wide high-pressure area, meanwhile these high pressure can be transported into the deep matrix region to displace defending fluid effectively. It can also be presented by the variation of sweeping edge curves, as in the experimental results in figure 9(f) and figure 10(k).

Figure 11. Pore-network simulation results of the evolution of the corresponding pressure distribution of uniform matrix structures under preferential flow conditions at (ae) the breakthrough stage and (fj) the final stage.

3.3.2. A mathematical model for the optimal contact angle

A mathematical model of fluid-invading processes was developed to better understand the pore-scale mechanism of the wettability effect and explain the results of microfluidic experiments and simulations in PFP-type microfluidic chips with a uniform matrix structure. Figure 12 presents the physical model for analysing the invading behaviour in the uniform matrix structure under preferential flow conditions.

Figure 12. Physical model of invading process in uniform matrix structure under preferential flow conditions. The PFP region is modelled by a series of horizontal capillary tubes. The matrix region is modelled by a series of vertical capillary tubes.

Customarily for the mechanism study without losing generality, we make the following assumptions to achieve a simplified but useful model: (i) the matrix region is modelled by a series of capillaries in the y-direction with a radius equal to the average pore radius of the matrix region R, their length being the same as the matrix height H, which means invading behaviour in the y-direction dominates the displacement and is ignored in the x-axis. (ii) These capillary tubes in the matrix region are divided into three zones, including defending phase outflow near the outlet (zone I), invading fluid displacing defending fluid in the middle part (zone II) and invading phase inflow near the inlet but touching the bottom of the matrix region (zone III). (iii) The PFP region is modelled by a series of capillaries in the x-direction with a radius equal to the average pore radius of the PFP region RPFP, and their length is the same as the PFP length L, which means invading behaviour in the x-direction dominates the displacement and it is ignored in the y-axis. (iv) The flow through the capillary tubes is a steady laminar flow and the two-phase interface advances with a constant mean curvature. (v) The fluid pressure at the matrix bottom remains invariant along the direction parallel to the PFP. (vi) The viscosity ratio of invading and defending fluid is 1. (vii) According to the fabrication of microfluidic chips and experimental procedures, the wettability of the entire flow field is homogeneous, and mixed wettability is ignored. (viii) Capillary end effect can be ignored reasonably based on the microfluidic chip design and experimental results.

Based on the above assumptions, the mathematical expression for fluid invasion behaviour can be derived from mass balance and the force balance between the capillary pressure difference and the viscous pressure drop.

Before the breakthrough stage, the invading length l in the matrix region is smaller than the matrix region height H, only zone I and zone II exist, as shown in figure 12. The invading length l varies monotonically with the contact angle $\theta $, that is, the smaller the contact angle, the deeper the invasion, as shown in (3.1)

(3.1)\begin{equation}\begin{array}{*{20}{c}} {l = \dfrac{{{k_2}}}{{\mu H}}\left( {{\mu_{inv}}/{k_1}UL + 2\gamma \ \textrm{cos}\,\theta \left( {\dfrac{1}{R} - \dfrac{1}{{{R_{PFP}}}}} \right)} \right)\dfrac{L}{U}} \end{array},\end{equation}

where the fluid pressure in the PFP region at a horizontal distance x away from the outlet is described as ${P_{PFP}}(x) = {\mu _{inv}}/{k_1}Ux + {P_0} - {P_{c\_PFP}}\;\; (0 \le x \le L)$, where ${\mu _{inv}}$ is the invading phase viscosity, and ${P_{c\_PFP}} = 2\gamma \ \textrm{cos}\,\theta /{R_{PFP}}$ stands for the capillary pressure difference owing to the immiscible interface curvature in the PFP region, where ${R_{PFP}}$ is the average pore radius in the PFP region. Here, ${P_c} = 2\gamma \ \textrm{cos}\,\theta /R$ stands for the capillary pressure difference in the matrix region, where R is the average pore radius in the matrix region. The fluid pressure at the outlet is ${P_0}$. The defending phase (oil) pressure of the capillary tube end is ${P_b}$, before the breakthrough stage, ${P_b} = {P_0}$. The invading phase is injected into the PFP with a fixed velocity U. The length and permeability of the PFP region are L, k 1, respectively and ${k_2}$ is the absolute permeability of the capillary tube.

After the breakthrough, invading fluid flows into the matrix region through zones II and III, and defending fluid flows out from the matrix region through zone I. When the invading phase touches the bottom side of the matrix pore structure (zone III), the driving force will vanish and finish the imbibition process in zone III. When ${L_2} = L$, the invading phase could not touch the matrix bottom, and the fluid–fluid interface remains to invade the deeper matrix region. The immiscible fluids will reach a force balance between the viscous pressure drop and capillary force under the condition ${L_2} = {L_1}$, and there is no extra driving force for the defending fluid to break through the blockade of the invading phase in the PFP. Hence, the PV of the matrix part completely occupied by invading phase reaches the maximum displacement efficiency. The corresponding balanced capillary pressure at the matrix region could be derived as

(3.2)\begin{equation}\begin{array}{*{20}{c}} {{P_c} = \dfrac{{2\gamma \ \textrm{cos}\,\theta }}{R} = \dfrac{{\mu UL}}{{2{k_1}}}} \end{array}. \end{equation}

Therefore the optimal contact angle can be derived by the mathematic model as

(3.3)\begin{equation}\begin{array}{*{20}{c}} {\theta = \textrm{acrcos}\left( {\dfrac{{\mu ULR}}{{4\gamma {k_1}}}} \right)} \end{array}. \end{equation}

The detailed derivation is presented in Appendix B. The optimal contact angle can be determined by the injection flow rate U, invading fluid viscosity $\mu $, interfacial tension $\gamma $, the permeability ${k_1}$ and length L of the PFP region and the average pore radius R of the matrix region. To realize the non-monotonic wettability rule, R as the parameter for the matrix region should be smaller than the critical average pore radius of the matrix region ${R^\ast }$ when the preferential flow condition and injection conditions are determined

(3.4)\begin{equation}\begin{array}{*{20}{c}} {R \le {R^\ast } = \dfrac{{4\gamma {k_1}}}{{\mu UL}}} \end{array}.\end{equation}

To validate these derived mathematic models, the parameters are chosen as follows μ = 1.1 mPa s, U = 0.0017 m s−1, L = 8 mm, γ = 11 mN m−1, k 1 = 20.33 × 10−12 m2, R = 18 μm according to our experiments and simulation conditions. It is a non-monotonic wettability rule due to $R = 18\ {\rm \mu}\mathrm{m} < {R^\ast } = 61\ {\rm \mu}\mathrm{m}$, and the optimal contact angle is predicted as $\theta = 73^\circ $, which is consistent with the experimental and simulation results that weakly water-wet conditions can result in the highest displacement efficiency. The mathematical model also proved that the non-monotonic wettability effect in a uniform matrix structure under preferential flow conditions originates from the balance between the imbibition ability in the single capillary channel and the invading region ratio during the invading process.

3.4. Implications and discussion

Preferential flow condition is commonly encountered during multiphase flow in natural and industrial porous structures. Our previous work based on microfluidic chips with strongly disordered matrix structures has discovered that the preferential flow condition can influence the wettability effect on invading fluid patterns and the highest displacement efficiency can be achieved at weakly water-wet conditions (Lei et al. Reference Lei, Lu, Liu and Wang2022a). However, whether this non-monotonic rule is consistent for different disordered media and the impact of the interplay between the disorder and wettability under preferential flow conditions is still not well understood. In this paper, we further explored the effect of the disorder of the matrix structure on the above-mentioned non-monotonic wettability effect and found that the non-monotonic wettability effect on displacement efficiency is universal, whatever the disorder degree of the matrix structure. Unlike the previous theory (Lei et al. Reference Lei, Lu, Liu and Wang2022a) proposed for strongly disordered matrix structures, a novel pore-scale mechanism is proposed for the uniform matrix structure that the invading processes are dominated by the balance of imbibition ability at pore scale and flow interface stability in the matrix region along the PFP direction, which is proved by microfluidic experiments, pore-scale simulations and theoretical analysis.

However, it should be noted that the permeability ratio of the PFP region and matrix region is one of the most important factors to form preferential flow conditions, which is the prerequisite for the non-monotonic wettability effect. In this study, the permeability ratio of the PFP region and matrix region is larger than 10:1, thus the preferential flow conditions can be satisfied (Lei et al. Reference Lei, Lu, Liu and Wang2022a), however, if the permeability ratio is small, such as less than approximately 3:1, this non-monotonic wettability effect caused by preferential flow conditions may shift. Moreover, this work ignored the viscous instability due to the viscosity ratio being close to 1, but the viscosity mismatch level can also influence the critical wettability conditions (Zhao et al. Reference Zhao, Macminn and Juanes2016; Gu, Liu & Wu Reference Gu, Liu and Wu2021). When viscous instability occurs, all viscous-related calculations must be re-derived.

Moreover, the model presented here is for microfluidic porous media, so the modifications of those models should be introduced for some macroscopic engineering applications. For example, some natural or engineering porous materials such as rocks and soils often exhibit heterogeneous wettability, which plays an important role in the wettability dependency of displacement efficiency (Garfi et al. Reference Garfi, John, Rücker, Lin, Spurin, Berg and Krevor2022). Different spatial distributions of contact angle can even lead to opposite wettability trends (Foroughi et al. Reference Foroughi, Bijeljic, Lin, Raeini and Blunt2020). The wettability effect will be more complex if there is a significant hysteresis between advancing and receding contact angles in real rough porous structures (Lin et al. Reference Lin, Bijeljic, Berg, Pini, Blunt and Krevor2019; Sun et al. Reference Sun, Mcclure, Mostaghimi, Herring, Berg and Armstrong2020). Except for the direct application of microfluidic devices or similar porous media, some engineered porous media with strong space heterogeneity or complex topological connectivity in the third dimension may also influence this wettability effect (Lin et al. Reference Lin, Bijeljic, Berg, Pini, Blunt and Krevor2019; Singh et al. Reference Singh, Regenauer-Lieb, Walsh, Armstrong, Van Griethuysen and Mostaghimi2020). For example, these 3-D structural features will affect the film flow and the occurrence of snap-off under ultra-small Ca (capillary) (Gauglitz & Radke Reference Gauglitz and Radke1986), the breakup of invading and defending fluids may be reduced in the 3-D structure due to the enhanced connectivity and tortuosity of the pore space (Krummel et al. Reference Krummel, Datta, Münster and Weitz2013). However, limited by the fabrication methods, inherent geometric confinement in the depth direction and topological connectivity, microfluidic chips with uniform depth are not able to capture the physics associated with the porous connection in the third dimension (Anbari et al. Reference Anbari, Chien, Datta, Deng, Weitz and Fan2018; Lei et al. Reference Lei, Lu and Wang2023). All those problems should be analysed in future work.

Regardless, the conclusion that the preferential flow-induced non-monotonic wettability effect on displacement in porous media is extended to various disordered media. It could provide a new modelling paradigm for multiphase flow in disordered media, such as microfluidic devices, paper or textiles, underground aquifers, hydrocarbon reservoirs and the deep stratum for CO2 storage hydrocarbon reservoirs, in which the interplay between wettability and preferential flow conditions plays a role.

4. Conclusions

We study the wettability effect on the multiphase displacement in porous media with different disordered matrix structures under preferential flow conditions; meanwhile, the piston-type flooding at the same matrix structures is compared to emphasize the importance of preferential flow conditions. By combining microfluidic experiments and pore-scale simulations with theoretical analysis, our research results indicate that the preferential flow-induced non-monotonic wettability effect on displacement efficiency is general, whatever the disorder degree of matrix structures, but pore-scale mechanisms for explaining the formation of the non-monotonic wettability effect are different for a strongly disordered matrix structure and uniform matrix structures. For the strongly disordered matrix structure, our previous theory (Lei et al. Reference Lei, Lu, Liu and Wang2022a) is still valid: the competition of sweeping ability and carrying ability of the invading fluid dominates the displacement processes and results in the non-monotonic wettability effect. However, for the uniform disordered matrix structure, the current study elucidates that the balance of imbibition ability at the pore scale and the interfacial stability of macroscopic patterns along the preferential flow direction plays an important role and achieves optimal wettability at weakly water-wet conditions.

Through theoretical analysis of the displacement process in a uniform matrix structure under preferential flow conditions and comparison between the simulation and experimental results, we propose a theoretical model to describe the invading process and this non-monotonic wettability effect. The theoretical model can predict not only the rule of the wettability effect on displacement efficiencies, such as the monotonic rule at the breakthrough stage but the non-monotonic rule at the final stage, but also the value of optimal contact angle, which can be determined by the injection flow rate, invading fluid viscosity, interfacial tension and the geometries of the PFP region and the matrix region. Our findings provide new insights that preferential flow conditions can result in a non-monotonic wettability effect on displacement efficiency and different disordered matrix structures may lead to different microscale physics and macroscopic consequences of multiphase flow.

Funding

This work is financially supported by the NSF grant of China (No. 12272207) and the National Key Research and Development Program of China (No. 2019YFA0708704).

Declaration of interests

The authors report no conflict of interest.

Appendix A. Fundamentals of dynamic pore-network models

In our dynamic pore-network simulations, the pore geometry in the microfluidic chips is assumed to be a hexahedron with a square cross-section, and the following formulations are given for the invading process in the regular cross-section. The whole pore network is composed of a pore body with a void volume and a pore throat with channel resistance. To achieve the multiphase distribution and the pressure field evolution, we use the two-pressure algorithm in a dynamic pore-network model, where a pore body is filled with two fluids, and each fluid is assumed to have its pressure $P_i^\alpha $ ($\alpha = w$ for the wetting phase, $\alpha = n$ for the non-wetting phase, in pore body i), the local capillary pressure is defined as (Thompson Reference Thompson2002)

(A1)\begin{equation}\begin{array}{*{20}{c}} {P_i^c = P_i^n - P_i^w = f(S_i^w),\; } \end{array}\end{equation}

where $P_i^n$ and $P_i^w$ are the local pressures for the non-wetting and wetting phases, respectively, $S_i^w$ is the wetting phase saturation in the pore body i. A flow flux $Q_{ij}^\alpha $ is assigned in a throat ij for each fluid, where the throat ij is connected to pore i and pore j. The balance of total volumetric flux for pore i requires

(A2)\begin{equation}{\mathop \sum \limits_{j = 1}^{{N_i}} (Q_{ij}^w + Q_{ij}^n) = 0,} \end{equation}

where ${N_i}$ indicates the coordinate number of pore i in the pore system. The volumetric flux in pore throat ij is given by

(A3)\begin{equation}\begin{array}{*{20}{c}} {Q_{ij}^\alpha =- K_{ij}^\alpha (P_i^\alpha - P_j^\alpha )\; } \end{array},\end{equation}

where $K_{ij}^\alpha $ is the throat conductance, a function of geometry and fluid occupancy of pore throat ij. Therefore, the volume balance in a pore body for each fluid can be described as

(A4)\begin{equation}{{V_i}\dfrac{{\Delta S_i^\alpha }}{{\Delta t}} + \sum\limits_{j = 1}^{{N_i}} {Q_{ij}^\alpha = 0} ,}\end{equation}

where $\Delta S_i^\alpha $ is the saturation variation of fluid $\alpha $ in pore body i at a time interval $\Delta t$, ${V_i}$ is the volume of the pore body i.

The entry capillary pressure for each pore throat in the imbibition process is calculated by the nonlinear equations based on the Mayer-Stowe-Princen (MS-P) theory (Mayer & Stowe Reference Mayer and Stowe1965; Princen Reference Princen1969)

(A5)\begin{gather}\begin{array}{*{20}{c}} {{A_n} = ({L_{nw}} + {L_{ns}}\ \textrm{cos}\,\theta )r = \left\{ {\begin{array}{*{20}{@{}ll}} {A - 4{r^2}\left( {\textrm{cos}\,\theta (\textrm{cos}\,\theta - \textrm{sin}\,\theta ) + \theta - \dfrac{{\rm \pi} }{4}} \right)}&{\left( {\theta < \dfrac{{\rm \pi} }{4}} \right)}\\ A&{\left( {\theta \ge \dfrac{{\rm \pi} }{4}} \right)} \end{array},} \right.} \end{array}\end{gather}
(A6)\begin{gather}\begin{array}{*{20}{c}} {{L_{ns}} = \dfrac{R}{{2G}} - 8b} \end{array},\end{gather}
(A7)\begin{gather}\begin{array}{*{20}{c}} {{L_{nw}} = 8r \cdot \arcsin \left( {\dfrac{{\sqrt 2 b}}{{2r}}} \right),} \end{array}\end{gather}
(A8)\begin{gather}\begin{array}{*{20}{c}} {b = r \cdot \max (0,\textrm{cos}\,\theta - \textrm{sin}\,\theta ),} \end{array}\end{gather}

where ${A_n}$ is the cross-sectional area for the non-wetting phase, G and A are the geometry factor and cross-sectional area of a pore throat, ${L_{nw}}$ and ${L_{ns}}$ indicate the length of the immiscible interface and the length of the non-wetting–wall interface, respectively, $\theta $ is the wetting–non-wetting fluid contact angle on the pore wall, r is the curvature radius of the arc-meniscus interface, R is the inscribed radius in each pore throat and b is the meniscus–apex distance along the wall.

The entry capillary pressure for each pore throat in the drainage process is

(A9)\begin{equation}\begin{array}{*{20}{c}} {P_c^{entry} = \left\{ {\begin{array}{*{20}{@{}ll}} {\dfrac{\gamma }{R}\left( {\textrm{cos}\,\theta + \sqrt {\dfrac{{\rm \pi} }{4} - \theta + \textrm{sin}\,\theta \ \textrm{cos}\,\theta } }\ \right)}&{\left( {\theta < \dfrac{{\rm \pi} }{4}} \right),}\\ {\dfrac{{2\gamma \ \textrm{cos}\,\theta }}{R}}&{\left( {\theta \ge \dfrac{{\rm \pi} }{4}}\right).} \end{array}} \right.} \end{array}\end{equation}

There are two interfacial mechanisms for a pore body in our simulations, namely, filling from arc-menisci (AMs) and the main terminal meniscus (MTM). For the MTM filling, it is assumed that the local capillary pressure is the same as the entry capillary pressure in a pore body as the wetting saturation increases until a pre-set value of saturation is reached. Qin & van Brummelen (Reference Qin and Van Brummelen2019) proposed the detained formulation for the MTM filling event

(A10)\begin{equation}\begin{array}{*{20}{c}} {{P_c} = \dfrac{{2\sigma \ \textrm{cos}\,\theta }}{{{R_b}}} \times \left\{ {\begin{array}{*{20}{@{}ll}} 1&{{S_w} < 0.96,}\\ {{{\left( {\dfrac{{{S_w} - 1}}{{1 - 0.96}}} \right)}^4}}&{{S_w} \ge 0.96,} \end{array}} \right.} \end{array}\end{equation}

where ${S_w}$ is the wetting saturation, and ${R_b}$ is the radius of pore body. While this formulation is available for the imbibition process in the pore-network model, the breakthrough of the interfacial blockage for the drainage process is ignored.

Considering that the local capillary pressure in a pore body $2\sigma \ \textrm{cos}\,\theta /{R_b}$ in (A10) is usually less than the entry capillary pressure $2\sigma \ \textrm{cos}\,\theta /{R_t}$ in the connected pore throat, which will stop the drainage process, and inspired by the model proposed by Joekar-Niasar & Majid Hassanizadeh (Reference Joekar-Niasar and Majid Hassanizadeh2011), we proposed a new ${P_c} - {S_w}$ formulation to consider the drainage processes from throats to pores and pores to throats

(A11)\begin{equation}\begin{array}{*{20}{c}} {{P_c} = \dfrac{{2\sigma \ \textrm{cos}\,\theta }}{{{R_{inter}}}},\quad {R_{inter}} = \left\{ {\begin{array}{*{20}{@{}ll}} {\textrm{min}\{ {R_{t,ij}}\} }&{{S_w} < 0.04,}\\ {\textrm{max}\{ {R_{t,ij}}\} }&{0.04 \le {S_w} < 0.1,}\\ {{R_b}}&{0.1 \le {S_w} < 0.96,}\\ {{R_b}{{\left( {\dfrac{{{S_w} - 1}}{{1 - 0.96}}} \right)}^4}}&{{S_w} \ge 0.96,} \end{array}} \right.} \end{array}\end{equation}

where ${R_{t,ij}}$ is radius of throat ij connected to the pore body i which is introduced for the drainage sequence into the throats connected to the pore body i.

For the AM filling, the local capillary pressure is ${P_c} = \gamma /r$, which is a function of the pore geometry and fluid occupancy (Patzek Reference Patzek2001). Owing to the simplified pore geometry, the local capillary pressure is only a function of wetting fluid saturation $f(S_i^w)$.

For the calculation of hydraulic conductance, only the flow resistance in pore throats is taken into account. If a throat is filled by either non-wetting or wetting fluid, its conductance is given by the single-phase conductance

(A12)\begin{equation}\begin{array}{*{20}{c}} {K_{ij}^\alpha = \dfrac{{0.5623G{A^2}}}{{{\mu _\alpha }}},} \end{array}\end{equation}

where ${\mu _\alpha }$ is the fluid viscosity. When non-wetting and wetting fluids are all present, the wetting fluid forms cylindrical filaments along the corners of a throat and is separated from the non-wetting fluid by an arc meniscus. Herein, we use the Patzek–Kristensen scaling to calculate the fluid conductance in a pore throat (Patzek Reference Patzek2001).

To avoid the one-order approximation of the partial differential of the local capillary pressure, we use an automatic differentiation algorithm to implicitly solve the saturation equation, where the local capillary pressure is the function of fluid saturation at the current timestep. In this study, the pressure equation is explicitly solved, where the hydraulic conductance keeps constant during a small-time interval.

Appendix B. Derivation of the mathematic model and the prediction of the optimal contact angle

This section mainly presents the derivation of the mathematic prediction of the rule of wettability on displacement efficiency and the prediction of the optimal contact angle. The physical model for the mathematic derivation is shown in figure 10.

Before the breakthrough stage, the defending phase pressure at the capillary tube end Pb is equal to P0 in the fluid pressure in the PFP region ${P_{PFP}}(x) = {\mu _{inv}}/{k_1}Ux + {P_0} - {P_{c\_PFP}}\;\; (0 \le x \le L)$. We formulate the pressure balance between fluid viscous pressure drop and capillary pressure

(B1)\begin{equation}\begin{array}{*{20}{c}} {{P_b} + \dfrac{{{\mu _{def}}}}{{{k_2}}}u(x)(H - l) - {P_c} + \dfrac{{{\mu _{inv}}}}{{{k_2}}}u(x)l = {P_{PFP}}.} \end{array}\end{equation}

Where ${\mu _{def}}$ is the defending phase viscosity, $u(x)$ is the invading velocity in the capillary tube at distance x, ${k_2}$ is the absolute permeability of the capillary tube and l is the invaded length of invading fluid in the capillary tube. The viscosity ratio ${\mu _{inv}}/{\mu _{def}}$ is approximately 1 in this study, so the viscosity difference between invading and defending fluid can be ignored. Considering the interfacial movement in the PFP region, the initial time for the water imbibition in a capillary tube (matrix region) is ${t_0} = (L - x)/U$. Considering the interfacial movement in the capillary tube of the matrix region, the imbibition velocity in the capillary tube can be described as $u(x) = l/(t - {t_0})$, where t is the time of displacement. Thus we can derive the relationship between l, ${P_c}$ and x from (A1)

(B2)\begin{equation}\begin{array}{*{20}{c}} {l = \dfrac{{{k_2}}}{{\mu H}}({P_{PFP}} - {P_b} + {P_c})\left( {t - \dfrac{{L - x}}{U}} \right).} \end{array}\end{equation}

Combined with the Young–Laplace equation ${P_c} = 2\gamma \ \textrm{cos}\,\theta /R$ and ${P_{c\_PFP}} = 2\gamma \ \textrm{cos}\,\theta / {R_{PFP}}$ and ${P_{PFP}}(x)$, we can get

(B3)\begin{equation}\begin{array}{*{20}{c}} {l = \dfrac{{{k_2}}}{{\mu H}}\left( {{\mu_{inv}}/{k_1}Ux + 2\gamma \ \textrm{cos}\,\theta \left( {\dfrac{1}{R} - \dfrac{1}{{{R_{PFP}}}}} \right)} \right)\left( {t + \dfrac{{x - L}}{U}} \right).} \end{array}\end{equation}

When the main meniscus reaches the outside of the PFP region ($x = L$ and $t = L/U$), we can get

(B4)\begin{equation}\begin{array}{*{20}{c}} {l = \dfrac{{{k_2}}}{{\mu H}}\left( {{\mu_{inv}}/{k_1}UL + 2\gamma \ \textrm{cos}\,\theta \left( {\dfrac{1}{R} - \dfrac{1}{{{R_{PFP}}}}} \right)} \right)\dfrac{L}{U}.} \end{array}\end{equation}

It can be found from (B4) that the invading length l varies monotonically with the contact angle $\theta $, that is, the smaller the contact angle, the deeper the invasion before the breakthrough stage.

After the breakthrough, some invading fluid flows into the matrix region at one side (zones III and II), and some defending fluid flows out from the matrix region at another side (zone I). When the invading phase touches the bottom side of the matrix pore structure in a part of the capillary tubes (zone III), the driving force will decrease owing to the finish of the imbibition process.

We rationalize the invading behaviour by evaluating the characterized invading velocity $u(x)$ at different zones

(B5)\begin{equation}\begin{array}{*{20}{c}} {u(x) = \left\{ {\begin{array}{*{20}{@{}ll}} {\dfrac{{{P_b} - {P_{PFP}} - {P_c}}}{H}\dfrac{{{k_2}}}{\mu }}&{(0 \le x < {L_1}),}\\ {\dfrac{{{P_{PFP}} + {P_c} - {P_b}}}{H}\dfrac{{{k_2}}}{\mu }}&{({L_1} \le x < {L_2}),}\\ {\dfrac{{{P_{PFP}} - {P_b}}}{H}\dfrac{{{k_2}}}{\mu }}&{({L_2} \le x < L).} \end{array}} \right.} \end{array}\end{equation}

The mass conservation for the fluid displacement in the matrix pore structure gives that

(B6)\begin{equation}\int_0^{{L_1}} {u(x)h\,\textrm{d}\kern0.06em x} = \int_{{L_1}}^{{L_2}} {u(x)h\,\textrm{d}\kern0.06em x} + \int_{{L_2}}^L {u(x)h\,\textrm{d}\kern0.06em x} .\end{equation}

We could solve the fluid pressure at the matrix bottom

(B7)\begin{equation}{P_b} = \frac{\mu }{{2{k_1}}}UL + {P_0} + {P_c}\frac{{{L_2}}}{L}.\end{equation}

Thus, the total outflow of defending phase is

(B8)\begin{align} {\int_0^{{L_1}} {u(x)h\,\textrm{d}\kern0.06em x} = \int_0^{{L_1}} {\dfrac{{{P_b} - {P_{PFP}} - {P_c}}}{H}\dfrac{{{k_2}}}{\mu }h\,\textrm{d}\kern0.06em x} = \dfrac{{h{L_1}{k_2}}}{{\mu H}}\left( {\dfrac{{\mu U}}{{2{k_1}}}(L - {L_1}) + \dfrac{{{P_c}}}{L}({L_2} - L)} \right)}.\end{align}

The defending phase will be blocked with the decrease of capillary driving force owing to more invading phase touching the matrix bottom in zone III, and the total outflow of defending phase vanishes. The width of the matrix part completely occupied by invading phase is

(B9)\begin{equation}\begin{array}{*{20}{c}} {{L_{inv}} = L - {L_2} = \dfrac{{\mu UL/{k_1}}}{{2{P_c}}}(L - {L_1}).} \end{array}\end{equation}

When ${L_2} = L$, the invading phase could not touch the matrix bottom, and the invading phase remains invading. The immiscible fluids reach a pressure balance between pressure difference and capillary force under the condition ${L_2} = {L_1}$, and there is no extra driving force to break through the blockade of the water phase in the PFP. Hence, more zone III occurring during the imbibition means the deeper (y-direction) and wider (x-direction) invading area can lead to maximum displacement efficiency. The corresponding capillary pressure at this maximum displacement efficiency could be derived as

(B10)\begin{equation}\begin{array}{*{20}{c}} {{P_c} = \dfrac{{\mu UL}}{{2{k_1}}}.} \end{array}\end{equation}

Combined with the Young–Laplace equation ${P_c} = 2\gamma \ \textrm{cos}\,\theta /R$, the optimal contact angle can be derived as

(B11)\begin{equation}\begin{array}{*{20}{c}} {\theta = \textrm{acrcos}\left( {\dfrac{{\mu ULR}}{{4\gamma {k_1}}}} \right).} \end{array}\end{equation}

References

Al-Futaisi, A. & Patzek, T.W. 2003 Impact of wettability alteration on two-phase flow characteristics of sandstones: a quasi-static description. Water Resour. Res. 39, 1042.CrossRefGoogle Scholar
Anbari, A., Chien, H.T., Datta, S.S., Deng, W., Weitz, D.A. & Fan, J. 2018 Microfluidic model porous media: fabrication and applications. Small 14, 1703575.CrossRefGoogle ScholarPubMed
Bakhshian, S., Rabbani, H.S., Hosseini, S.A. & Shokri, N. 2020 New insights into complex interactions between heterogeneity and wettability influencing two-phase flow in porous media. Geophys. Res. Lett. 47, e2020GL088187.CrossRefGoogle Scholar
Blunt, M.J. 2001 Flow in porous media – pore-network models and multiphase flow. Curr. Opin. Colloid Interface Sci. 6 (3), 197207.CrossRefGoogle Scholar
Blunt, M.J. 2017 Multiphase Flow in Permeable Media: A Pore-Scale Perspective. Cambridge University Press.Google Scholar
Cha, L., Xie, C., Feng, Q. & Balhoff, M. 2021 Geometric criteria for the snap-off of a non-wetting droplet in pore-throat channels with rectangular cross-sections. Water Resour. Res. 57 (7), e2020WR029476.CrossRefGoogle Scholar
Chomsurin, C. & Werth, C.J. 2003 Analysis of pore-scale nonaqueous phase liquid dissolution in etched silicon pore networks. Water Resour. Res. 39 (9), 1265.CrossRefGoogle Scholar
Cieplak, M. & Robbins, M.O. 1988 Dynamical transition in quasistatic fluid invasion in porous media. Phys. Rev. Lett. 60 (20), 20422045.CrossRefGoogle ScholarPubMed
Cieplak, M. & Robbins, M.O. 1990 Influence of contact angle on quasistatic fluid invasion of porous media. Phys. Rev. B 41 (16), 1150811521.CrossRefGoogle ScholarPubMed
Cybulski, O., Garstecki, P. & Grzybowski, B.A. 2019 Oscillating droplet trains in microfluidic networks and their suppression in blood flow. Nat. Phys. 15 (7), 706713.CrossRefGoogle Scholar
Edery, Y., Berg, S. & Weitz, D. 2018 Surfactant variations in porous media localize capillary instabilities during Haines jumps. Phys. Rev. Lett. 120 (2), 028005.CrossRefGoogle ScholarPubMed
Fatt, I. 1956 The network model of porous media. Trans AIME 207 (1), 144181.CrossRefGoogle Scholar
Foroughi, S., Bijeljic, B., Lin, Q., Raeini, A.Q. & Blunt, M.J. 2020 Pore-by-pore modeling, analysis, and prediction of two-phase flow in mixed-wet rocks. Phys. Rev. E 102 (2), 023302.CrossRefGoogle ScholarPubMed
Garfi, G., John, C.M., Rücker, M., Lin, Q., Spurin, C., Berg, S. & Krevor, S. 2022 Determination of the spatial distribution of wetting in the pore networks of rocks. J. Colloid Interface Sci. 613, 786795.CrossRefGoogle ScholarPubMed
Gauglitz, P.A. & Radke, C.J. 1986 The role of wettability in the breakup of liquid films inside constricted capillaries. LBNL Report. LBL-21804. Lawrence Berkeley National Laboratory.Google Scholar
Grate, J.W., Warner, M.G., Pittman, J.W., Dehoff, K.J., Wietsma, T.W., Zhang, C. & Oostrom, M. 2013 Silane modification of glass and silica surfaces to obtain equally oil-wet surfaces in glass-covered silicon micromodel applications. Water Resour. Res. 49 (8), 47244729.CrossRefGoogle Scholar
Green, D.W. & Willhite, G.P. 1998 Enhanced Oil Recovery. SPE Textbook Series, vol. 6. Society of Petroleum Engineers.Google Scholar
Gu, Q., Liu, H. & Wu, L. 2021 Preferential imbibition in a dual-permeability pore network. J. Fluid Mech. 915, A138.CrossRefGoogle Scholar
Guo, F. & Aryana, S.A. 2019 An experimental investigation of flow regimes in imbibition and drainage using a microfluidic platform. Energies 12 (7).Google Scholar
Holtzman, R. 2016 Effects of pore-scale disorder on fluid displacement in partially-wettable porous media. Sci. Rep. 6 (1), 36221.CrossRefGoogle ScholarPubMed
Holtzman, R. & Segre, E. 2015 Wettability stabilizes fluid invasion into porous media via nonlocal, cooperative pore filling. Phys. Rev. Lett. 115 (16), 164501.CrossRefGoogle ScholarPubMed
Hu, R., Lan, T., Wei, G.-J. & Chen, Y.-F. 2019 Phase diagram of quasi-static immiscible displacement in disordered porous media. J. Fluid Mech. 875, 448475.CrossRefGoogle Scholar
Hu, R., Wan, J., Kim, Y. & Tokunaga, T.K. 2017 Wettability impact on supercritical CO2 capillary trapping: pore-scale visualization and quantification. Water Resour. Res. 53 (8), 63776394.CrossRefGoogle Scholar
Huppert, H.E. & Neufeld, J.A. 2014 The fluid mechanics of carbon dioxide sequestration. Annu. Rev. Fluid Mech. 46 (1), 255272.CrossRefGoogle Scholar
Joekar Niasar, V., Hassanizadeh, S.M., Pyrak-Nolte, L.J. & Berentsen, C. 2009 Simulating drainage and imbibition experiments in a high-porosity micromodel using an unstructured pore network model. Water Resour. Res. 45 (2).CrossRefGoogle Scholar
Joekar-Niasar, V. & Majid Hassanizadeh, S. 2011 Effect of fluids properties on non-equilibrium capillarity effects: dynamic pore-network modeling. Intl J. Multiphase Flow 37 (2), 198214.CrossRefGoogle Scholar
Jung, M., Brinkmann, M., Seemann, R., Hiller, T., Sanchez de la Lama, M. & Herminghaus, S. 2016 Wettability controls slow immiscible displacement through local interfacial instabilities. Phys. Rev. Fluids 1 (7), 074202.CrossRefGoogle Scholar
Krummel, A.T., Datta, S.S., Münster, S. & Weitz, D.A. 2013 Visualizing multiphase flow and trapped fluid configurations in a model three-dimensional porous medium. AIChE J. 59 (3), 10221029.CrossRefGoogle Scholar
Lei, W., Liu, T., Xie, C., Yang, H., Wu, T. & Wang, M. 2020 Enhanced oil recovery mechanism and recovery performance of micro-gel particle suspensions by microfluidic experiments. Energy Sci. Eng. 8 (4), 986998.CrossRefGoogle Scholar
Lei, W., Lu, X., Liu, F. & Wang, M. 2022 a Non-monotonic wettability effects on displacement in heterogeneous porous media. J. Fluid Mech. 942, R5.CrossRefGoogle Scholar
Lei, W., Lu, X. & Wang, M. 2023 Multiphase displacement manipulated by micro/nanoparticle suspensions in porous media via microfluidic experiments: From interface science to multiphase flow patterns. Adv. Colloid Interface Sci. 311, 102826.CrossRefGoogle ScholarPubMed
Lei, W., Lu, X., Wu, T., Yang, H. & Wang, M. 2022 b High-performance displacement by microgel-in-oil suspension in heterogeneous porous media: microscale visualization and quantification. J. Colloid Interface Sci 627, 848861.CrossRefGoogle ScholarPubMed
Lenormand, R., Touboul, E. & Zarcone, C. 1988 Numerical models and experiments on immiscible displacements in porous media. J. Fluid Mech. 189 (189), 165187.CrossRefGoogle Scholar
Lin, Q., Bijeljic, B., Berg, S., Pini, R., Blunt, M.J. & Krevor, S. 2019 Minimal surfaces in porous media: Pore-scale imaging of multiphase flow in an altered-wettability Bentheimer sandstone. Phys. Rev. E 99 (6), 063105.CrossRefGoogle Scholar
Mayer, R.P. & Stowe, R.A. 1965 Mercury porosimetry – breakthrough pressure for penetration between packed spheres. J. Colloid Sci. 20 (8), 893911.CrossRefGoogle Scholar
Pak, T., Fernando de Lima Luz, L. Jr., Tosco, T., Costa, G.S.R., Rosa, P.R.R. & Archilha, N.L. 2020 Pore-scale investigation of the use of reactive nanoparticles for in situ remediation of contaminated groundwater source. Proc. Natl Acad. Sci. USA 117 (24), 13366.CrossRefGoogle ScholarPubMed
Patzek, T.W. 2001 Verification of a complete pore network simulator of drainage and imbibition. SPE J. 6 (2), 144156.CrossRefGoogle Scholar
Primkulov, B.K., Pahlavan, A.A., Fu, X., Zhao, B., Macminn, C.W. & Juanes, R. 2019 Signatures of fluid–fluid displacement in porous media: wettability, patterns and pressures. J. Fluid Mech. 875, R4.CrossRefGoogle Scholar
Primkulov, B.K., Pahlavan, A.A., Fu, X., Zhao, B., Macminn, C.W. & Juanes, R. 2021 Wettability and Lenormand's diagram. J. Fluid Mech. 923, A34.CrossRefGoogle Scholar
Primkulov, B.K., Talman, S., Khaleghi, K., Rangriz Shokri, A., Chalaturnyk, R., Zhao, B., Macminn, C.W. & Juanes, R. 2018 Quasistatic fluid-fluid displacement in porous media: invasion-percolation through a wetting transition. Phys. Rev. Fluids 3 (10), 104001.CrossRefGoogle Scholar
Princen, H.M. 1969 Capillary phenomena in assemblies of parallel cylinders. I. Capillary rise between two cylinders. J. Colloid Interface Sci. 30 (1), 6975.CrossRefGoogle Scholar
Qin, C.-Z. & Van Brummelen, H. 2019 A dynamic pore-network model for spontaneous imbibition in porous media. Adv. Water Resour. 133, 103420.CrossRefGoogle Scholar
Sackmann, E.K., Fulton, A.L. & Beebe, D.J. 2014 The present and future role of microfluidics in biomedical research. Nature 507 (7491), 181189.CrossRefGoogle ScholarPubMed
Singh, A., Regenauer-Lieb, K., Walsh, S.D.C., Armstrong, R.T., Van Griethuysen, J.J.M. & Mostaghimi, P. 2020 On representative elementary volumes of grayscale micro-CT images of porous media. Geophys. Res. Lett. 47 (15), e2020GL088594.CrossRefGoogle Scholar
Singh, K., Jung, M., Brinkmann, M. & Seemann, R. 2019 Capillary-dominated fluid displacement in porous media. Annu. Rev. Fluid Mech. 51 (1), 429449.CrossRefGoogle Scholar
Singh, K., Scholl, H., Brinkmann, M., Michiel, M.D., Scheel, M., Herminghaus, S. & Seemann, R. 2017 The role of local instabilities in fluid invasion into permeable media. Sci. Rep. 7 (1), 444.CrossRefGoogle ScholarPubMed
Sun, C., Mcclure, J.E., Mostaghimi, P., Herring, A.L., Berg, S. & Armstrong, R.T. 2020 Probing effective wetting in subsurface systems. Geophys. Res. Lett. 47 (5), e2019GL086151.CrossRefGoogle Scholar
Thompson, K.E. 2002 Pore-scale modeling of fluid transport in disordered fibrous materials. AICHE J. 48 (7), 13691389.CrossRefGoogle Scholar
Trojer, M., Szulczewski, M.L. & Juanes, R. 2015 Stabilizing fluid–fluid displacements in porous media through wettability alteration. Phys. Rev. Appl. 3 (5), 054008.CrossRefGoogle Scholar
Unsal, E., Mason, G., Morrow, N.R. & Ruth, D.W. 2009 Bubble snap-off and capillary-back pressure during counter-current spontaneous imbibition into model pores. Langmuir 25 (6), 33873395.CrossRefGoogle ScholarPubMed
Valvatne, P.H. & Blunt, M.J. 2004 Predictive pore-scale modeling of two-phase flow in mixed wet media. Water Resour. Res. 40, 7.CrossRefGoogle Scholar
Wang, M. & Pan, N. 2008 Predictions of effective physical properties of complex multiphase materials. Mater. Sci. Engng R Rep. 63 (1), 130.CrossRefGoogle Scholar
Wang, Z., Chauhan, K., Pereira, J.-M. & Gan, Y. 2019 Disorder characterization of porous media and its effect on fluid displacement. Phys. Rev. Fluids 4 (3), 034305.CrossRefGoogle Scholar
Wang, Z., Pereira, J.-M. & Gan, Y. 2020 Effect of wetting transition during multiphase displacement in porous media. Langmuir 36 (9), 24492458.CrossRefGoogle ScholarPubMed
Wolf, F.G., Siebert, D.N. & Surmas, R. 2020 Influence of the wettability on the residual fluid saturation for homogeneous and heterogeneous porous systems. Phys. Fluids 32 (5), 052008.CrossRefGoogle Scholar
Xie, C., Lei, W., Balhoff, M.T., Wang, M. & Chen, S. 2021 Self-adaptive preferential flow control using displacing fluid with dispersed polymers in heterogeneous porous media. J. Fluid Mech. 906, A10.CrossRefGoogle Scholar
Xie, C., Lei, W. & Wang, M. 2018 Lattice Boltzmann model for three-phase viscoelastic fluid flow. Phys. Rev. E 97 (2), 023312.CrossRefGoogle ScholarPubMed
Yasuga, H., et al. 2021 Fluid interfacial energy drives the emergence of three-dimensional periodic structures in micropillar scaffolds. Nat. Phys. 17, 794800.CrossRefGoogle Scholar
Zhang, C., Oostrom, M., Wietsma, T.W., Grate, J.W. & Warner, M.G. 2011 Influence of viscous and capillary forces on immiscible fluid displacement: pore-scale experimental study in a water-wet micromodel demonstrating viscous and capillary fingering. Energy Fuels 25 (8), 34933505.CrossRefGoogle Scholar
Zhao, B., Macminn, C.W. & Juanes, R. 2016 Wettability control on multiphase flow in patterned microfluidics. Proc. Natl Acad. Sci. USA 113 (37), 1025110256.CrossRefGoogle ScholarPubMed
Zheng, J., Lei, W., Ju, Y. & Wang, M. 2021 Investigation of spontaneous imbibition behavior in a 3D pore space under reservoir condition by lattice Boltzmann method. J. Geophys. Res. 126 (6), e2021JB021987.CrossRefGoogle Scholar
Figure 0

Figure 1. Different microfluidic chip patterns with different disordered matrix structures. (a1–a3) Strongly disordered matrix structures, (b1–b3) weakly disordered matrix structures and (c1–c3) uniform matrix structures in PFP-type and MS-type microfluidic chips and their corresponding pore-size distributions.

Figure 1

Figure 2. Intrinsic contact angles of different invading fluid–defending fluid–solid systems during 24 h. The y-axis error bar is generated from more than 10 measurements in each condition. The experimental temperature is 20 °C and the relative humidity is 57%.

Figure 2

Figure 3. Microfluidic experiment set-up. (a) The experiment platform in our laboratory consists of several pumps, a microscope with a camera, a computer and a microfluidic chip. (b) The corresponding schematic diagram.

Figure 3

Figure 4. Wettability effects on multiphase distributions on the (a1–o1) PFP-type and (a2–o2) MS-type microfluidic chips. These porous structures contain (a1–e1,a2–e2) strongly disordered, (f1–j1,f2–j2) weakly disordered and (k1–o1,k2–o2) uniform matrix structures. Yellow is the defending fluid (oil), and grey is the solid structure. The black is the invading fluid (water) at the breakthrough stage, and the black plus brown is the invading fluid at the final stage. From left to right, multiphase distributions are obtained under the strongly water-wet, moderately water-wet, weakly water-wet, neutral and strongly oil-wet conditions, respectively.

Figure 4

Figure 5. Wettability effects on defending fluid (oil) saturation evolution in the (a1–c1) PFP-type and (a2–c2) MS-type microfluidic chips. Developments of the defending fluid (oil) saturation with injection fluid PVs where these porous structures contain (a1,a2) strongly disordered, (b1,b2) weakly disordered and (c1,c2) uniform matrix structures.

Figure 5

Figure 6. Wettability effects on displacement efficiency in the PFP- and MS-type microfluidic chips at the breakthrough stage (a,c,e) and final (post-breakthrough) stage (b,d,f). These porous structures contain (a,b) strongly disordered, (c,d) weakly disordered and (e,f) uniform matrix structures. The x-axis error bar is generated from the contact angle measurements and the y-axis error bar is generated from the three repeated displacement experiments in each condition.

Figure 6

Figure 7. Topology analysis of the largest cluster and isolated ganglia of the defending phase. The volume fraction of the largest cluster in the whole pore space of matrix region in PFP-type and MS-type microfluidic chips with (a) strongly disordered and (b) uniform matrix structures. The volume fraction of isolated ganglia in the whole pore space of matrix region in PFP-type and MS-type microfluidic chips with (a) strongly disordered and (b) uniform matrix structure.

Figure 7

Figure 8. Invading fluid morphology under different wettability conditions in (ae) PFP- and (fj) MS-type microfluidic chips with a strongly disordered matrix structure. These patterns correspond to the final stage of the experiments. Black is the connected invading phase and blue is the disconnected invading phase. The volume fraction of connected and disconnected invading phases present different variation trends with wettability conditions in (k) PFP-type and (l) MS-type microfluidic chips. (m) Enlarged image of red box in (a) about the formation and trapping process of disconnected invading phase and defending phase droplets in the transport channel. Yellow is the defending fluid and grey is the solid structure. The brown is the invading fluid.

Figure 8

Figure 9. Sweeping ability variation with contact angles in PFP-type microfluidic porous media with a uniform matrix structure. (ae) The largest cluster and sweeping edge curves under different wettability conditions. (f) Comparison of sweeping edge curves under strongly water-wet (25°), weakly water-wet (67°) and strongly oil-wet (127°) conditions.

Figure 9

Figure 10. Dynamic pore-network simulation results of wettability effect on displacement process in PFP-type microchips with a uniform matrix structure. (ae) Representative invading and defending phase distributions in the PFP-type porous structure under different contact angles. (f) Evolution of the oil saturation with the PVs. Variation in the oil saturation versus the contact angle θ at (g) the breakthrough stage and (h) the final stage. The comparison of volume fraction of (i) largest cluster and (j) isolated ganglia between simulation results and experimental results. (k) Simulation results of sweeping edge curves under strongly water-wet (15°), weakly water-wet (60°) and strongly oil-wet (120°) conditions.

Figure 10

Figure 11. Pore-network simulation results of the evolution of the corresponding pressure distribution of uniform matrix structures under preferential flow conditions at (ae) the breakthrough stage and (fj) the final stage.

Figure 11

Figure 12. Physical model of invading process in uniform matrix structure under preferential flow conditions. The PFP region is modelled by a series of horizontal capillary tubes. The matrix region is modelled by a series of vertical capillary tubes.