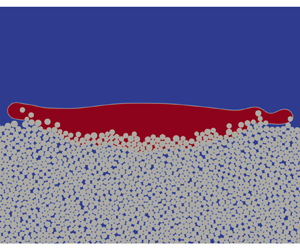
1. Introduction
The dynamic behaviour of multiphase flow in gas–solid–liquid mixture systems plays an important role in various processes in the petroleum industry, biochemical processing, chemical and metallurgical industries, food technology, water treatment and sub-seabed CO$_{2}$ storage (Hu et al. Reference Hu, Jin, Guo and Huang2011; Huppert & Neufeld Reference Huppert and Neufeld2014; Zhao, de Jong & van der Meer Reference Zhao, de Jong and van der Meer2019; Panda et al. Reference Panda, Supriya, Kharaghani, Tsotsas and Surasani2020; Bhaskaran et al. Reference Bhaskaran, Pandey, Surasani, Tsotsas, Vidakovic-Koch and Vorhauer-Huget2022), in addition to being ubiquitous in natural and built environments. Understanding the detailed gas–liquid–solid interactions at play is beneficial to the advancement of these fields. Numerical simulations can give detailed insights into gas–liquid–solid interaction problems by providing time-resolved full-field information. However, for any numerical method, it is challenging to predict the complex dynamics of the liquid–gas interfaces which may move, deform, coalesce, break up and disappear (Li et al. Reference Li, Luo, Kang, He, Chen and Liu2016a). The problem becomes even more complicated if movable solid objects are included, involving multi-particle interactions and contact-line dynamics (Onishi et al. Reference Onishi, Kawasaki, Chen and Ohashi2008; Jiang et al. Reference Jiang, Liu, Chen and Tsuji2022).
Since the surface tensions among different phases and the contact angle at the three-phase boundary are the natural consequence of intermolecular interactions, mesoscopic methods may be suited for considering the interfacial dynamics in multiphase systems (Zhang, Liu & Zhang Reference Zhang, Liu and Zhang2020). The lattice Boltzmann method (LBM), as a mesoscopic method based on the kinetic theory, has been very successful in simulating various complex multiphase flows in the past three decades (Karlin, Ferrante & Öttinger Reference Karlin, Ferrante and Öttinger1999; Guo & Shu Reference Guo and Shu2013; Huang, Sukop & Lu Reference Huang, Sukop and Lu2015; Succi Reference Succi2015, Reference Succi2018). The mesoscale nature of the LBM allows the easy incorporation of interactions among molecules and molecular clusters, while the highly local algorithm of the LBM makes it very efficient in large-scale parallel computations (Li et al. Reference Li, Luo, Kang, He, Chen and Liu2016a). So far, the LBM has been widely used in liquid–gas two-phase flows (Huang et al. Reference Huang, Sukop and Lu2015; Li et al. Reference Li, Luo, Kang, He, Chen and Liu2016a; Gan et al. Reference Gan, Xu, Lai, Li, Sun and Succi2022), water–oil two-component flows (Liu et al. Reference Liu, Kang, Leonardi, Schmieschek, Narváez, Jones, Williams, Valocchi and Harting2016; Chen et al. Reference Chen, He, Zhao, Kang, Li, Carmeliet, Shikazono and Tao2022), liquid–vapour phase-change processes (Li et al. Reference Li, Kang, Francois, He and Luo2015; Fei et al. Reference Fei, Qin, Zhao, Derome and Carmeliet2023; Qin et al. Reference Qin, Fei, Zhao, Kang, Derome and Carmeliet2023) and gas–solid two-phase flows (Peng, Ayala & Wang Reference Peng, Ayala and Wang2019, Reference Peng, Ayala and Wang2020). However, modelling gas–liquid–solid three-phase systems based on the LBM (Zhang et al. Reference Zhang, Liu and Zhang2020; Jiang et al. Reference Jiang, Liu, Chen and Tsuji2022) remains a challenge, as discussed in the following.
First, the fluid–solid interaction forces need to be carefully addressed. At the fluid–solid boundary, a velocity boundary condition (usually the non-slip condition) is imposed, which results in a force applied to the solid phase due to the change of local fluid momentum near the boundary. Such a hydrodynamic force can be treated by different algorithms, mainly the immersed boundary method (Suzuki & Inamuro Reference Suzuki and Inamuro2011), the momentum-exchange method (Ladd Reference Ladd1994a,Reference Laddb) and the stress-integration method (He & Doolen Reference He and Doolen1997; Inamuro, Maeba & Ogino Reference Inamuro, Maeba and Ogino2000). Among them, the momentum-exchange method is widely used, since it is based directly on the distribution functions and the hydrodynamic force is obtained simply by summing the momenta passing through the boundary without any interpolation or extrapolation schemes (Wen et al. Reference Wen, Li, Zhang and Fang2012). Another important force exerted on the solid phase is the capillary force, which originates from the surface tension at the three-phase contact lines. The capillary force is oriented along the liquid–gas interface and thus points away from the solid phase. Capillary force depends, often in a non-trivial way, on many factors, such as wettability conditions and geometry information and its mode of calculation in the LBM depends on the multiphase approach used. For the pseudopotential LBM, Joshi & Sun proposed to obtain the capillary force by adding up the adhesive force contributions along all relevant directions at all liquid–solid boundary nodes (Joshi & Sun Reference Joshi and Sun2009). Other multiphase lattice Boltzmann models may have difficulty in approximating the integral of the surface tension along the perfectly sharp contact line using the information across the diffused interface. For example, Connington, Lee & Morris (Reference Connington, Lee and Morris2015) proposed a capillary force calculation method by introducing an order-parameter-based weight function for the phase-field LBM, which has been recently improved by Zhang et al. (Reference Zhang, Liu and Zhang2020) using an alternative Dirac function. For the perfect wetting scenario, Jiang et al. (Reference Jiang, Liu, Chen and Tsuji2022) proposed a simplified scheme by summing the surface tension contributions at all liquid–solid boundary nodes.
Second, to simulate gas–liquid–solid systems, the gas–liquid two-phase LBM needs to be further coupled with a granular media solver. For single solid body or particle, the particle dynamics could be simply solved based on Newton's law using the aforementioned hydrodynamic force and capillary force as inputs. When two or more solid particles are involved, the interactions among particles must be carefully addressed. The distance between the surface of two particles may reduce such that the number of fluid nodes lying between is insufficient to resolve the lubrication forces, leading to lattice Boltzmann simulations suffering from numerical instability. To eliminate this effect, Kromkamp et al. (Reference Kromkamp, van den Ende, Kandhai, van der Sman and Boom2006) added a lubrication force between each pair of interacting particles suspended in single-phase external fluid. To prevent the breakdown of simulations, a Hookean repulsion force has been introduced in their model when the distance among particle surfaces decreases to extremely small spacing, i.e. $\leq$0.1 lattice spacing. The method has been extended to simulate particle suspensions in gas–liquid two-phase flows by Joshi & Sun (Reference Joshi and Sun2009). Jansen & Harting (Reference Jansen and Harting2011) used a Hertzian contact force to mimic interactions between particles and a lubrication correction to avoid numerical instabilities when the particle distance is smaller than 2/3 of the lattice spacing. Similarly, a repulsive force has been simply applied in the models of Onishi et al. (Reference Onishi, Kawasaki, Chen and Ohashi2008) and Zhang et al. (Reference Zhang, Liu and Zhang2020) based on a Lennard-Jones or other types of potential functions. Note that the above lubrication and/or repulsive forces are introduced with certain simplifications and their cut-off distances are chosen more or less empirically, which may limit the range of application of these models (Onishi et al. Reference Onishi, Kawasaki, Chen and Ohashi2008). To simulate granular assemblies, the discrete element method (DEM) (Cundall & Strack Reference Cundall and Strack1979) has been widely used. In the DEM, a granular system is modelled as an assembly of discrete particles. The particle–particle interaction is evaluated through well-tested contact laws. Recently, coupling algorithms between multiphase LBM and DEM have been proposed to investigate gas–liquid–solid interaction problems. Ding & Xu (Reference Ding and Xu2018) proposed a multiphase fluid–solid coupling algorithm of LBM–DEM to simulate debris flow with a free-surface model, where the flow in the gas phase was neglected. Jiang et al. (Reference Jiang, Liu, Chen and Tsuji2022) developed a coupled colour-gradient LBM–DEM algorithm for simulating the three-phase interaction problem and applied it to study the upward migration of leaked gas bubbles through a brine-filled sediment column. However, in their method, the density ratio of the two fluids is set to unity and the perfect wetting condition is imposed on the solid particle surface.
A third challenge lies in the refilling of the so-called newborn or fresh node. When solid bodies/particles move in a base fluid, their representations on the lattice nodes change at each time step. Namely, some fluid nodes disappear when covered by the solid phase, while some other nodes emerge from the solid region to the fluid domain. The initialization (or refilling) of the newborn or fresh fluid nodes is crucial in three-phase coupling systems, since it markedly affects both numerical accuracy and instability (Lallemand & Luo Reference Lallemand and Luo2003; Li, Jiang & Hu Reference Li, Jiang and Hu2016b). A simple refilling scheme is setting the unknown distribution functions at the newborn fluid nodes to be the equilibrium distributions with approximate density and velocity, as tested by Lallemand & Luo (Reference Lallemand and Luo2003) for simulating suspended rigid particles in single-phase flow. However, the equilibrium distribution only recovers the macroscopic Euler equation without the viscous term, which is inconsistent with the bulk flow where the Navier–Stokes equation is recovered. Lallemand & Luo also considered a second-order extrapolation scheme to reconstruct the unknown distributions and the results were improved compared with the equilibrium scheme, in terms of decreasing the oscillation of the force evaluation. As expected, the oscillation of the force can be further suppressed using a higher-order extrapolation scheme (Wen et al. Reference Wen, Zhang, Tu, Wang and Fang2014). Nevertheless, extrapolation-type refilling schemes are not very suitable in gas–liquid–solid three-phase systems, since the fluid density changes significantly near the liquid–gas interface, and thus extrapolation of distributions often leads to numerical instabilities. Considering that the viscous term is recovered from the non-equilibrium distributions, Caiazzo (Reference Caiazzo2008) proposed a non-equilibrium refilling scheme by simply copying the non-equilibrium part from a neighbour of the newborn fluid node and adding it to the equilibrium part. Such a methodology is quite similar to the non-equilibrium extrapolation scheme by Guo, Zheng & Shi (Reference Guo, Zheng and Shi2002) for velocity and pressure boundary conditions. The non-equilibrium refilling scheme indeed outperformed the equilibrium refilling scheme, in terms of both increasing the order of accuracy and decreasing the numerical oscillation. A more robust but more complicated non-equilibrium refilling scheme has also been proposed by Li et al. (Reference Li, Jiang and Hu2016b). In addition, Jiang et al. (Reference Jiang, Liu, Chen and Tsuji2022) showed that the non-equilibrium refilling scheme is compatible with gas–liquid–solid three-phase systems.
As a final fourth point, the solid phase, e.g. comprised of solid particles, is not only moving in the fluid phase but also has complex boundaries. In many cases, a non-slip condition is assumed at the boundary between fluid and solid phases. The half-way bounce-back scheme has been widely used to deal with such non-slip boundary conditions in the lattice Boltzmann community because it is simple to implement and conserves strictly mass and momentum. In the half-way bounce-back scheme, the equivalent boundary node is located exactly at the middle point in a lattice link between a fluid point and a solid point (Ladd Reference Ladd1994a), which means that a curved solid wall is approximated as a series of stair steps with this treatment. Generally, such an approach is only first-order-accurate for moving boundaries. To treat curved boundaries, Filippova & Hänel (Reference Filippova and Hänel1998) proposed the first curved lattice Boltzmann boundary scheme based on a linear combination of the bounce-back distribution function and a fictitious equilibrium distribution function. It has been improved by Mei, Luo & Shyy (Reference Mei, Luo and Shyy1999) using a different fictitious velocity and combination coefficient. Bouzidi, Firdaouss & Lallemand (Reference Bouzidi, Firdaouss and Lallemand2001) proposed an interpolated (linear interpolation and quadratic interpolation) bounce-back scheme by employing an interpolation of the distribution functions in the interior fluid region. A unified interpolation scheme for curved walls has been developed by Yu, Mei & Shyy (Reference Yu, Mei and Shyy2003b). Originally, all the mentioned curved boundary schemes were developed for single-phase fluid flows. They mostly suffer from violation of mass conservation (Krueger et al. Reference Krueger, Kusumaatmaja, Kuzmin, Shardt, Silva and Viggen2016), owing to the mass imbalance between the outgoing and incoming distribution functions at each boundary node. Recently, some modified mass-conservative curved boundary schemes for two-phase lattice Boltzmann simulations have been proposed (Yu, Li & Wen Reference Yu, Li and Wen2020; Yao et al. Reference Yao, Liu, Zhong and Wen2022), while these schemes have not been tested in three-phase systems with moving solid boundaries.
As reported above, many challenges remain in modelling gas–liquid–solid three-phase systems using the LBM. In this work, we propose to model such problems based on a two-way coupling algorithm using multiphase LBM for the flow field and DEM for the solid grains. More specifically, the single-component pseudopotential LBM originally proposed by Shan & Chen (Reference Shan and Chen1993, Reference Shan and Chen1994) is adopted in the present work, combined with the improved cascaded collision scheme (Fei & Luo Reference Fei and Luo2017) and the mechanical stability condition adjustment scheme (Li, Luo & Li Reference Li, Luo and Li2012, Reference Li, Luo and Li2013) to improve numerical stability and thermodynamic consistency. The rest of the paper is structured as follows. In § 2, the proposed LBM–DEM is described in detail. Validation of the model is given in § 3. Section 4 presents the application of the model to droplet impact on a deformable porous medium at pore scale. Finally, in § 5, we evaluate the proposed model and conclude the paper.
2. Model development
In this section, we give a detailed description of the coupled LBM–DEM model for gas–liquid–solid interaction problems, including the LBM solver for the fluid field and the DEM solver for the particle dynamics, the calculation of various forces and torques exerted on the solid phase and the implementations of contact angle, curved boundary and initialization (or refilling) of newborn fluid nodes. Since the time steps in the LBM and DEM do not need to be identical, we also discuss the unit conversion between the lattice units (used in LBM) and physical units (used in DEM) and the co-evolution scheme between the two solvers.
The fluid field, including the flow in the gas phase and in the liquid phase as well as the dynamics at the gas–liquid interface, is simulated using the pseudopotential LBM (Shan & Chen Reference Shan and Chen1993, Reference Shan and Chen1994). The cascaded LBM (CLBM) with the consistent forcing scheme (Fei & Luo Reference Fei and Luo2017) is used to improve the numerical instability, and the forcing scheme is slightly modified based on the mechanical stability condition adjustment scheme (Li et al. Reference Li, Luo and Li2012, Reference Li, Luo and Li2013) to impose thermodynamic consistency. The hydrodynamic force exerted on the solid phase is calculated by the Galilean invariant momentum exchange method by Wen et al. (Reference Wen, Zhang, Tu, Wang and Fang2014) given its improved accuracy. The capillary force is obtained by adding up the adhesive force contributions (Joshi & Sun Reference Joshi and Sun2009) since it is consistent with the pseudopotential force calculations between gas and liquid phases. The present work is limited to two dimensions.
2.1. Lattice Boltzmann method for gas–liquid two-phase flows
The LBM is a mesoscopic numerical approach based on the simplified kinetic models, which solves a specific discrete Boltzmann equation for the density distribution functions (DDFs) ${f_i}$, designed to reproduce the macroscopic Navier–Stokes equations in the low-Mach-number limit. In the standard LBM algorithm, an iteration of ‘collision and streaming’ is repeatedly executed until convergence (for steady problems) or the target time (for unsteady problems), where the collision step represents the relaxation towards the local equilibrium state due to molecular collisions and streaming represents molecular free streaming afterward. The streaming step is trivial, as it always transports the post-collision DDFs $(\,f_i^*)$ at the present lattice node $(\boldsymbol {x},t)$ to their neighbours along directions of a set of discrete velocities ${\boldsymbol {e}_i}$ within a time step $\Delta t$, i.e.
To execute the next collision step, the equilibrium DDFs $f_i^{eq}$ (or their moment representations) are needed based on the updated hydrodynamic variables (density $\rho$ and velocity $\boldsymbol {u}$):
where ${\boldsymbol {F}}$ is the total force exerted on the fluid.
In the lattice Boltzmann community, various collision schemes, such as the single-relaxation-time scheme (Qian, d'Humières & Lallemand Reference Qian, d'Humières and Lallemand1992), multiple- relaxation-time (MRT) scheme (Lallemand & Luo Reference Lallemand and Luo2000), cascaded or central-moment scheme (Geier, Greiner & Korvink Reference Geier, Greiner and Korvink2006) and the entropic-MRT scheme (Karlin, Bösch & Chikatamarla Reference Karlin, Bösch and Chikatamarla2014), can be employed to suit the problems under investigation. These schemes have been discussed in detail and integrated into a unified framework (Fei & Luo Reference Fei and Luo2017; Fei, Luo & Li Reference Fei, Luo and Li2018). In this work, the cascaded scheme is used as it possesses excellent numerical stability (Geier et al. Reference Geier, Greiner and Korvink2006), while it allows achieving non-slip boundary conditions (Fei & Luo Reference Fei and Luo2017; Fei et al. Reference Fei, Luo and Li2018). In the CLBM, the DDFs are first projected onto the central moment space, then the central moments of different orders are relaxed separately and finally the post-collision DDFs are reconstructed. To make the implementation more efficient, the collision step can be described as follows (Fei & Luo Reference Fei and Luo2017; Fei et al. Reference Fei, Luo and Li2018):
where $f_i^{eq}$ is the equilibrium DDF, $\boldsymbol {M}$ is a transformation matrix, $\boldsymbol {N}$ is a lower triangular shift matrix, $\boldsymbol {I}$ is the unit matrix, $\boldsymbol {S}$ is a (block) diagonal relaxation matrix and ${R_i}$ represents the forcing term in the discrete velocity space. The explicit formulations of $\boldsymbol {M}$, $\boldsymbol {N}$ and their inverses depend on the discrete velocity model and the adopted central moment set. In this work, we use the two-dimensional nine-velocity lattice (Qian et al. Reference Qian, d'Humières and Lallemand1992) with the discrete velocity set:
where $i = 0,1, \ldots,8$, $| {\cdot } \rangle$ denotes a nine-column vector and $\textrm {T}$ denotes the transposition. To construct the CLBM, the raw and central moments of ${f_i}$ are introduced:
where m and n are positive integers. The equilibrium raw and central moments $k_{mn}^{k,eq}$ and $\tilde k_{mn}^{k,eq}$ are defined analogously by replacing ${f_i}$ with their equilibrium counterparts $f_i^{eq}$. Then, one needs to choose an appropriate moment set. The following natural raw moment set is used in the present work:
in which the first three moments represent the component density and momentum, and the middle three and last three stand for the viscous stress and high-order non-hydrodynamic moments, respectively. Such a choice gives very concise and sparse expressions for ${\boldsymbol {M}}$ and ${\boldsymbol {N}}$ according to the relation (Fei & Luo Reference Fei and Luo2017)
The explicit expressions for ${\boldsymbol {M}}$ and ${\boldsymbol {N}}$ are given in Appendix A. In the implementation of (2.3), the explicit formulations of $f_i^{eq}$ and ${R_i}$ and the related matrix calculations are not needed because their central moments can be consistently defined by matching the continuous integration of the Maxwellian distribution (Fei & Luo Reference Fei and Luo2017). More specifically, for the considered moment set in (2.6), we have
To mimic the interaction between the liquid phase and gas phase, the pseudopotential- based interaction force model (Shan & Chen Reference Shan and Chen1993, Reference Shan and Chen1994), which has been successfully applied to various complex multiphase flows (Li et al. Reference Li, Luo, Kang, He, Chen and Liu2016a), is adopted:
where $w$ is the weight with ${w_{1 - 4}} = 1/3$ and ${w_{5 - 8}} = 1/12$, and $\psi ({\boldsymbol {x}})$ is the pseudopotential function. The square-root form pseudopotential $\psi = \sqrt {2({\,p_{EOS}} - \rho c_s^2)/G{c^2}}$ is used (Yuan & Schaefer Reference Yuan and Schaefer2006), which incorporates the non-ideal equation of state (EOS) ${p_{EOS}}$ into the system. For such a choice, the interaction strength is fixed to be $G = - 1$, and $c = 1$ and ${c_s} = \sqrt {1/3}$ are the lattice speed and sound speed, respectively. In the present work, Peng–Robinson non-ideal gas EOS is used (Peng & Robinson Reference Peng and Robinson1976):
where $\varphi (T) = {[1 + (0.37464 + 1.54226\varpi - 0.26992{\varpi ^2})(1 - \sqrt {T/{T_c}} )]^2}$, and we set the gas constant $\bar R = 1$ and the acentric factor $\varpi = 0.344$. The critical pressure ${p_c}$ and temperature ${T_c}$ are determined by $a = 0.4572{R^2}T_c^2/{p_c}$ and $b = 0.0778R{T_c}/{p_c}$. Unless specified, in the present work, the saturation temperature is set as ${T_{sat}} = T/{T_{cr}} = 0.775$, and $a = 1/40$ and $b = 2/21$ are chosen, which leads to a density ratio ${\rho _l}/{\rho _g} = 7.452/0.147 \approx 50$ and interface thickness $W \approx 5\Delta x$.
When such a square-root-form pseudopotential is used, the system suffers from the so-called thermodynamic inconsistency in that the liquid–vapour coexistence densities by the mechanical stability solution deviate from those of the Maxwell construction. To solve the problem, Li et al. (Reference Li, Luo and Li2012, Reference Li, Luo and Li2013) proposed to adjust the mechanical stability condition to be consistent with the Maxwell construction. Recently, such an adjustment method has been extended to the CLBM for single-component thermal multiphase systems, such as two-dimensional convective boiling (Saito et al. Reference Saito, De Rosis, Fei, Luo, Ebihara, Kaneko and Abe2021) and three-dimensional pool boiling (Fei et al. Reference Fei, Yang, Chen, Mo and Luo2020). More specifically, the central-moment forcing terms in (2.8) are slightly modified as (Saito et al. Reference Saito, De Rosis, Fei, Luo, Ebihara, Kaneko and Abe2021)
where $\eta = 4\sigma {| {{{\boldsymbol {F}}_{int}}} |^2}/[{\psi ^2}\Delta t(1/{s_b} - 0.5)]$ and the tuning parameter is chosen as $\sigma = 0.117$.
Using the Chapmann–Enskog analysis, the above CLBM with the pseudopotential model recovers the following macroscopic equations:
where $\nu = c_s^2\Delta t(1/{s_v} - 0.5)$ and ${\nu _b} = c_s^2\Delta t(1/{s_b} - 0.5)$ are the kinetic and bulk viscosities, respectively, and ${s_v}$ and ${s_b}$ are relaxation rates for second-order central moments in the diagonal relaxation matrix ${\boldsymbol {S}} = \textrm {diag}({s_0},{s_1},{s_1},{s_b},{s_v},{s_v},{s_3},{s_3},{s_4})$. The last term can be absorbed into the pressure tensor, leading to a thermodynamically consistent mechanical stability condition (Li et al. Reference Li, Luo and Li2013).
2.2. Discrete element method for particle dynamics
The DEM calculates the translational and angular velocities (${{\boldsymbol {U}}_a}$ and ${{\boldsymbol {\varOmega }}_a}$, respectively) of a classical multi-body system by applying Newton's second law to each grain to describe the deformation of the granular assembly:
where N is the number of grains in the system and ${M_a}$ and ${I_a}$ are the mass and the moment of inertia of the a-th grain, respectively. The method consists of calculating the total force ${{\boldsymbol {F}}_a}$ and total torque ${{\boldsymbol {T}}_a}$ acting on each particle and the numerical solution of the ordinary differential equation (2.13) (Cundall & Strack Reference Cundall and Strack1979). In the present work, we consider each grain as a two-dimensional circular particle (disc) with radius ${r_a}$ and all grains are made of the same material with density ${\rho _p}$; therefore we have ${M_a} = {\rho _p}{\rm \pi} r_a^2$ and ${I_a} = {\rho _p}{\rm \pi} r_a^4/2$. The angular velocity ${{\boldsymbol {\varOmega }}_a} = \omega {\boldsymbol {k}}$ has only one non-zero component $\omega$ (${\boldsymbol {k}}$ is the unit vector perpendicular to the paper).
The total force in (2.13) is composed of the contact interaction forces ${\boldsymbol {F}}_a^b$ (between particles a and b), hydrodynamic force ${\boldsymbol {F}}_a^h$, capillary force ${\boldsymbol {F}}_a^{cap}$ and body force ${\boldsymbol {F}}_a^v$. Each force leads to a torque contribution, except for the body force that always acts along the centre of mass. Thus,
The hydrodynamic force, capillary force and their torques come from the interaction between the fluid and solid particles, and are discussed in the next subsection. The body force is most often the gravity force, ${\boldsymbol {F}}_a^v = - {M_a}g\,{\boldsymbol {j}}$, where g is the magnitude of gravitational acceleration and ${\boldsymbol {j}}$ is the unit vector in the vertical direction.
In the DEM, the solid particles are not deformable, but they can overlap in the sense they are considered to be rigid while their contact is assumed to be soft. Considering two particles a and b in contact, as shown in figure 1, the overlap zone at the contact is limited to be very small by introducing a repulsive normal force ${F_n}$. Related to the relative tangential motion, there is a tangential force in addition to the normal force ${F_t}$. Therefore, the contact interaction force can be decomposed into two components:
where ${\boldsymbol {n}}$ and ${\boldsymbol {t}}$ are unit vectors along the normal and tangential directions, respectively. The particle contact torque is
where ${{\boldsymbol {X}}_a}$ and ${{\boldsymbol {X}}_b}$ are the vectors fixing the particle centre and contact point, respectively. Following Luding et al. (Reference Luding, Clément, Blumen, Rajchenbach and Duran1994), we consider the contact as a linear spring with damping. The repulsive normal force depends linearly on the mutual compression distance ${\delta _n}$, which is defined as
The normal force appears when ${\delta _n}<0$ and is controlled by the stiffness of the grain particle ${k_n}$. Also, another damping term that opposes the relative velocity of two contact particles is added to consider energy dissipation. The normal force can be explicitly written as (Luding et al. Reference Luding, Clément, Blumen, Rajchenbach and Duran1994)
where ${\gamma _n}$ is the normal damping constant and the relative normal velocity is calculated by $\textrm {d}{\delta _n}/\textrm {d}t = ({{\boldsymbol {U}}_a} - {{\boldsymbol {U}}_b}) \boldsymbol {\cdot } {\boldsymbol {n}}$. To avoid the appearance of an attractive force, one can simply set ${F_n} = 0$ when (2.18) produces ${F_n} > 0$ (Pöschel & Schwager Reference Pöschel and Schwager2005). The tangential force is defined similarly, and is assumed to obey Coulomb's friction law, i.e.
where ${k_t}$ is the stiffness of the tangential spring, ${\gamma _t}$ is the damping constant, ${\mu _f}$ is the friction coefficient and the relative tangential velocity is calculated by $\textrm {d}{\delta _t}/\textrm {d}t = ({U_a} - {{\boldsymbol {U}}_b}) \boldsymbol {\cdot } {\boldsymbol {t}} - ({r_a}{\varOmega _a} + {r_b}{\varOmega _b}) \times {\boldsymbol {n}}$. To save memory, we only consider a particle interacting with those particles within a cut-off radius, which is achieved using the Verlet list algorithm (Verlet Reference Verlet1967). By default, the DEM parameters in (2.18) and (2.19) are set according to the physical properties of granite sand (Soundararajan Reference Soundararajan2015).
In the time evolution of the DEM, a suitable numerical scheme is needed to integrate (2.13) twice, i.e. to obtain the particle linear and angular velocities as well as the translational and angular positions. Here we use the Verlet integration algorithm (Verlet Reference Verlet1967) since it has second-order accuracy, is fast to implement and requires less storage memory. The Verlet scheme first evaluates the velocities at the half-integer time steps and computes the new positions:
where ${\varphi _a}$ is particle angular position and $\Delta {t_{DEM}}$ is the time step in the DEM, which is not necessarily equal to $\Delta t$ in the LBM, as is discussed later. Using the new position information, the particle velocities are updated as
2.3. Fluid–solid interactions
The hydrodynamic force is calculated based on the momentum-exchange method (Ladd Reference Ladd1994a). The basic consideration is as sketched in figure 2: at a boundary point ${{\boldsymbol {x}}_b}$, some post-collision DDFs $f_i^*({{\boldsymbol {x}}_b},t)$ stream into the solid particle and each of them contributes a momentum to the particle, i.e. $f_i^*({{\boldsymbol {x}}_b},t){{\boldsymbol {e}}_i}$, while at the solid point ${{\boldsymbol {x}}_s}$, the opposite post-collision DDFs $f_{\boldsymbol {i}}^*({{\boldsymbol {x}}_s},t)$ stream out of the solid particle and each of them contributes a momentum decrement $f_{\boldsymbol {i}}^*({{\boldsymbol {x}}_s},t){{\boldsymbol {e}}_{\boldsymbol {i}}}$. Wen et al. (Reference Wen, Zhang, Tu, Wang and Fang2014) proposed that the relative velocity (discrete velocity displaced by the wall velocity ${\boldsymbol {u}}_w$) should be used in the momentum computation and proposed the following Galilean invariant momentum-exchange method:
where ${{\boldsymbol {X}}_a}$ is the particle centre and the summation runs over all the fluid–solid links. Similar to (2.5), the Galilean invariant momentum-exchange method in (2.22) is based on central moments of the post-collision distributions, which is therefore very consistent with the central-moment-based CLBM used in § 2.1. The velocity of each wall point ${{\boldsymbol {x}}_w}$ is determined by
The capillary force calculation depends on the contact angle scheme. In this work, the improved virtual-density contact angle scheme by Li, Yu & Luo (Reference Li, Yu and Luo2019) is used due to its simplicity and locality. The basic idea is that the solid points in the neighbourhood of the liquid are allocated virtual densities by
where ${\rho _{ave}}({{\boldsymbol {x}}_s})$ is calculated based on the weighted average of the density at the neighbouring fluid points (Li et al. Reference Li, Yu and Luo2019). The parameters $\phi$ and $\delta \rho$ are used to tune the contact angle $\theta$. Then, the pseudopotential at the solid point is substituted into (2.9) to calculate the interaction force at the boundary point. The capillary force and torque are obtained by adding up the adhesive force contribution along all the fluid–solid links:
2.4. Curved boundary treatment
In (2.22), the opposite post-collision DDFs $f_{\boldsymbol {i}}^*({{\boldsymbol {x}}_s},t)$ at the solid point node are needed. However, inside the solid particle, the lattice Boltzmann solver is not implemented. This requires boundary condition treatment: how does one obtain $f_{\boldsymbol {i}}^*({{\boldsymbol {x}}_s},t)$ or ${f_{\boldsymbol {i}}}({{\boldsymbol {x}}_b},t + \Delta t)$ after the streaming step? A simple and straightforward strategy is the half-way bounce-back scheme, i.e. ${f_{\boldsymbol {i}}}({{\boldsymbol {x}}_b},t + \Delta t) = f_i^*({{\boldsymbol {x}}_b},t)$. Since it is first-order-accurate, more lattice nodes are needed to resolve one solid particle using the half-way bounce-back scheme, which limits the total number of particles in our system. Many second- and higher-order curved boundary schemes have also been proposed in the literature (Yu et al. Reference Yu, Mei, Luo and Shyy2003a), among which the method originally proposed by Filippova & Hänel (Reference Filippova and Hänel1998) is used in the present work.
As sketched in figure 2, the physical boundary intersects the fluid–solid link between the boundary node ${{\boldsymbol {x}}_b}$ and the solid node ${{\boldsymbol {x}}_s}$ at the wall node ${{\boldsymbol {x}}_w}$. The fraction of the intersected link in the fluid region is defined as $\delta = | {{{\boldsymbol {x}}_b} - {{\boldsymbol {x}}_w}} |/| {{{\boldsymbol {x}}_b} - {{\boldsymbol {x}}_s}} |$. To obtain a second-order scheme, Filippova & Hanel proposed to obtain $f_{\boldsymbol {i}}^*({{\boldsymbol {x}}_s},t)$ using the following linear interpolation:
where $\chi$ is a weighting factor. The main feature of the scheme by Filippova & Hanel lies in that it introduces a fictitious equilibrium distribution function given by
where ${{\boldsymbol {u}}_s}$ is the fictitious velocity at ${{\boldsymbol {x}}_s}$, and the weights ${\omega _i}$ are defined as ${\omega _0} = 4/9$, ${\omega _{1 - 4}} = 1/9$ and ${\omega _{5 - 8}} = 1/36$. The weighting factor $\chi$ depends on $\delta$ and ${{\boldsymbol {u}}_s}$. In this work, we use the original choice by Filippova & Hanel for $\delta \geq 1/2$ and the improved scheme by Mei et al. (Reference Mei, Luo and Shyy1999) for $\delta < 1/2$, namely
where ${{\boldsymbol {u}}_f}$ is the fluid velocity at the node next to the boundary node ${{\boldsymbol {x}}_f} = {{\boldsymbol {x}}_b} - {{\boldsymbol {e}}_i}\Delta t$.
The above scheme performs well for the fixed curved boundary in single-phase flows. However, in multiphase systems, the scheme leads to mass leakage due to the unbalance of outgoing and incoming mass at the boundary nodes. As a result, for a static droplet resting on a disc or sphere, the droplet shrinks or expands spontaneously (Yu et al. Reference Yu, Li and Wen2020; Yao et al. Reference Yao, Liu, Zhong and Wen2022). To overcome mass leakage, Yu et al. (Reference Yu, Li and Wen2020) proposed a simple strategy by adding a compensation term in the rest DDFs:
Yao et al. (Reference Yao, Liu, Zhong and Wen2022) proposed another scheme which also uses the above compensation term but slightly modified, ${f_{\boldsymbol {i}}}({{\boldsymbol {x}}_b},t + \Delta t)$, by considering the non-ideal force effect. It may be noted that both schemes are developed for a fixed curved boundary, in the sense that the particle cannot move. For a moving curved boundary, the third term has been added in (2.26) to include the boundary velocity effect. Based on simple tests, we find (2.29) still leads to sensible mass leakage for moving boundary problems, and we propose to use the following alternative scheme by removing the velocity correction term in ${f_{\boldsymbol {i}}}({{\boldsymbol {x}}_b},t + \Delta t)$, i.e.
2.5. Refilling scheme and effective hydraulic particle radius
For our considered problems, some nodes may emerge from the solid region to the fluid domain due to the movement of particles in the time interval t to $t + \Delta t$, as sketched in figure 3. To initialize the DDFs at these points, we use the following non-equilibrium refilling scheme:
where ${\rho _{ave}}({{\boldsymbol {x}}_b})$ is calculated based on the weighted average of the density at the neighbouring fluid nodes, and ${\boldsymbol {u}}({{\boldsymbol {x}}_b})$ is calculated according to the particle velocity:
Previously, Caiazzo (Reference Caiazzo2008) simply copied the non-equilibrium part from a neighbour of the new fluid node. However, such a neighbour of the present new fluid node along a certain discrete velocity direction could as well be a new fluid node or even a solid node, which, for either, the non-equilibrium part is unknown. To avoid ambiguity and improve stability, we use a weighted average method to approximate the non-equilibrium part:
where the summation runs over all the old neighbouring fluid nodes. Taking ${{\boldsymbol {x}}_b}$ in figure 3 as an example, the summation includes ${{\boldsymbol {x}}_c}$ , ${{\boldsymbol {x}}_d}$ and ${{\boldsymbol {x}}_e}$.
As discussed by Jiang et al. (Reference Jiang, Liu, Chen and Tsuji2022), two-dimensional simulations may encounter the problem that there are no connected paths for fluid to flow through densely packed sediments, while in three dimensions pore spaces may actually be interconnected. In addition, when two particles are in contact with each other, it brings difficulties in treating curved boundary conditions using the scheme discussed in above. To solve this problem, we employ a method similar to that proposed by Boutt, Cook & Williams (Reference Boutt, Cook and Williams2011), by introducing an effective hydraulic radius ${r_{a,h}}$ for each particle a in LBM simulations. By default, the effective hydraulic radius in the LBM is $2.5\Delta x$ smaller than the particle radius in the DEM, i.e. ${r_{a,h}} = {r_a} - 2.5\Delta x$.
2.6. Unit conversion and time-step matching
Usually, lattice units are used in LBM simulations while physical units are used in DEM simulations. In the coupled LBM–DEM model, information exchange is needed at the interface of the LBM and DEM solvers. For example, we need to convert the lattice unit hydrodynamic force and capillary forces calculated based on DDFs and pseudopotential functions into physics units for solving particle dynamics. We also need to convert the physical unit particle locations and velocities into lattice units to deal with the boundary conditions and refilling in the LBM solver. To this aim, unit conversion is needed. The variables in lattice units can be converted into physical units based on the reference variables, and we consider the following three primary variables, namely reference length $\Delta {{x}_r}$, reference time $\Delta {t_r}$ and reference mass ${m_r}$, i.e.
where L is the system size and the indexes p and l indicate a variable in physical and lattice units, respectively. Other reference variables, such as reference acceleration, reference force, reference torque, reference translation velocity and reference angular velocity, are derived from the primary variables:
As noted above, the time steps used in the LBM and in the DEM do not need to be identical. Considering both in physical units, the LBM time step is determined by fluid viscosity ${v_{phys}}$ and the mesh size $\Delta {x_{phys}}$, i.e. $\Delta {t_{LBM}} = (1/{s_v} - 0.5)\Delta x_{phys}^2/3{v_{phys}}$, while the DEM time step $\Delta {t_{DEM}}$ should be smaller than a critical oscillation length scale by
where ${r_{min}}$ is the smallest particle radius and the step factor $\lambda$ is chosen to be around 0.1 to ensure both stability and accuracy (Soundararajan Reference Soundararajan2015). Usually, $\Delta {t_{DEM}}$ is smaller than $\Delta {t_{LBM}}$; therefore a subcycling time integration with ${N_{sub}}$ steps in the DEM is required to match one LBM step. To this aim, the DEM time step is chosen as
where $\lceil {\cdot } \rceil$ is an integer round-off operator.
3. Model validation
In this section, we conduct several benchmark cases to validate our proposed LBM–DEM model for gas–liquid–solid interaction problems. Firstly, sedimentation by gravity of a single disc in a single-phase fluid is considered to validate the implementation of the curved boundary scheme and refilling scheme. Secondly, a single particle floating on the liquid–gas interface is simulated to validate the implementation of contact angle and capillary force. Then, the sinking of a horizontal cylinder is simulated to test the model against the experiment. Finally, we validate the implementation of particle interactions in the DEM by considering the self-assembly process of three particles on the liquid–gas interface.
3.1. Single-disc sedimentation in single-phase fluid
The considered problem is sketched in figure 4. A disc with diameter D is initially released away from the channel centre, which is filled with static single-phase fluid. Due to its higher density than that of the fluid, the disc sinks and rotates under gravity and the hydrodynamic force. The disc accelerates in the early stage and finally reaches a steady state with a constant descending velocity along the centreline since the drag force and buoyancy exactly offset gravity. To compare with the arbitrary Lagrangian–Eulerian technique (ALE) simulation (Hu, Patankar & Zhu Reference Hu, Patankar and Zhu2001) and previous LBM simulations by Wen et al. (Reference Wen, Li, Zhang and Fang2012, Reference Wen, Zhang, Tu, Wang and Fang2014), the channel width is set as $4 \times {10^{ - 3}}$ m and the disc diameter is ${10^{ - 3}}$ m. The fluid density and kinematic viscosity are ${10^{3}}\ \textrm {kg}\ \textrm {m}^{-3}$ and ${10^{ -6}}\ \textrm {m}^2\ \textrm {s}^{-1}$. The disc is released at $7.6 \times {10^{ - 4}}$ m away from the left wall, and the gravitational acceleration is $g = - 9.8\ \textrm {m} \textrm {s}^{-2}$. The channel width is resolved by $120{{}}\Delta x$, and the length-to-width ratio is 12.5. The terminal vertical velocity ${v_p}$ depends on the particle density, and we consider two cases with ${\rho _p} = 1.01 \times {10^3}$ and $1.03 \times {10^3}\ \textrm {kg}\ \textrm {m}^{-3}$, leading to a terminal Reynolds number (defined as ${Re} = D{v_p}/\nu$) $Re=3.23$ and 8.33, respectively. In the LBM solver, the kinetic viscosity is set as 0.033, leading to ${s_v} = 1.667$. The time steps in LBM and DEM are $\Delta {t_{LBM}} = 3.704 \times {10^{ - 5}}$ s and $\Delta {t_{DEM}} = 6.173 \times {10^{ - 6}}$ s, respectively, with ${N_{sub}} = 6$.
The time-dependent trajectories, angular velocities, horizontal velocities and vertical velocities for the two cases are shown in figures 5 and 6 together with a comparison with the results by ALE (Hu et al. Reference Hu, Patankar and Zhu2001) and Wen et al. (Reference Wen, Li, Zhang and Fang2012, Reference Wen, Zhang, Tu, Wang and Fang2014). In terms of trajectories, angular velocities and horizontal velocities, the present simulations are in excellent agreement with the two reference solutions. The present model gives slightly lower terminal vertical velocities than Wen et al., deviates slightly from ALE for case $Re=3.23$ (figure 5d) but agrees better with ALE for case $Re=8.33$ (figure 6d). The difference between the present model and Wen et al. lies in that we use the Filippova & Hanel scheme to deal with curved boundary conditions and the non-equilibrium scheme to initialize the newborn fluid nodes, while the quadratic interpolation scheme and second-order extrapolation scheme have been used by Wen et al. As we have discussed above, the interpolation/extrapolation schemes work well for suspended particles in single-phase fluids, but suffer from numerical instabilities in two-phase fluids. Nevertheless, the differences between our method and Wen et al. are negligible, which confirms the accuracy of the curved boundary scheme and refilling scheme used in the present model.
In the above simulations, the resolution is chosen the same as that of Wen et al. (Reference Wen, Zhang, Tu, Wang and Fang2014) by setting $D = 30\Delta x$. Here, we want to test the dependence of the results on the grid size by considering another two settings, i.e. $D = 20\Delta x$ and $D = 25\Delta x$. For the trajectories, horizontal and vertical velocities, the differences among the results based on different resolutions are almost negligible, as shown in figures 6(a), 6(c) and 6(d), respectively. For the angular velocities, the differences are also very small, but the results based on coarser meshes (especially for $D = 20\Delta x$) present some oscillations, as seen in the inset of figure 6(b). We have also conducted more simulations with different resolutions at different $Re$; the trend is similar and is not shown here. Generally, we see that accurate and smooth results can be obtained at the condition $D \geq 25\Delta x$. Such a criterion will be taken into account in more complex cases in the following.
3.2. Single particle floating on the liquid–gas interface
We now simulate a particle with a diameter D floating at the liquid–gas interface, as sketched in figure 7. The system has a size of $2D \times 2D$ with non-slip boundary conditions on all the walls and is divided into two equal parts, filled with gas phase and liquid phase at the top and bottom, respectively. The particle is initially located in the centre of the system. To make the particle's steady location solely adjusted by the contact angle, gravity is neglected in this case (Zhang et al. Reference Zhang, Liu and Zhang2020). Due to the capillary force, the particle will move adaptively to a steady location, where the contact angle equals the equilibrium contact angle. In the simulations, the particle diameter is 5 mm, resolved by 100 $\Delta x$. The particle density, liquid density and liquid viscosity are chosen as ${\rho _p} = 2000\ \textrm {kg}\ \textrm {m}^{-3}$, ${\rho _l} = 1000\ \textrm {kg}\ \textrm {m}^{-3}$ and ${\nu _l} = {10^{ - 4}}\ \textrm {m}^2\ \textrm {s}^{-1}$, respectively. In the LBM, the viscosity is set as ${\nu _l} = 0.05$. For this problem, the time steps in LBM and DEM are identical, $\Delta {t_{LBM}} = \Delta {t_{DEM}} = 1.25 \times {10^{ - 6}}\ \textrm {s}$, since $\Delta {t_{LBM}} < \Delta {t_{cr}}$ and the subcycling step ${N_{sub}}$ in (2.37a,b) is set to be unity.
We consider different cases by changing $\phi$ and $\delta \rho$ in (2.24) to achieve various contact angles. Snapshots for three typical cases are shown in figure 8. According to (2.24), the case with $\phi = 1.25$ and $\delta \rho = 0.0$ leads to a hydrophilic wetting condition; therefore the particle moves downward with some transient oscillation and finally reaches a steady position (seen in figure 8a–d), with a contact angle measured using ImageJ Fiji software of ${\theta _1} = {56.2^ \circ }$. For the case in figure 8(e–h) with $\phi = 1.0$ and $\delta \rho = 0.0$, a neutral wetting condition is expected and the measured steady contact angle is ${\theta _1} = {94.2^ \circ }$. Although not exactly at ${90^ \circ }$, it is within the acceptable range compared with the results reported in Li et al. (Reference Li, Yu and Luo2019). The case with $\phi = 1.0$ and $\delta \rho = 0.3$ corresponds to a hydrophobic wetting condition; accordingly the particle moves upward and finally reaches the steady position with ${\theta _1} = {120.8^ \circ }$, as seen in figure 8(i–l). Among the three cases, the transient time is the smallest ($\sim$0.75 s) for the case in figure 8(e–h) since its initial location is closest to the steady state and capillary oscillation is barely present. Such an argument is further confirmed by the transient vertical locations for different cases shown in figure 9(a), where for the cases with larger deviation from the neutral case, either hydrophilic or hydrophobic, the oscillation is more significant. For a consistent contact angle scheme, one may expect that the contact angle on a moving boundary agrees with the contact angle measured on a fixed boundary. To this aim, a static droplet sitting on a fixed particle is also simulated, and the measured contact angle ${\theta _2}$ is compared with ${\theta _1}$ for different settings in figure 9(b). It is clearly seen that the two contact angles agree well with each other, which confirms the consistency of the contact angle implementation in the present model.
3.3. Sinking of a horizontal cylinder
In order to further test the performance of our proposed LBM–DEM for the gas–liquid–solid interaction problems in the presence of moving contact lines, the sinking of a horizontal cylinder is investigated. The problem has been studied experimentally by Vella, Lee & Kim (Reference Vella, Lee and Kim2006) and numerically by He et al. (Reference He, Li, Huang, Hu and Wang2019) and Zhang et al. (Reference Zhang, Liu and Zhang2020). As sketched in figure 10, a circular cylinder with a diameter $D = 5\ \textrm {mm}$ (long enough in the axial direction) lies horizontally at the liquid–gas interface. The density of the cylinder is chosen as ${\rho _d} = 1920\ \textrm {kg}\ \textrm {m}^{-3}$ such that the capillary force and the weight of the displaced liquid (of density ${\rho _l} = 1000\ \textrm {kg}\ \textrm {m}^{-3}$) are not sufficient for the cylinder to remain afloat. Therefore, the cylinder sinks rapidly to become completely immersed in the bulk fluid. Length $h$ is the distance between the cylinder's centre and the undeformed free surface; $\beta$ is the angle between the position of the contact line and the vertical direction. In the simulation, the cylinder is initially half-immersed at the liquid–gas interface. The computational domain is chosen as $12D \times 4.8D$, which is sufficiently wide so that the capillary waves reflected by the sidewalls will not affect the sinking dynamics, and the cylinder diameter is resolved by $100\Delta x$. The four boundaries are set as solid walls with a contact angle of ${90^ \circ }$. The initial liquid–gas interface is beneath the top wall, with a distance $D$. The cylinder contact angle is set as the averaged value of the contact angles in the experiments (Vella et al. Reference Vella, Lee and Kim2006), i.e. $\theta = {111^ \circ }$ ($\phi = 1.0$ and $\delta \rho = 0.21$). To match the experimental conditions, we choose the Weber number as ${We} = {\rho _l}g{D^2}/\gamma = 3.7$ and the Ohnesorge number as ${Oh} = {\rho _l}{\nu _l}/\sqrt {{\rho _l}D\gamma } = 0.017$, with ${\rho _l} = 7.452$, gravity $g = 4.9 \times {10^{ - 6}}$, surface tension $\gamma = 0.098$ and ${\nu _l} = 0.02$ in lattice units.
Figure 11 shows snapshots of the sinking process, where the simulation results (figure 11b) are compared with the experimental results (figure 11a). A good agreement is observed at different instants. To be more quantitative, we also plot the evolutions of the cylinder's centre and the angle of the contact line relative to the centreline in figure 12. According to Vella et al. (Reference Vella, Lee and Kim2006) and He et al. (Reference He, Li, Huang, Hu and Wang2019), $h$ and $t$ have been normalized by the characteristic length $\sqrt {\gamma /{\rho _l}g}$ and the characteristic time ${(\gamma /{\rho _l}{g^3})^{1/4}}$, respectively. It is seen that the cylinder's centre experiences acceleration (due to gravity) in the beginning stage, then goes to a steady stage showing a linear drop of $h^*$ with $t^*$ and finally is subject to a slight deceleration (maybe due to the snap-off). Our present simulations agree very well with the experiments, as shown in figure 11(a). The angle $\beta$ decreases slightly in the beginning, which is as expected due to the hydrophobic condition, although the experimental data are missing at ${t^*} < 0.7$. Afterward, $\beta$ increases approximately linearly with time in both experiments and our simulations. The small differences between simulations and experiments may be attributed to the fact that the dynamic contact angle ${\theta _d} \in [{97^ \circ },{125^ \circ }]$ in experiments (Vella et al. Reference Vella, Lee and Kim2006) has been replaced by its mean value $\theta = {111^ \circ }$ in simulations. Nevertheless, the accuracy of the present simulation is within an acceptable range.
3.4. Self-assembly of three particles on a liquid–gas interface
In this subsection, we test the ability of our model for multi-particle liquid–gas–solid interactions by simulating the self-assembly of three hydrophilic particles on a liquid–gas interface. Following the previous simulations by the diffuse-interface immerse-boundary method (Liu, Gao & Ding Reference Liu, Gao and Ding2017) and LBM (Zhang et al. Reference Zhang, Liu and Zhang2020), three equal-size hydrophilic particles, marked as A, B and C, are initially half immersed at the liquid–gas interface with different distances between each other, as sketched in figure 13. The particle diameter is ${D}=5$ mm, resolved by 100 $\Delta x$, the contact angle is $\theta = {56.2^ \circ }$ and the system size is $30\ \textrm {mm} \times 20\ \textrm {mm}$. Non-slip velocity and neutral wetting conditions are set on all the wall boundaries. The liquid density, particle density and liquid viscosity are chosen as ${\rho _l} = 1000\ \textrm {kg}\ \textrm {m}^{-3}$, ${\rho _p} = 400\ \textrm {kg} \textrm {m}^{-3}$ and ${\nu _l} = 5 \times {10^{ - 6}}\ \textrm {m}^{2}\ \textrm {s}^{-1}$, respectively. Gravity is included with $g = - 9.8\ \textrm {m}\ \textrm {s}^{-2}$. In the LBM, the viscosity is set as ${\nu _l} = 0.04$. Based on the unit conversion, the time step in the LBM is $\Delta {t_{LBM}} = 5 \times {10^{ - 6}}\ \textrm {s}$, and the time step in the DEM is $\Delta {t_{DEM}} = 2.5 \times {10^{ - 6}}\ \textrm {s}$ by setting ${N_{sub}} = 2$. The surface tension based on the Laplace test in lattice units is $\gamma = 0.098$, equivalent to $0.075\ \textrm {N}\ \textrm {m}^{-1}$. The corresponding Weber and Ohnesorge numbers are ${We} = {\rho _l}g{D^2}/\gamma = 3.3$ and ${Oh} = {\rho _l}{\nu _l}/\sqrt {{\rho _l}D\gamma } = 0.033$, respectively.
Figure 14 shows the self-assembly process of the three particles at different times. From the figure, it is clear that there are three stages in the process: at the first stage, particle A moves towards B which remains almost stationary, while particle C slightly moves close to the right wall; when particle A meets with B, they move together towards the right until they collide with particle C; finally, the three particles assemble and adhere to the right wall. The physical origin of such a self-assembly behaviour can be explained with a force analysis, as done by Vella & Mahadevan (Reference Vella and Mahadevan2005). For a quantitative description, the time evolutions of the particle horizontal centres and vertical centres are plotted in figure 15. Figure 15(a) displays the above-mentioned three stages (marked as I, II and III), and the stage transitions (I/II and II/III) that happen at $t \approx 0.5\ \textrm {s}$ and $t \approx 0.85\ \textrm {s}$, respectively. During the assembly process, the particles float up and down, as evidenced by the oscillation behaviours in figure 15(b). In the end, particle A lies lower than B and C, which is due to the fact that the liquid–gas interface is lower to its left than its right and particle A must adaptively locate lower to obtain sufficient buoyancy. The present simulation results are in good agreement with the results reported in the literature (Liu et al. Reference Liu, Gao and Ding2017; Zhang et al. Reference Zhang, Liu and Zhang2020), which confirms the ability of our model for simulating complex liquid–gas–solid problems involving capillary force, gravity, moving boundary and multi-particle interactions.
4. Applications
What happens when a rain droplet falls on a dry sandy beach or a pool of mud? Droplets impacting deformable porous substrates such as sand may lead to cratering, and rearrangement of the particles and substrate (Katsuragi Reference Katsuragi2010), which has been studied to some extent experimentally (Katsuragi Reference Katsuragi2010; Delon et al. Reference Delon, Terwagne, Dorbolo, Vandewalle and Caps2011; Zhao, de Jong & van der Meer Reference Zhao, de Jong and van der Meer2017). Recently, droplets impacting on rigid porous substrates have also been studied based on pore network modelling (Rahimi et al. Reference Rahimi, Metzger, Kharaghani and Tsotsas2016) and the LBM (Wang, Fei & Luo Reference Wang, Fei and Luo2021). However, a droplet impacting on a ‘soft’ substrate, involving movable and rearranging particles, has not been simulated at the pore scale. In this section, we take up the ‘step-out’ challenge to do a preliminary numerical study of a droplet impacting a deformable porous medium at the pore scale using the above proposed LBM–DEM model.
As sketched in figure 16, a droplet with diameter ${D_0}=2$ cm is initialized with a velocity U, impacting the deformable porous medium, which is composed of 1277 movable solid particles (discs). The system size is set as $5{D_0} \times 2.5{D_0}$ to allow sufficient spreading after droplet impact, and is resolved by $2000\Delta x \times 1000\Delta x$. The particle diameter ranges from 1.03 to 1.77 mm, with an average diameter $\langle d \rangle = 1.42$ mm, leading to a large diameter ratio ${D_0}/\langle d \rangle \approx 14$, satisfying the condition ${D_0} \gg \langle d \rangle$, as suggested in experiments (Katsuragi Reference Katsuragi2010). The liquid–gas density ratio is about 17 and the interface thickness is about $5\Delta x$ by setting ${T_{sat}} = 0.86$, and $a = 3/49$ and $b = 2/21$. In physical units, the liquid density and solid density are set as $1000$ and $2650\ \textrm {kg}\ {\textrm {m}^{{-3}}}$ to mimic liquid water and granite sand, respectively (Soundararajan Reference Soundararajan2015). From current knowledge of the dynamics of droplet impact upon a solid surface, the droplet spreading behaviour is governed by the interplay of various forces, including viscosity, dissipation, surface tension and inertia, leading to scaling dependence on Reynolds number (${Re} = {D_0}U/{v_l}$), Weber number ($We = {\rho _l}{U^2}{D_0}/\gamma$) and wettability (Lee et al. Reference Lee, Laan, de Bruin, Skantzaris, Shahidzadeh, Derome, Carmeliet and Bonn2016b). For this study, we look at the dependence on We while maintaining $Re=240$ by varying U and ${v_l}$ simultaneously, in order to simplify the study of the after-impact behaviour, i.e. when liquid flow is coupled with movable particles. We consider eight cases as detailed in table 1, and for each case, we consider two wettability conditions, i.e. $\theta = {90^ \circ }$ and $\theta = {60^ \circ }$. Periodic boundary conditions are imposed along the x direction, while the non-slip boundary condition is used on the bottom and top walls.
The impact process at $We=4.4$ is shown in figure 17. For both contact angle cases, we can generally see two periods: a spreading period from $t=0$ to $t = {t_{max }}$, when the droplet spreading length D is increasing, followed by a receding period with decreasing D. The time to reach maximum spread, ${t_{max }}$, is almost the same for both cases. Compared with the case $\theta = {90^ \circ }$ shown in the left column, in the right column ($\theta = {60^ \circ }$), the droplet penetrates deeper in the pores with the particle substrate, as also seen in supplementary movies 1 and 2. Such a difference is as expected, since imbibition should occur in hydrophilic pores even in the absence of inertia force (${U}=0$). During receding, the surface energy is partially converted to kinetic energy, leading to the rise of the droplet, as seen in the last frame (${t}=0.147$ s). Interestingly, the receding droplet carries some particles at its base, a distinct feature of droplet impact on movable particles compared with droplet impact upon planar or rough surfaces. For the neutral case, the lifted particles are mainly half-immersed at the liquid–gas interface, while for the case with $\theta = {60^ \circ }$ they are largely or even completely submerged in the liquid phase.
When We is increased to 33.6, the deformation of the droplet after the impact is more significant and the interplay between droplet and particles is also enhanced, as seen in figure 18 and supplementary movies 3 and 4. A clear pancake shape is seen at $t \geq 0.101\ \textrm {s}$ for both contact angle cases, and the liquid penetration into the porous medium is more visible for the hydrophilic condition. After reaching maximum spreading ($t = {t_{max }}$), some receding behaviour of the droplet is visible but not as clearly as for the case at $We=4.4$ (see figure 17), which may be attributed to the fact that more energy is dissipated by viscosity at the present higher-We case.
Finally, when We is further increased to 151.3, as shown in figure 19, the droplet deformation after the impact is so remarkable that it almost changes to a liquid film at $t \geq 0.132\ \textrm {s}$. Compared with the previous two cases in figures 17 and 18, the movement of the particles after the droplet impact is more obvious and the liquid penetration is deeper (especially for $\theta = {60^ \circ }$), as also evidenced in supplementary movies 5 and 6. However, after the maximum spreading ($t = {t_{max }}$), the receding is so slow that for a long period, equivalent to 2.5–3 times ${t_{max }}$, the contact points at the left and right ends of the flattened droplet are in all appearance pinned.
In order to quantify the impact process, the spreading length D following droplet impact for all the cases of We is plotted versus time in figure 20. One can observe that for all cases (i) the spreading length D first increases monotonically until the maximum spreading point (indicated by green filled circles) and (ii) afterwards D decreases and tends to an asymptotic value, as also reported by the experiments of Delon et al. (Reference Delon, Terwagne, Dorbolo, Vandewalle and Caps2011). The recession is less significant for larger-We cases, which is consistent with the previous results in figures 17–19 and has also been seen in experiments (Delon et al. Reference Delon, Terwagne, Dorbolo, Vandewalle and Caps2011). A higher We leads to a larger maximum spreading length ${D_{max }}$. For the same We, ${D_{max }}$ is also affected by the contact angle $\theta$. These explicit dependencies are analysed in the following.
The understanding of ${D_{max }}$ after the droplet impact is key to the control of droplet dynamics in many applications. For example, in the case of a raindrop impacting on a soil or building surface, the wetted area for liquid transport into the substrate is directly related to ${D_{max }}$ (Blocken & Carmeliet Reference Blocken and Carmeliet2015). For a droplet impacting upon a non-deformable surface, the maximal spreading is governed by a balance between kinetic energy, surface energy and viscous dissipation during spreading (Lee et al. Reference Lee, Laan, de Bruin, Skantzaris, Shahidzadeh, Derome, Carmeliet and Bonn2016b). For the present problem, the kinetic and potential energy of particles should also be taken into consideration. To this aim, following Lee et al. (Reference Lee, Derome, Dolatabadi and Carmeliet2016a), an energy budget analysis is conducted and the calculation of different energy contributions is provided in Appendix B. As seen in figure 21, during the spreading period, the normalized kinetic energy of the droplet ${E_k}$ decreases monotonically, while the normalized dissipation energy of the droplet ${E_d}$ increases with time, as well as the normalized particle energy ${E_p}$. For the normalized surface energy of the droplet ${E_s}$, however, the trend is not monotonic and depends on different cases. At small We, the surface energy ${E_s}$ is dominant and slightly increases after impact for the neutral wetting case, as shown in figure 21(a). For the hydrophilic wetting condition, ${E_s}$ slightly decreases with time, due to the fact that the surface tension between the liquid and solid phases is smaller than the liquid–gas surface tension. For intermediate-Weber-number cases, the kinetic energy is more dominant in the beginning. However, after impact, the kinetic energy of the droplet ${E_k}$ decreases fast due to the large dissipation, as shown in figure 21(b,e). Since the droplet is greatly deformed into a pancake shape, as seen in figure 18, the surface energy increases accordingly, even for the hydrophilic case, as shown in figure 21(e). Generally, at the maximum spreading point, $t = {t_{max }}$, the accumulated dissipation energy is comparable to surface energy. At large We number, $We=151.3$, the droplet experiences significant deformation and is gradually squeezed into a thin film, leading to much more energy dissipation. In addition, a significant part of the energy is dissipated as a result of impregnation into the porous medium. Thus, the dissipation energy eventually surpasses the surface energy, as shown in figure 21(c,f).
The contributions of different energies at the maximum spreading for all the considered cases are plotted in figure 22. Generally, the surface energy shares the largest energy budget at a small impact velocity, but is outperformed by the dissipation energy with increasing impact velocity. We observe that the crossover of surface and dissipation energies occurs at a lower velocity for the hydrophilic case. The kinetic energy remaining at maximum spreading is almost zero (smaller than 4 % of the total energy). These features are very consistent with the results of droplet impact on a non-deformable solid surface by Lee et al. (Reference Lee, Derome, Dolatabadi and Carmeliet2016a). Quantitatively, the surface energy contribution in the limit of low impact velocity and the dissipation energy contribution at the high-impact-velocity limit approach 80 % and 60 % in Lee et al. (Reference Lee, Derome, Dolatabadi and Carmeliet2016a), which are around 10 % higher than our results. In all appearance, this energy difference (10 % of the total energy) can be attributed to the particle energy in our cases, as seen in figure 22.
We now try to further understand the maximum spreading length ${D_{max }}$ based on the energy budget analysis. It is known that at small $We$, most of the initial energy is converted into the surface energy at the maximum spreading length, giving
However, such a relation encounters the problem of zero spreading length in the limit of low $We$, which is not realistic. It is noted that even without impact (${U}=0$), a droplet still spreads on a solid surface, and its maximum spreading length depends on the dynamic wetting condition (Lee et al. Reference Lee, Laan, de Bruin, Skantzaris, Shahidzadeh, Derome, Carmeliet and Bonn2016b). To take into account this behaviour, Lee et al. (Reference Lee, Laan, de Bruin, Skantzaris, Shahidzadeh, Derome, Carmeliet and Bonn2016b) proposed to add a surface energy contribution $\sim \gamma {D_{max ,0}}$ in the low-velocity limit, where ${D_{max ,0}}$ is the maximum spreading length at $U \to 0$. Then, the energy balance reads
In experiments, ${D_{max ,0}}$ is estimated based on extrapolations, while in our simulations is obtained by setting a very small impact velocity ($U = 0.001$).
The above scaling fails at large We since the dominant energy switches to the dissipation energy. To describe the global dependence, a scaling relation should allow a smooth cross-over between the two limits ($We \to 0$ and $We \to \infty$), and its formulation is required to be as simple as possible. Following Lee et al. (Reference Lee, Laan, de Bruin, Skantzaris, Shahidzadeh, Derome, Carmeliet and Bonn2016b), the first-order Padé approximation is used, which gives the following relation:
where ${k_1}$ and ${k_2}$ are two fitting parameters, depending on the wall conditions (roughness and deformability) but independent of the wetting condition. It may be noted that the present analysis is based on a two-dimensional configuration. In three dimensions, the initial kinetic energy and surface energy scale as $\rho D_0^3{U^2}$ and $\gamma D_{max}^2$, respectively, and the right-hand side of (4.3) changes to ${k_1}{{We^{1/2}} / {({k_2} + We^{1/2})}}$, which is consistent with (3.6) in Lee et al. (Reference Lee, Laan, de Bruin, Skantzaris, Shahidzadeh, Derome, Carmeliet and Bonn2016b).
To check the validity of our analysis, we plot values of $({D_{max }} - {D_{max ,0}})/{D_0}$ as a function of We for all the cases considered in this work in figure 23. All points tend to collapse, over a comparatively wide parameter range, onto a single curve which is well predicted by (4.3) with fitting parameters ${k_1} = 3.11$ and ${k_2} = 34.39$. For the hydrophilic case at high impact Weber number, the simulation results are slightly lower than the scaling prediction, which may be attributed to the fact that part of the liquid penetrates into the porous medium and therefore does not contribute to the maximum spreading length.
In addition, we note that in the above energy budget analysis, we have dropped the effect of $Re$ by fixing ${Re}=240$. For a drop impacting on a rigid surface, great efforts have been made to build the dependency of the maximum spreading ratio on ${Re}$ or ${We}$, as revisited in Laan et al. (Reference Laan, de Bruin, Bartolo, Josserand and Bonn2014), Lee et al. (Reference Lee, Laan, de Bruin, Skantzaris, Shahidzadeh, Derome, Carmeliet and Bonn2016b) and Huang & Chen (Reference Huang and Chen2018). Laan et al. (Reference Laan, de Bruin, Bartolo, Josserand and Bonn2014) showed that both ${We}$ and ${Re}$ play important roles, and proposed a universal rescaling by interpolating the scaling behaviours for the viscous regime (${{Re} ^{1/5}}$) and capillary regime (${We}{^{1/2}}$). Such a scaling was further extended to taking the nature and roughness of the surface into account (Lee et al. Reference Lee, Laan, de Bruin, Skantzaris, Shahidzadeh, Derome, Carmeliet and Bonn2016b). As shown in figure 24 in Appendix C, when $Re$ is increased to 500, the impacting dynamics will be quite different from the cases above. For example, the liquid front penetrates faster into the porous medium in the beginning, leading to a large mixing ratio at the maximum spreading, similar to the experimental results reported by Zhao et al. (Reference Zhao, de Jong and van der Meer2019). In such a case, it is expected that more kinetic energy is dissipated and also transformed into particle energy, and therefore (4.3) can no longer describe the maximum spreading ratio. An appropriate extension of (4.3) by including $Re$ would be a focus in future work.
5. Conclusions
In this work, a coupled LBM–DEM model is proposed to simulate liquid–gas–solid interaction problems. The two-phase flow fluid is solved based on the LBM and the cascaded collision operator is used to enhance the numerical performance. The solid phase, composed of circular particles, is solved by the classical DEM solver. The two solves are fully coupled, in the sense that (i) each solid particle is resolved, (ii) the movement of particles leads to disappearances and births of certain fluid points and (iii) the solid particle dynamics is affected by both the particle–particle interactions and the fluid–solid interactions, including hydrodynamic momentum exchange and capillary force. To construct an accurate and robust coupling algorithm at the fluid–solid interface, a weighted average non-equilibrium extrapolation scheme is proposed to refill the newborn fluid points, the Galilean-invariant momentum-exchange method (Wen et al. Reference Wen, Zhang, Tu, Wang and Fang2014) is used to implement the hydrodynamic force and torque, and the method of Joshi & Sun (Reference Joshi and Sun2009) combined with improved virtual-density contact angle scheme (Li et al. Reference Li, Yu and Luo2019) is employed to implement the capillary force effect. To impose the non-slip boundary condition on curved walls, the scheme by Filippova & Hänel (Reference Filippova and Hänel1998) is extended to two-phase fluids and moving boundaries by appropriately adding a correction term. The developed coupling algorithm is generally local, in the sense that only the information at one layer of neighbouring lattices (see in (2.22), (2.25), (2.26) and (2.31)) is needed in the implementation. Compared with the colour-gradient LBM–DEM method recently proposed by Jiang et al. (Reference Jiang, Liu, Chen and Tsuji2022), our method is easier to implement, more efficient in computation, able to deal with two-phase fluids with different densities and can change the contact angle on moving solid walls. In addition, we also provide a detailed discussion on the unit conversion from lattice units to physical units and time-step matching between the two solvers. The proposed model is carefully validated against four benchmark problems.
The method is then applied to study the droplet impact upon a deformable porous medium, which is composed of up to 1277 solid particles. The complete spreading process after droplet impact, the deformation of the porous medium as well as the invasion of the liquid into the pores among the solid particles are well captured. By measuring the time evolution of different energies, it is found that, at the maximum spreading with cases of increasing Weber number, the surface energy is dominant to be outperformed by the accumulated dissipation energy, less energy is converted into the particle energy and the kinetic energy decreases to almost zero. The energy dissipation due to the deformation of the granular substrate under study is found to be 10 % of the total energy, leading to reduced spreading. A simple scaling relation based on the dominant energy is proposed to predict the maximum spreading length ${D_{max }}$ and is shown to work well for our considered parameter range. We expect the present method will facilitate the investigation of various complex liquid–gas–solid interaction problems, for example, the leakage of sub-seabed stored $\textrm {CO}_2$, the self-assembly of colloidal suspensions, etc.
In the future, to simulate more realistic liquid–gas–solid interaction problems, the model will be extended to three dimensions. The DEM has been well established in three dimensions, and the extension of the LBM to three dimensions is more or less straightforward. For example, we have already extended the multiphase cascaded LBM to three dimensions and applied it to simulating large-scale pool boiling (Fei et al. Reference Fei, Yang, Chen, Mo and Luo2020). For the coupling interface between the two solvers, its extension to three dimensions is also trivial since the algorithms proposed in the present work are generally local. The main challenge lies in the computational cost. Taking a typical case in § 4 as an example, our code (developed based on C$++$ and parallelized by OpenMP) needs to run for $\sim$12 h with eight processors in the Cray XC40 supercomputer at the Swiss National Super Computing Center. A CLBM based on a three-dimensional nineteen-velocity lattice (Qian et al. Reference Qian, d'Humières and Lallemand1992) approximately triples the computational cost compared with a two-dimensional nine-velocity CLBM. Therefore, the CPU time for a three-dimensional simulation (with 1000 lattices in the third direction) is $\sim$3000 times that for two-dimensional simulations by ignoring other possible costs (such as information communications). Such a computational cost is indeed huge but still feasible by using advanced high-performance computing technology; for example, the Multi-GPU accelerated computations by the hybrid OpenACC and MPI approach (Xu & Li Reference Xu and Li2023).
Supplementary movies
Supplementary movies are available at https://doi.org/10.1017/jfm.2023.822.
Acknowledgements
L.F. would like to thank Professor F. Jiang at Yamaguchi University and Professor H. Liu at Xi'an Jiaotong University for their helpful discussions on the implementation of capillary force. The authors acknowledge the reference open-source DEM code at https://github.com/cb-geo/2d-lbm-dem.
Funding
This work was supported by the Swiss National Science Foundation (project no. 175793), the ETH Research Grant (project no. ETH-08 21-2) and the Swiss National Super Computing Center (project nos. s1081 and go09). K.H.L. would like to acknowledge support from the UK Engineering and Physical Sciences Research Council (EPSRC) under grant nos. EP/R029598/1 and EP/T015233/1.
Declaration of interests
The authors report no conflict of interest.
Appendix A. Transformation matrix and shift matrix in CLBM
The transformation matrix ${\boldsymbol {M}}$ and shift matrix ${\boldsymbol {N}}$ are explicitly given as
Based on the physical definitions of ${\boldsymbol {M}}$ and ${\boldsymbol {N}}$, both of them are invertible. Moreover, ${{\boldsymbol {N}}^{ - 1}}$ has a quite similar formulation to ${\boldsymbol {N}}$, and can be obtained by simply reversing all the odd-order velocity terms in (A2). For more details, interested readers are directed to Fei & Luo (Reference Fei and Luo2017).
Appendix B. Energy budget analysis for droplet impact on deformable porous media
The kinetic energy of the droplet is calculated as
where V is the droplet volume. The dissipation energy can be written as (Qian, Wang & Sheng Reference Qian, Wang and Sheng2006; Wang, Fei & Luo Reference Wang, Fei and Luo2020)
where $\varPhi$ is the dissipation function, with the following formulation in two dimensions:
The particle energy is calculated as
where ${h_a}$ is the vertical location for particle a. The surface energy at the initial state is
The total energy equals the initial kinetic and surface energy of the droplet:
To avoid ambiguity in estimating the contact line length at the complex porous medium surface, the surface energy is calculated based on the energy balance:
For ease of analysis, we further introduce the normalized energies ${{E}_k} = {\varXi _k}/{\varXi _t}$, ${{E}_d} = {\varXi _d}/{\varXi _t}$, ${{E}_p} = {\varXi _p}/{\varXi _t}$ and ${{E}_s} = {\varXi _s}/{\varXi _t}$, and therefore ${{E}_t} = 1$.
Appendix C. Droplet impact on a deformable porous medium at ${Re} = 500$
To simulate the impact case with a larger ${Re}$, we increase both the droplet diameter and the system size by a factor of 5/4. The impact velocity and liquid viscosity are set as $U = 0.08$ and ${\nu _l} = 0.08$, respectively, leading to ${Re}=500$ and ${We}=250$. The contact angle is set as $\theta = {60^ \circ }$. All the other parameters are chosen the same as those in § 4. Typical snapshots of the impacting dynamics are shown in figure 24. More details can be seen in supplementary movie 7.