Globally, some 50 million children under 5 years of age (under-5s; ~8 % of children aged 0–59 months) suffer from wasting( Reference Black, Victora and Walker 1 ). Wasting (weight-for-height <−2 sd of the median weight-for-height in the WHO’s Child Growth Standards) poses a serious threat to child survival and development( 2 ). Mortality rates in wasted children (weight-for-height Z-score (WHZ) <−2) and severely wasted children (WHZ <−3) are three to nine times higher than in children who are not wasted( Reference Black, Allen and Bhutta 3 ).
Furthermore, wasted children who survive are at increased risk of stunted growth( Reference Khara and Dolan 4 ). A recent analysis pooling data from eight longitudinal studies in Africa, Asia and Latin America indicated that children with highly variable weight-for-length Z-score, negative changes in weight-for-length Z-score and/or wasting in the first 17 months of life are at a higher risk of linear growth retardation and stunting at 18–24 months of age, which can result in adverse and often irreversible consequences, including poor cognition and learning performance, reduced lean body mass, short adult stature, lower productivity and reduced earnings( Reference Richard, Black and Gilman 5 – Reference Dewey and Vitta 7 ).
Despite recent economic growth in many countries, South Asia is the global epicentre of child wasting( Reference Chatterjee 8 ). The latest data indicate that 16 % of South Asia’s under-5s are wasted. Levels of child wasting in South Asia are almost double those in sub-Saharan Africa (9 %) and four times higher than those in East Asia and the Pacific (4 %)( 9 ).
Landlocked at the eastern end of the Himalayas, Bhutan borders China to the north and India to the south, east and west. In 2010, Bhutan’s Multiple Indicator Survey (BMIS) indicated that 6 % of the country’s children aged 0–59 months were wasted and 2 % were severely wasted( 10 ). The prevalence of wasting was more than twice higher among children aged 0–23 months than among children aged 24–59 months (9·2 v. 3·8 %) while the prevalence of severe wasting was almost four times higher (3·8 v. 1·0 %). This is in line with global evidence indicating that most wasting happens during the 1000 d that span from conception until age 2 years( Reference Dewey and Begum 11 ).
The objective of the current analysis was threefold: (i) to characterize the epidemiology of wasting, severe wasting and poor weight-for-height in children aged 0–23 months in Bhutan; (ii) to identify the most significant predictors of wasting, severe wasting and poor weight-for-height in Bhutanese children aged 0–23 months; and (iii) to prioritize areas for action to prevent and treat child wasting in Bhutan.
Methods
We used publicly available data from the BMIS 2010( 10 ). BMIS – the customized version of the Multiple Indicator Cluster Survey (MICS) and the Demographic and Health Survey (DHS) – was a nationally representative household survey designed to provide estimates for indicators on the situation of children and women living in urban and rural areas in the three regions (Central, Eastern and Western) and twenty dzongkhags (districts) of the country.
A detailed description of the survey design, sampling methodology, survey tools and data collection can be found elsewhere( 10 ). In brief, the urban and rural areas within each dzongkhag were the main sampling strata. The sample was selected in two stages; within each stratum, a specified number of blocks in the urban areas and chiwogs (municipalities) in the rural areas were randomly selected as enumeration areas with probability proportional to size. Household listing was carried out within the selected enumeration areas and a systematic random sample of households was drawn in each enumeration area.
The survey used three questionnaires: (i) the household questionnaire, administered to collect information on all de jure (usual residents) household members, the household and the dwelling; (ii) the women questionnaire, administered in each household to all women aged 15–49 years; and (iii) the children questionnaire, administered to mothers/caregivers of children aged 0–59 months in the household. Once data collection processes were standardized, data collection took place from April to August 2010. Individual consent to participate in the survey was given by the child’s caregiver. The survey included 15 400 households, with a household response rate of 98·4 % and a child response rate of 97·5 %. The survey received ethical clearance from the Research Ethics Board of Health and the National Statistical Bureau.
We selected data from the child data set for children aged 0–23 months and we adjusted for cluster sampling and sampling weights. Wasting and severe wasting were defined as the proportion of children whose WHZ was <−2 or <−3, respectively, using the WHO’s Child Growth Standards( 2 ). Analyses were performed using the Stata statistical software package release 12 (2011). In models that performed the regression of wasting or severe wasting as the outcome (dependent) variables v. exposure (independent) variables, we report adjusted odds ratios (AOR) and 95 % confidence intervals from logistic regressions. In models that performed the regression of WHZ as the outcome variable v. exposure variables, we report regression coefficients and 95 % confidence intervals around point estimates from linear regressions. For all tests, P values <0·05 were considered statistically significant. Our analysis did not require ethical approval as we used data that are available for public use and we ensured that data analysis was conducted anonymously.
Results
The survey included a representative sample of 2404 children aged 0–23 months. Our analytical sample included 2028 children (84·4 %) for whom information on weight and height – and therefore on WHZ, wasting and severe wasting – were available, after eliminating the records of children with missing or implausible anthropometric data (WHZ<−5, WHZ>+5).
Sample characteristics
The main characteristics of these children are summarized in Table 1: 8·3 % were born with a low birth weight (<2500 g); 33·5 % were born to mothers who were married or entered a marital union before age 18 years; 37·0 % lived in households that used unimproved sanitation facilities; 57·8 % were born to mothers whose delivery was not attended by a doctor, nurse, midwife or skilled personnel; and over 60 % were born to mothers and/or fathers without formal education (62·5 % and 64·5 %, respectively).
Table 1 Distribution of children 0–23 months old by socio-economic characteristics. Bhutan, 2010
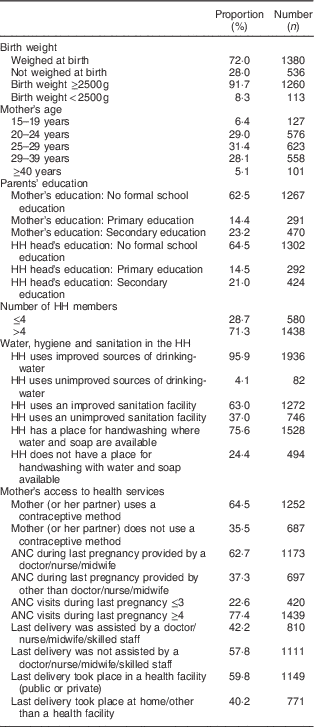
HH, household; ANC antenatal care.
The reported child feeding practices are presented in Table 2. Less than two-thirds (61·2 %) of children were breast-fed within 1 h of birth and less than half (39·9 %) of infants aged 0–5 months were exclusively breast-fed; most children (91·5 %) continued to breast-feed at 1 year, while two-thirds (66·1 %) continued to breast-feed at 2 years. Over two-thirds (67·1 %) of children aged 0–23 months were breast-fed as recommended for their age. About three-quarters (72·0 %) of infants aged 6–8 months were fed complementary foods; a similar proportion (70·6 %) of children 6–23 months old were fed complementary foods a minimum number of times per day (78·4 % in infants 6–11 months old v. 67·4 % in children 12–23 months old); and about one in ten children (11·1 %) aged 0–23 months was fed from a bottle with a nipple.
Table 2 Breast-feeding and complementary feeding practices in children 0–23 months old. Bhutan, 2010
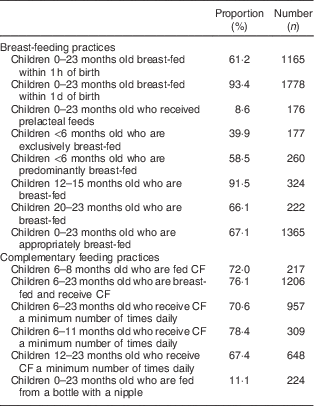
CF, complementary foods.
Prevalence of wasting and severe wasting by child, mother and household characteristics
Tables 3–5 summarize the distribution of the three outcome variables – wasting, severe wasting and WHZ – by child (Table 3), maternal (Table 4) and household (Table 5) exposure variables.
Table 3 Prevalence of wasting, prevalence of severe wasting and mean weight-for-height Z-score (WHZ) in children 0–23 months old by child characteristics. Bhutan, 2010
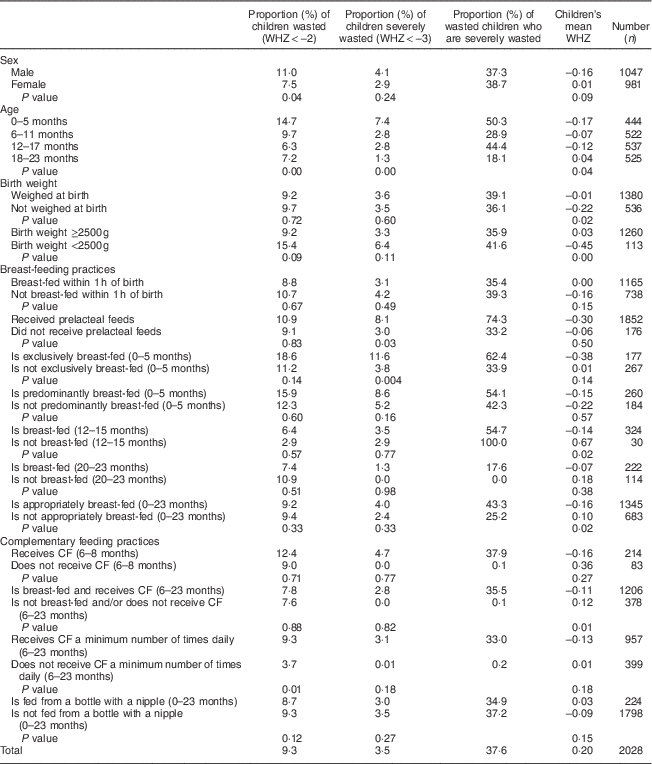
CF, complementary foods.
Table 4 Prevalence of wasting, prevalence of severe wasting and mean weight-for-height Z-score (WHZ) in children 0–23 months old by maternal characteristics. Bhutan, 2010
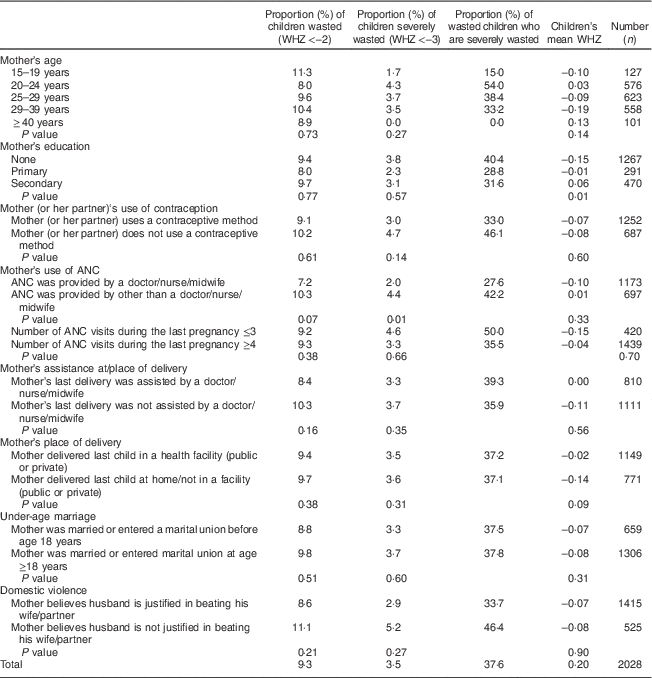
ANC antenatal care.
Table 5 Prevalence of wasting, prevalence of severe wasting and mean weight-for-height Z-score (WHZ) in children 0–23 months old by household characteristics. Bhutan, 2010
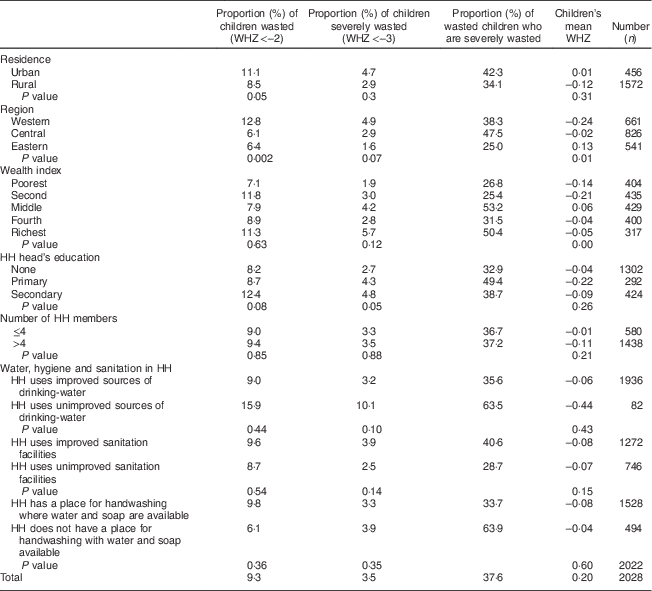
HH, household.
Table 3 (child characteristics) indicates that the prevalence of wasting in children 0–23 months old was 9·3 % while the prevalence of severe wasting was 3·5 %: thus over one-third (37·6 %) of the wasted children were severely wasted. The proportion of wasted children declined with age (from 14·7 % in children aged 0–5 months to 7·2 % in children aged 18–23 months; P<0·005), as did the proportion of severely wasted children (from 7·4 % in children aged 0–5 months to 1·3 % in children aged 18–23 months; P=0·003). The mean WHZ improved with age (from −0·17 in children aged 0–5 months to +0·04 in children aged 18–23 months; P=0·04).
The prevalence of wasting was significantly higher in boys than in girls (11·0 v. 7·5 %; P=0·04) and in children 0–11 months old than in children 12–23 months old (12·0 v. 6·7 %, P=0·004; data not presented). The prevalence of severe wasting was significantly higher among children 0–11 months old than among children 12–23 months old (5·0 v. 2·1 %, P=0·009; data not presented), in infants who were fed prelacteal feeds in the first days of life (8·1 v. 3·0 %; P=0·03) and in children aged 0–5 months who were exclusively breast-fed (11·6 v. 3·8 %; P=0·004). The mean WHZ was significantly poorer among children who were not weighed at birth (P=0·02), children born with a low weight (<2500 g; P<0·001), children 0–11 months old (P=0·04), and children 0–23 months old who were breast-fed as recommended for their age (P=0·02).
Table 4 (maternal characteristics) indicates that the prevalence of severe wasting was significantly higher among children whose mothers received prenatal care by other than a doctor/nurse/midwife (4·4 v. 2·0 %; P=0·01). The mean WHZ was significantly poorer among children born to mothers without any formal education (P=0·01) and children whose mothers were not married/in union at the time of the survey (P=0·05; data not presented).
Table 5 (household characteristics) indicates that the prevalence of wasting and severe wasting were significantly higher (i.e. double) in the Western region than in the Central and Eastern regions (12·8 v. 6·1 and 6·4%, P=0·002 and 4·9 v. 2·9 and 1·6%, P=0·07 for wasting and severe wasting in the Western, Central and Eastern region, respectively). The prevalence of wasting tended to be significantly higher in urban than in rural areas (11·1 v. 8·5 %; P=0·05). The mean WHZ was significantly poorer in children from the Western region (P=0·01) and children from the two lowest wealth quintiles (P<0·01).
Multivariate regression analysis: main predictors of child wasting in Bhutan
Multivariate logistic regression – after adjusting for age, sex, residence and selected caregiver and household-level variables – indicated that three variables were independently associated with wasting in children 0–23 months old: age, region and complementary feeding (Table 6). Children aged 0–11 months had a 46 % higher odds of being wasted than children aged 12–23 months (AOR=1·46; 95 % CI 1·00, 2·13). Children aged 0–23 months from the Western region had 63 % higher odds of being wasted than those from the Central and Eastern regions (AOR=1·63; 95 % CI 1·14, 2·34), while children aged 0–11 months from the Western region had a 2·2-fold higher odds of being wasted than those from the Central/Eastern regions (AOR=2·24; 95 % CI 1·39, 3·60). Finally, the odds of being wasted were 58 % higher in children 0–23 months old who were not fed complementary foods as appropriate for their age (AOR=1·58; 95 % CI 1·02, 2·47); this association was even stronger in children aged 0–11 months as the odds of being wasted were about twofold higher in children aged 0–11 months old who were not fed complementary foods as appropriate for their age (AOR=1·96; 95 % CI 1·21, 3·16; Table 6).
Table 6 Adjusted odds ratios (AOR) of wasting and severe wasting by age group in relation to child, maternal and household characteristics. Bhutan, 2010
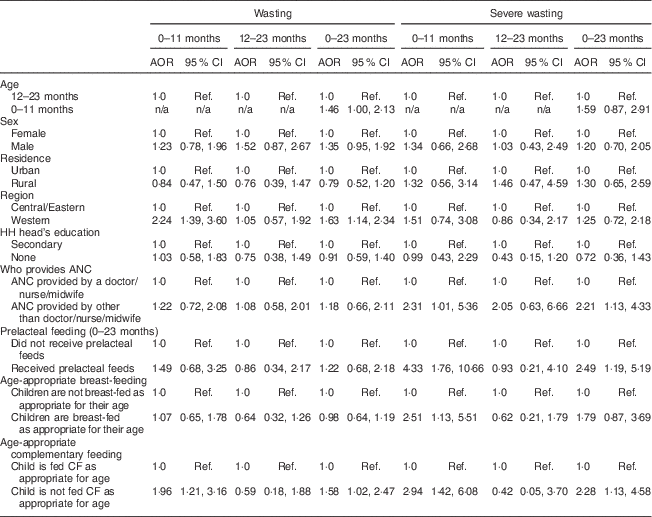
HH, household; ANC, antenatal care; CF, complementary foods; ref., reference category.
Four variables were independently associated with severe wasting in children 0–23 months old: antenatal care, prelacteal feeding, breast-feeding and complementary feeding. The odds of being severely wasted were 2·2-fold higher in children aged 0–23 months whose mothers did not receive antenatal care by a doctor, nurse or midwife (AOR=2·21; 95 % CI 1·13, 4·33); similarly, the odds of being severely wasted were 2·5-fold higher in children who were fed prelacteal feeds (AOR=2·49; 95 % CI 1·19, 5·19) and 2·3-fold higher among children who were not fed complementary foods as appropriate for their age (AOR=2·28; 95 % CI 1·13, 4·58). The association of infant feeding variables with severe wasting was particularly strong in children 0–11 months old; the odds of being severely wasted were fourfold higher in children 0–11 months old who were given prelacteal feeds (AOR=4·33; 95 % CI 1·76, 10·66) and threefold higher among those who were not fed complementary foods as appropriate for their age (AOR=2·94; 95 % CI 1·42, 6·08). Breast-feeding was associated with a higher odds of severe wasting in infants 0–11 months old (AOR=2·51; 95 % CI 1·13, 5·51; Table 6).
The models performing the regression of WHZ on the exposure variables indicated that the likelihood of poor WHZ was significantly higher among children who were not weighed at birth (P<0·05), children of mothers without formal education (P<0·01) and children from the Western region (P<0·01; Table 7).
Table 7 Associations between exposure variables and child weight-for-height Z-score (WHZ) in children 0–23 months old. Bhutan, 2010
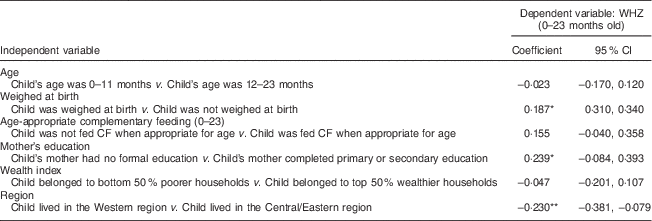
CF, complementary foods.
*P<0·05, ** P<0·01.
Discussion
Between 1988 and 2010, the prevalence of wasting in Bhutanese children aged 0–59 months hovered around 6 % without much improvement, with levels of wasting and severe wasting two to four times higher among children aged 0–23 months than among children aged 24–59 months( 10 , Reference Zangmo, de Onis and Dorji 12 ). We used data from BMIS 2010 to characterize the epidemiology of wasting in children 0–23 months old in Bhutan, identify the most significant predictors of wasting, severe wasting and poor weight-for-height, and – on the basis of these findings – prioritize areas for action.
We found that almost one in ten children (9·3 %) aged 0–23 months was wasted and over one-third (37·6 %) of the wasted children were severely wasted. The prevalence of wasting was almost double among infants 0–11 months old than among children aged 12–23 months while the prevalence of severe wasting was 2·4-fold higher among infants 0–11 months old than among children aged 12–23 months, suggesting that most wasting happens either prenatally or in the first year of life. It has been documented that, compared with the WHO/National Center for Health Statistics 1976 reference, use of the WHO 2006 Child Growth Standards changes the age pattern of wasting in children of pre-school age, with significantly increased levels of wasting in early and late infancy (0–5 months and 6–11 months, respectively) than in early childhood (12–23 months)( Reference de Onis, Onyango and Borghi 13 ).
Some of the most relevant findings of our analysis are related to the significant association of infant feeding practices with wasting, severe wasting and attained WHZ. Poor complementary feeding practices – not aligned with internationally agreed-upon guidance – were the variables more systematically associated with wasting and severe wasting in children aged 0–23 months. Global and national policy recommends that infants aged 0–5 months be exclusively breast-fed, with no other fluids or foods given, not even water, while children aged 6–23 months should be fed age-appropriate soft, semi-solid or solid complementary foods while breast-feeding continues( 14 ). In our sample, 28 % of infants aged 6–8 months were not being fed complementary foods (timely introduction of complementary feeding), 23·9 % of children aged 6–23 months were not being fed both breast milk and complementary foods (complementary feeding with continued breast-feeding) and 29·4 % of children aged 6–23 months were not being fed complementary foods a minimum number of times per day (minimum meal frequency). Children 0–23 months old who were not fed complementary foods as recommended for their age had 1·6-fold higher odds of being wasted and 2·3-fold higher odds of being severely wasted after controlling for all other variables. This association was even stronger among infants aged 0–11 months: those who were not fed complementary foods as recommended for their age had twofold higher odds of being wasted and threefold higher odds of being severely wasted. A recent multi-country analysis of DHS data in eight countries found that several indicators of appropriate complementary feeding were positively associated with higher mean WHZ and/or lower odds of wasting in Uganda, Zambia and Zimbabwe( Reference Jones, Ickes and Smith 15 ).
Prelacteal feeding (i.e. non-exclusive breast-feeding in the first 3 d of life) was associated with 2·5-fold higher odds of severe wasting in children 0–23 months old and 4·3-fold higher odds of severe wasting in infants 0–11 months old. However, age-appropriate breast-feeding (exclusive breast-feeding in infants aged 0–5 months and continued breast-feeding in children aged 6–11 months) was associated with 2·5-fold higher odds of severe wasting in infants aged 0–11 months (AOR=2·51; 95 % CI 1·13, 5·51). This finding is counter-intuitive and deserves further investigation. Studies in Bangladesh and Zambia found a positive association between exclusive breast-feeding and reduced odds of wasting( Reference Zongrone, Winskell and Menon 16 , Reference Ali, Rawat and Subandoro 17 ). Conversely, studies in Ethiopia, Haiti, India, Kenya, Uganda and Zimbabwe did not find any significant positive association between breast-feeding and lower odds of wasting or higher attained WHZ( Reference Jones, Ickes and Smith 15 , Reference Ali, Rawat and Subandoro 17 – Reference Menon, Bamezai and Subandoro 19 ). A recent meta-analysis on the growth benefits of breast-feeding has shown that breast-feeding interventions were associated with small, non-significant increases in weight and length/height Z-scores, and led to a modest, albeit significant, reduction in BMI Z-score/WHZ. For all outcomes, there was substantial heterogeneity among studies, which led the authors of the meta-analysis to indicate that their results ‘must be interpreted with caution’( Reference Giugliani, Horta and Loret de Mola 20 ).
However, the benefits of breast-feeding for child survival and development are well established( Reference Jones, Steketee and Black 21 , Reference Bhutta, Das and Rizvi 22 ). Recent meta-analyses and systematic literature reviews by WHO show that children who are breast-fed have better survival rates, higher intelligence quotients, and lower risk of otitis, malocclusion, asthma and obesity. Breast-feeding mothers benefit from having breast-fed, with lower rates of breast cancer, ovarian cancer, type 2 diabetes and postpartum depression. The multiple benefits of breast-feeding demonstrate the contribution and relevance of breast-feeding as a global public health issue, for low- and high-income populations alike( Reference Grummer-Strawn and Rollins 23 ). Therefore the protection, promotion and support of optimal breast-feeding needs to remain a central component of national programmes for child survival and development even if the empirical evidence of its direct impact on the prevention of wasting is limited( 14 , Reference Jimenez and Stone-Jimenez 24 ).
On the basis of our key findings we identify three policy and programme priorities:
-
1. Programmes for the detection and treatment of severely wasted children need to prioritize very young children (0–11 months), particularly in the Western region. Bhutan should consider adopting the community management of acute malnutrition (CMAM) approach for the early detection and care of children with severe wasting. Over fifty countries have adopted this approach( 25 , 26 ). CMAM should be scaled up as part of a continuum of care for the prevention and treatment of undernutrition in infancy and early childhood.
-
2. Programmes for the prevention of child wasting need to prioritize the improvement of complementary foods and feeding practices. There is agreement on the population-based indicators – timely introduction, feeding frequency, diet diversity, safe and responsive feeding – that should inform programme design and monitoring( Reference Daelmans, Dewey and Arimond 27 , 28 ). A nutrition surveillance system that provides information on these indicators – many of which were not included in BMIS 2010 – as well as information on seasonal and geographical variations in household food insecurity and child growth should inform a nationwide effort to improve children’s access to age-appropriate nutritious complementary foods.
-
3. Programmes for the prevention of wasting need to ensure that women have access to information and support. While national efforts on girls’ education are scaled up, attention needs to be provided to mothers with no/less formal education through supportive interventions like antenatal care. Our analysis shows that mothers’ access to antenatal care was associated with a significantly lower risk of severe wasting in children, while being weighed at birth (a proxy for access to skilled delivery) was positively associated with WHZ in children. Antenatal and perinatal care provide an important platform to ensure that pregnant women receive counselling and support to improve the diets of their children in the first months of life.
Previous analyses have shown that better antenatal and perinatal care for women during pregnancy and delivery and appropriate complementary feeding for children in the first 2 years of life were also protective against child stunting in Bhutan( Reference Aguayo, Badgaiyan and Paintal 29 ).
Conclusion
We analysed a nationally representative sample of 2028 children aged 0–23 months to characterize the epidemiology of wasting in Bhutan. We found that the prevalence of wasting was significantly higher among infants aged 0–11 months and children from the Western region. Poor feeding practices were among the most significant predictors of wasting and severe wasting, particularly among infants 0–11 months old. Prelacteal feeding in the first days of life and late introduction of complementary foods more than doubled the odds of severe wasting. Programmes for the prevention of child wasting in Bhutan need to prioritize the improvement of complementary foods and feeding practices in children aged 6–23 months, while programmes for the detection and treatment of severely wasted children need to prioritize very young children (0–11 months), particularly in the Western region.
Acknowledgements
Financial support: This research received no specific grant from any funding agency in the public, commercial or non-for-profit sectors. Conflict of interest: No conflicts to declare. Authorship: V.M.A. designed the study and led data analysis, data interpretation and manuscript writing; N.B. led data management; L.D. contributed to data interpretation. All authors have read and approved the final manuscript. Ethics of human subject participation: Ethical approval was not required. Disclaimer: The opinions expressed on this paper are those of the authors and do not necessarily represent an official position of the organizations with which they are affiliated.


