Introduction
There is a strong link between the agricultural sector and that of the energy sector. Agriculture is both a producer as well as a consumer of energy (Zangeneh et al., Reference Zangeneh, Omid and Akram2010). Although agriculture is not the largest energy-consuming sector, all its agricultural operations are energy-intensive. Agriculture uses both commercial and non-commercial energy directly or indirectly (Omid et al., Reference Omid, Ghojabeige, Delshad and Ahmadi2011). Increasing demand for food has diverted attention to modern agricultural methods to increase yield. The drive for enhancement in agricultural yield can be ensured by either increasing input use or by optimizing input use in agricultural production systems (Khoshnevisan et al., Reference Khoshnevisan, Rafiee, Omid and Mousazadeh2013). The aspiration of countries for self-sufficiency in food production and to expand their role in the international market has led to elevating the use of modern agriculture methods (Imran et al., Reference Imran, Ozcatalbas and Bashir2020). Due to heavy reliance on fuel and other commercial energies, energy has become an important element of modern agriculture (Khoshnevisan et al., Reference Khoshnevisan, Rafiee, Omid and Mousazadeh2013).
Increased use of energy in agriculture is credited to constant growth in population, finite cultivable land supply and growing desires for higher living standards (Khoshnevisan et al., Reference Khoshnevisan, Rafiee, Omid and Mousazadeh2013). During 1900–2000, there has been an 80–100% increase in cultivable area and a sixfold increase in on-farm energy production, while energy consumption in the same period has increased 85-folds (Safa et al., Reference Safa, Samarasinghe and Mohssen2011). In China, there was a 100-time increase in fossil fuel energy use in fertilizer and pesticides production, along with irrigation between 1955 and 1992 (Pimentel et al., Reference Pimentel, Marklein, Toth, Karpoff, Paul, Mccormack, Kyriazis and Krueger2009). A study by Canakci et al. (Reference Canakci, Topakci, Akinci and Ozmerzi2005) stated that a large proportion (60–90%) of energy used in agricultural production is from non-renewable resources. The increasing use of energy from non-renewable sources has an adverse impact on the sustainability of the system and will decrease production (Moore, Reference Moore2010).
After green revolution, production per area increased with an influx of inputs and mechanization (Ziaei et al., Reference Ziaei, Mazloumzadeh and Jabbary2015). This led to increased use of undesirable inputs mainly due to a lack of technical knowledge of farmers. Evidence shows that excessive use of input has adversely impacted production in some cases apart from other related problems (Omani and Chizari, Reference Omani and Chizari2008). Among other inputs, increased use of energy input has created many environmental hazards. Furthermore, this has resulted in a loss of biodiversity, and the use of chemical fertilizer and pesticides has caused pollution of the aquatic environment (Nemecek et al., Reference Nemecek, Dubois, Huguenin-Elie and Gaillard2011). Agricultural operations using fossil fuels also contributes to the emission of different greenhouse gases such as carbon dioxide (CO2), nitrous oxide (N2O) and methane (CH4) (IPCC Reference Parry, Canziani, Palutikof, van der Linden and Hanson2007). Excessive or over-use of chemical fertilizer causes loss of nutrient element and they contribute to non-point source pollution (Liu et al., Reference Liu, Zhang, Wang, Chen and Shen2013), degrading the quality of water and soil (Ju et al., Reference Ju, Kou, Christie, Dou and Zhang2007) and surge in air emissions (Wang et al., Reference Wang, Zhang and Mu2008). Moreover, pesticides use in crop production is responsible for the pollution of water, air and soil (Toan et al., Reference Toan, Sebesvari, Bläsing, Rosendahl and Renaud2013). Forestry and land use contribute 24% of total global greenhouse gases emission (GHG), and GHGs are responsible for global warming.
Agriculture provides food and fiber which are vital for human existence; therefore, sustainable agriculture is not just related to economic development alone but very crucial for human survival. Hence, there is a two-way relationship between sustainable agriculture and sustainable environment. The environment has a great influence on agriculture as agriculture depends on the environment in many ways and this dependence is greater than that of the other sectors. Therefore, for sustainable agriculture, efficient use of energy is considered an essential condition (Uhlin, Reference Uhlin1998). For sustainable agriculture development, energy efficiency is important because it ensures competitiveness, economic saving, profitability, conservation of resources and reduction in environmental pollution (Taghavifar and Mardani, Reference Taghavifar and Mardani2015).
Wheat is a popular crop in many parts of the world, and it contributes significantly toward livelihood and food security at regional as well as global level. Wheat is a basic nutrient of approximately 50 countries and provides 1/5th of daily calorie and protein requirements of human beings (Reynolds, Reference Reynolds2010; Unakitan & Aydin, Reference Unakitan and Aydin2018). Like other agricultural crops, the use of energy has increased in wheat manifolds. Wheat has also become a highly energy-intensive crop because of the introduction of high yielding varieties and the intense use of chemical fertilizers and biocides. Moreover, high growth in population, increased demand for food, the tendency of human beings to raise their living standards, diminishing cultivable lands and increased diesel fuel consumption due to agricultural mechanization have contributed toward intense use of energy in wheat production (Mousavi-Avval et al., Reference Mousavi-Avval, Rafiee, Jafari and Mohammadi2011a, Reference Mousavi-Avval, Rafiee, Jafari and Mohammadi2011b; Singh et al., Reference Singh, Singh and Sodhi2018; Imran et al., Reference Imran, Ozcatalbas and Bashir2020).
Problem statement
Wheat is a staple food in Turkey and Pakistan and both countries have a large area under wheat cultivation. Both countries are among the top ten producers and consumers of wheat which makes wheat an important food crop for them (Table 1). Wheat contributed 1.7% to the total GDP of Pakistan and was cultivated on 8678 thousand hectares of land in 2019. In Turkey, wheat is cultivated on an area of 7.2 million hectares, which is 69% of the area under cereal cultivation. Almost 77% of the wheat is grown in dry conditions (dependent on rainfall). The annual production of wheat was 19 million tons , which was sufficient to meet domestic demand. Although the share of wheat in total exports is low, its export value is UD$15.03 million. However, the export value of wheat products (flour, bulgur, semolina, pasta, cake-biscuit, etc.) is US$2.61 billion (TURKSTAT, 2018). In this context, according to International Trade Center (ITC) data, Turkey is ranked first in world flour and bulgur exports, and second in pasta exports (ITC, 2018). Wheat is an important crop in agriculture sector, which contributes 0.6% to GDP (TMO, 2018; FAO, 2021). Average production in Pakistan and Turkey is 2.87 and 2.64 metric tons per hectare, respectively, and which is low as compared to the world average of 4.074 mt ha−1 (TMO, 2018). Turkey is self-sufficient in wheat production and meets its demand from domestic production. Until recently Pakistan was producing surplus wheat and mostly supplying the surplus to Afghanistan. However, in the year 2019–2020, Pakistan has seen a dramatic surge in the prices of wheat flour right after harvesting season which enforced the government to intervene in the market and import wheat from other countries in order to increase supply and reduce the cost of wheat in the country. To avoid a shortage of wheat in the year 2021, the Government of Pakistan has taken several steps such as increasing the support price from RS 1300/40 kg to 1800/40 kg and embarking on extensive campaign by the agricultural extension department to increase wheat cultivation in the country.
Table 1. Production and area of wheat in the world (2018–19)
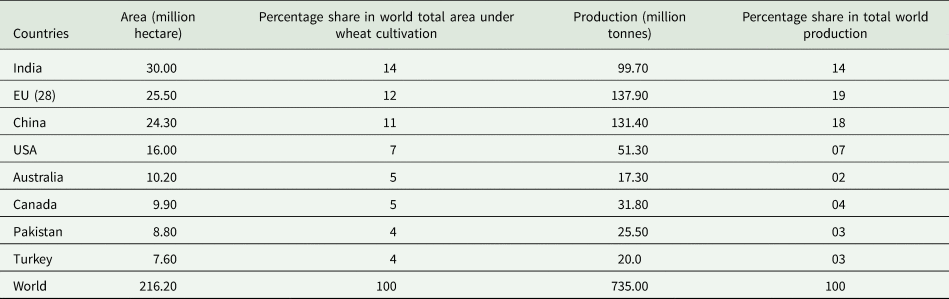
Source: IGC, 2019.
Wheat is grown in both irrigated and rainfed areas in both countries. A significant proportion of land area is under rainfed production system in both countries (ranging from 25 to 80% total wheat area). Apart from diesel fuel for irrigation, there is the intensive use of fertilizer in rainfed wheat production. To increase yield, farmers rely on chemical fertilizers, especially nitrogen. All these summed up the high input energy use in wheat production. Increased demand for wheat grains has many implications for energy use in both countries, as both countries heavily rely on imported energy. Therefore, this study explored and compared input energy use in rainfed wheat production in Pakistan and Turkey. This study is different from previous studies on the same subject in two different aspects. First, previous studies such as Shahan et al. (Reference Shahan, Jafari, Mobli, Rafiee and Karimi2008), Tipi et al. (Reference Tipi, Çetin and Vardar2009), Cicek et al. (Reference Cicek, Altintas and Erdal2011), Gökdoğan and Sevim (Reference Gökdoğan and Sevim2016), Yildiz (Reference Yildiz2016), and Unakitan and Aydin (Reference Unakitan and Aydin2018) have used simple energy input-output analysis or economic analysis, while a more advance technique of efficiency is employed in this study. Secondly, this study provided energy efficiency comparison of two developing countries.
Conceptual framework
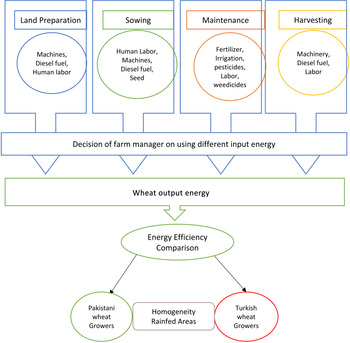
Agricultural operation in wheat production starts from land preparation and ends with harvesting. The farm manager (wheat grower) is a decision maker, who at different stages of production makes a decision about the quantity of each input to be used. The decision about the quantity of inputs differentiates the wheat growers from each other. How efficiently they take decision of using the input will increase their efficiency in wheat production. Among other components of wheat production given in Figure 1, the farm manager has control over only one component, input energy. For example, how much seed will be used, how much fertilizer should be applied, how much pesticides should be applied, etc., is in control of the farm manager.

Fig. 1. Conceptual framework.
Material and method
Study area and sample size
Punjab province in Pakistan is famous for crop production and has the highest share in national wheat production. On the other hand, Antalya in the Mediterranean region of Turkey contributes significantly to national wheat production. The first reason for selecting the provinces was their share in national wheat production. Secondly, areas from both provinces almost have the same climatic conditions such as the average temperature varies from 39 to 104°F. Finally, wheat production in both areas is dependent on rainwater. The rainfed areas from the two provinces of Punjab (Pakistan) and Antalya (Turkey) were purposively selected for the study. Afterwards, the districts having the largest cultivated area under wheat were selected, then the smallest administrative units such as ‘Tehsils’ based on the number of wheat producers were chosen. At the third stage, the list of villages was obtained from the local agriculture department, and those villages contributing maximum in wheat production of provinces were determined. In the end, information about the wheat growers and the farm area cultivated under wheat was used to extract the final sample size by applying the sampling formula given below (Yamane, Reference Yamane1967; Kizilaslan, Reference Kizilaslan2009). The sample size of Pakistani wheat growers was determined to be 115, and of Turkish growers was 119. To keep balance in the number of wheat growers, a total of 119 wheat growers from both provinces were included in the final sample size. Using a multistage sampling technique, 119 wheat growers from Antalya in Turkey, and 119 wheat growers from Punjab in Pakistan were directly interviewed.

where N is the number of wheat farmers in the area, s is the standard deviation in the area under wheat, t is the t value at 95% confidence interval, d is the error, and n is the required sample size. The sample size was found to be 119 by setting permissible error in the sample size at 5% for 95% confidence.
Data collection
The data were collected in both countries from randomly selected wheat growers by face-to-face interview technique. Information on wheat production and management practices was collected using a well-structured and validated questionnaire. The quantification of energy inputs was based on the cultivation and harvesting practices adopted by the individual wheat grower. Energy inputs used in wheat production vary from human labor to machinery, and chemical fertilizers to fuel, and so on. Furthermore, the data were gathered regarding each stage of wheat production, viz., sowing, weeding, fertilization and harvesting. For sowing stage, the data regarding land preparation, diesel fuel consumption, seed rate and its treatment, labor use, and basal fertilizer quantity and so on were collected. Similarly, information regarding the quantity of fertilizer use after sowing, labor use for applying fertilizer in mid-season of wheat growth or production was gathered. Also, information regarding the harvesting stage such as harvesting method, the yield of wheat and quantity of wheat straw was also collected. Moreover, the quantity of farmyard manure applied on wheat field was also collected.
Estimation of input energy and energy indices
The different physical inputs applied at the three stages of wheat cultivation were determined and multiplied by their energy coefficients to calculate the input energy equivalents. Information presented in Table 2 describes the input energy coefficients used in the cultivation of wheat.
Table 2. Energy equivalents of inputs and outputs in wheat cultivation

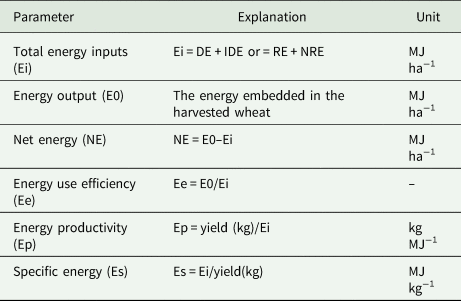
To have a standard unit of energy in milli joule per hectare (MJ ha−1), the quantity of inputs used per hectare was multiplied with their corresponding energy equivalents. The energy efficiency of wheat was calculated by considering energy indices such as energy use efficiency, energy productivity, and net enegry.. The efficiency of energy use in wheat production was calculated using input-output ratio. This method has been used in many developing countries to assess the effectiveness of crop production (Khojastehpour et al., Reference Khojastehpour, Nikkhah and Hashemabadi2015). Energy use in wheat production can be divided into four categories, direct energy (DE), indirect energy (IDE), renewable energy (RE) and non-renewable energy (NRE). These categories are further explained in Table 3.
Table 3. Explanation of energy parameters
Efficiency model for wheat growers
The energy efficiency of wheat growers was estimated using the data envelopment analysis (DEA). This energy efficiency estimation is based on the basic concept of Farrell (Reference Farrell1957), which describes the distance between input-output combination and best-practice frontier. Therefore, maximum attainable output energy from each input energy level was assumed as the best practice frontier in wheat production. The advantage of DEA over other methods is that it does not require any prior assumption on the underlying functional relationship between inputs and outputs (Mousavi-Avval et al., Reference Mousavi-Avval, Rafiee, Jafari and Mohammadi2011a, Reference Mousavi-Avval, Rafiee, Jafari and Mohammadi2011b). Likewise, the wheat growers have more control over the use of input energy as compared to the output energy from wheat. Consequently, the input-oriented DEA was established to estimate the energy efficiency scores.
The application of input-oriented DEA was for the analysis of wheat grower's efficiency in their input energy use to attain the given level of output energy. This model resulted in three types of efficiency scores such as technical efficiency (TE), which is further differentiated into pure technical efficiency (PTE) and scale efficiency (SE). According to Farrell (Reference Farrell1957), TE depicts the ability of wheat growers to use minimum input energy to reach a given level of output energy. PTE reflects the ability of wheat growers to save the input energy to attain a certain level of output energy. SE reflects the level of average productivity that a wheat grower can achieve on operating at optimal scale size (Farrell, Reference Farrell1957; Kounetas and Tsekouras, Reference Kounetas and Tsekouras2007).
At farm-level DEA, we assumed the output energy of wheat as output and all inputs energy as inputs, and there were data of K input energy and M output energy of n wheat growers. For the i th wheat grower, they are characterized by the vectors xi and yi, respectively. Therefore, the data from all the wheat growers were represented by K × N input matrix (X) and M × N output matrix (Y). The TE score of i th wheat grower was estimated by using the following functional form via linear programming.

where θ is the TE score and the vector λ is an N × 1 vector of weights which defined the linear combination of the peers of the i th wheat grower. The TE score equal to 1 describes the efficiency of wheat grower in the use of input energy to attain the given level of output energy. The TE score less than 1 describes the inefficiency of wheat growers in the use of input energy.
Considering the TE scores of wheat growers, the optimum level of different energy categories was determined. Since the wheat growers were cultivating the wheat without having perfect information about the market of inputs and outputs, we transformed Equation 1 from constant return to scale (CRS) equation to variable return to scale (VRS). This was done by adding the convexity constraint: N1λ = 1, where N1 is an N × 1 vector of ones, and λ is an N × 1 vector of constant to Equation 1. In this scenario, the energy efficiency scores were calculated by using Equation 1 under the convexity constraint added to decompose the TE scores into pure technical efficiency (PTE) and scale efficiency (SE). SE was estimated by taking the ratio of TE scores of wheat growers under CRS to TE scores under VRS. When SE = 1 at TECRS = TEVRS, then the wheat growers were scale efficient in energy use for wheat production.
Results and discussion
Energy equivalents of inputs and output in wheat production
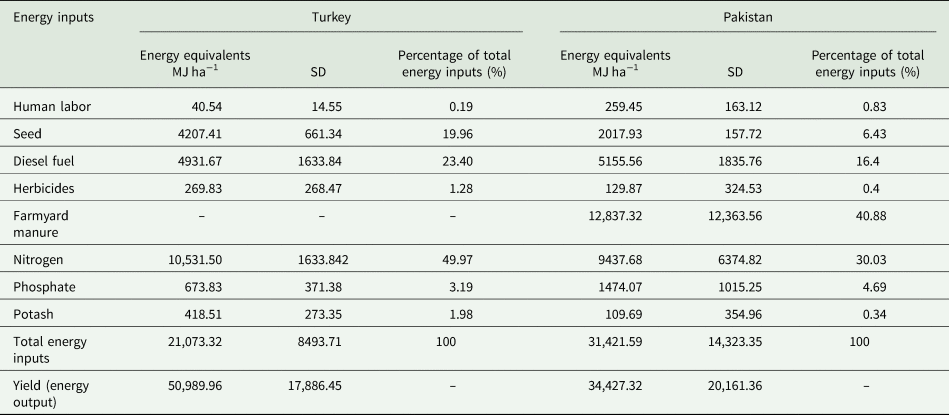
Wheat production involved the use of multiple inputs such as human labour, seed, diesel fuel, herbicides, chemical fertilizer and farmyard manure. The energy equivalents from these different energy sources for wheat cultivation are presented in Table 4. The average input energy consumption in Turkey and Pakistan was 21,073.32 and 31,421.59 MJ ha−1, respectively. In Turkey, fertilizer contributes more than 50% of total input energy followed by diesel fuel (23.40%). The N-fertilizer contributes almost 49.97% in total input energy and more than 90% in fertilizer energy followed by phosphate (3.19%). This result is in line with Canakci et al. (Reference Canakci, Topakci, Akinci and Ozmerzi2005) and Unakitan and Aydin (Reference Unakitan and Aydin2018) who earlier reported that fertilizers contributed more than 50% of total input energy used in wheat production. Furthermore, the result also supported Cicek et al. (Reference Cicek, Altintas and Erdal2011) who reported that chemical fertilizer followed by diesel fuel dominated the total input energy used in wheat production in Turkey. In Pakistan, farmyard manure (40%) commands the highest input energy use in wheat production. This was followed by chemical fertilizers (35%). Although farmyard manure has the major share in input energy used, it is just a few percentage above that of chemical fertilizers. This input is commonly used in each crop cultivation in Pakistan which has a major share in input energy. Commonly, the wheat growers were using the highest input energy from fertilizer as compared to the other input energy. Ashraf et al. (Reference Ashraf, Mahmood, Sultan, Banaeian, Usman, Ibrahim and Khan2020) described a similar result in five different wheat cultivation scenarios. They stated that fertilizer is one of the major input energy sources used in all five different scenarios of wheat cultivation. They found the fluctuation between 31 and 40% of fertilizer in total input energy in five different wheat cultivation scenarios. Worldwide, a similar pattern of input energy consumption was observed which described that fertilizer has the highest share in input energy use for wheat cultivation (Mani et al., Reference Mani, Kumar, Panwar and Kant2007; Singh et al., Reference Singh, Singh, Kushwaha and Singh2007; Safa et al., Reference Safa, Samarasinghe and Mohssen2011; Soltani et al., Reference Soltani, Rajabi, Zeinali and Soltani2013; Yuan et al., Reference Yuan, Peng, Wang and Man2018). In comparison, Turkish wheat growers were using low overall input energy than their Pakistani counterpart. Also, the highest share in energy consumption in Turkey comes from N-fertilizer while in Pakistan, it comes from FYM. As presented in Table 4, the Turkish wheat growers were producing 50,989.96 MJ ha−1 of output energy while Pakistani wheat growers produced 34,427.32 MJ ha−1.
Table 4. Energy equivalents of inputs and output in wheat production in Turkey and Pakistan
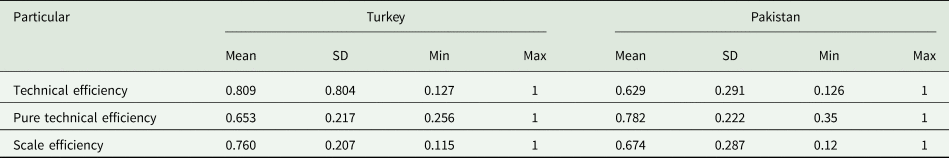
The average efficiency of wheat producers
Based on the input-output energy combinations and the result of DEA, the Turkish wheat growers were more technically efficient as compared to Pakistani wheat growers as presented in Table 5. However, Turkish wheat growers still have the chance of saving almost 19% input energy without compromising the current output energy level. The Pakistani wheat growers could save 37% input energy to produce the current level of output energy from wheat. The main reason for low technical efficiency of Pakistani wheat growers was scale efficiency. Therefore, they could increase their efficiency by increasing the size of the operation. The Turkish wheat growers were poor technically (means low PTE) in using the input energy mixes. Therefore, they can increase their efficiency by using adequate quantities of different inputs in the production of wheat. For instance, the growers need to reduce the excess use of chemical fertilizer to become more efficient.
Table 5. Average efficiency of wheat producers
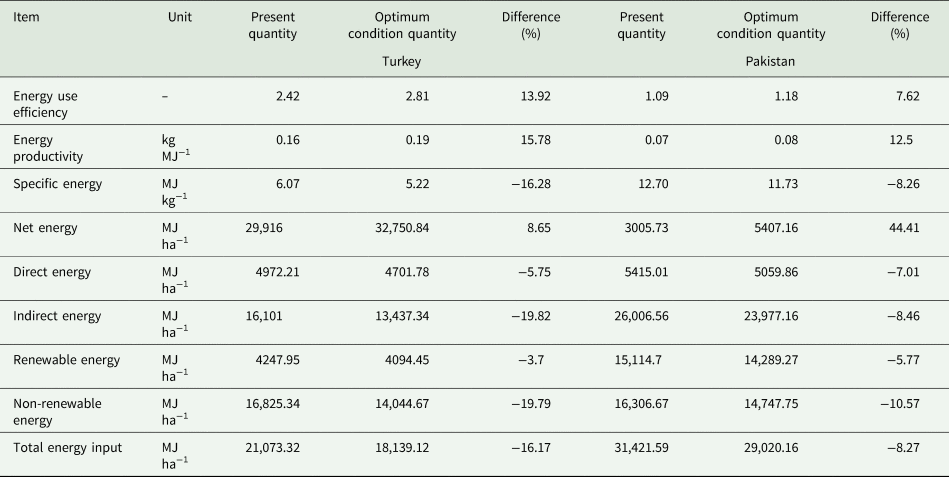
Present and optimized energy indices for wheat production
Table 6 describes the different energy indices. The analysis of the ratios between energy inputs and energy outputs can help in assessing the energy efficiency of the agricultural system (Taghavifar and Mardani, Reference Taghavifar and Mardani2015). The energy use efficiency of Turkish wheat growers (2.42) was significantly greater than that of Pakistani wheat growers (1.09). The energy productivity of Pakistani growers (0.07) was also very low as compared to Turkish wheat growers (0.16). If Turkish and Pakistani wheat growers reduce their inputs by 19 and 37%, respectively, and used optimal quantities of energy inputs, they could increase their energy use efficiency (Turkish = 13.92% and Pakistan = 7.62%) and energy productivity (Turkish = 15.78% and Pakistan = 12.5%). The higher specific energy of Pakistani growers (12.70 MJ kg−1) than Turkish growers (6.07 MJ kg−1) describes that they were consuming more input energy to produce 1 kg of wheat. Unakıtan and Aydın (Reference Unakitan and Aydin2018) calculated the specific energy in wheat cultivation to equal 5.16 MJ kg−1 which describes that 5.16 MJ energy is required to produce 1 kg of wheat. Abbas et al. (Reference Abbas, Waseem and Yang2020) reported that in Pakistan the wheat growers were consuming 6.99 MJ of input energy to produce 1 kg of wheat in irrigated areas. No study was found regarding input energy used for wheat cultivation in Pakistani rainfed areas. The Pakistani wheat growers were consuming more direct, indirect, renewable and non-renewable energy than those consumed by the Turkish wheat growers. The difference between the present and optimal quantity of total input energy describes that the Turkish growers could save 16.17% and Pakistani growers could save only 8.27%.
Table 6. Present and optimized energy indices for wheat production
Evaluation of input energy saving in wheat cultivation
The input energy-saving assessment was conducted, and the result was presented in Table 7. In the case of Turkish wheat cultivation, the labor energy-saving potential was smallest (2.07 MJ ha−1) in labor and largest (2169.97 MJ ha−1) in nitrogen. This result implies that Turkish wheat growers could save approximately 14% input energy by using the optimal quantities of the inputs for wheat cultivation. Moreover, they should apply the nitrogen quantity to the optimum to save the maximum energy.
Table 7. Actual energy use and energy saving from different energy inputs in wheat cultivation
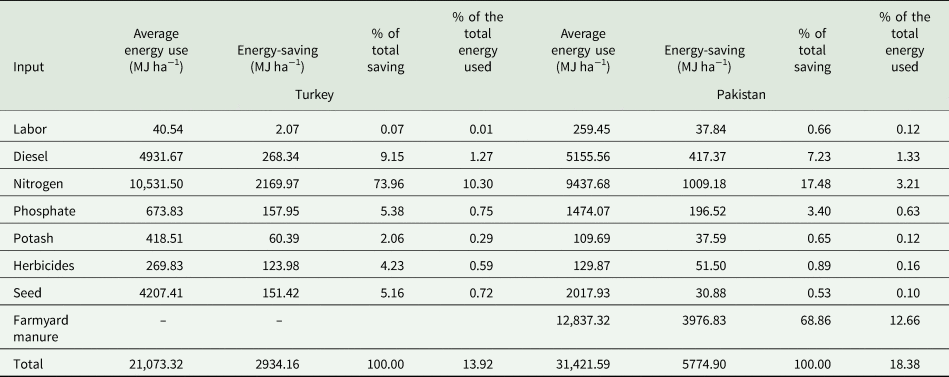
In the case of Pakistan, the potential for energy saving was smallest from seed energy (30.88 MJ ha−1) and largest from farmyard manure energy (3976.83 MJ ha−1). Therefore, the Pakistani wheat growers need to optimize the use of FYM and nitrogen in wheat cultivation.
Conclusion and recommendation
This comparative study reveals that the wheat growers from the study areas of both countries are using the same input energies in wheat cultivation except FYM in case of Pakistan. The largest input energy consumption in Turkey is nitrogen fertilizer, while in Pakistan it is FYM. The efficiency analysis describes that the Turkish wheat growers are more technically efficient than the Pakistani wheat growers. However, the Turkish growers still have a need of improving their pure technical efficiency to maximize their production efficiency. Similarly, the main reason for low technical efficiency of Pakistani wheat growers is poor scale efficiency. It is concluded that the energy use efficiency, energy productivity, net energy and specific energy, as well as all the other categories of energy such as direct, indirect, renewable and non-renewable energy, can be augmented by using the optimal level of input quantities in both countries. The Turkish growers should focus on optimizing nitrogen fertilizers use which has the largest energy-saving potential. The Pakistani growers should focus on FYM and nitrogen which have the largest energy-saving potential. The optimized use of energy inputs can improve energy indices and energy balance in both countries. Based on the results from the input-output analysis, it can be said that Pakistani farmers need to learn some modern agricultural methods for increasing their wheat yield. Currently, compared to Turkish farmers, Pakistani farmers are using more energy inputs per kilogram of wheat produced and getting fewer energy outputs per MJ of energy inputs used. Scientists and researchers from both countries should work on transferring energy-efficient agricultural practices from one country to the other.