Original text and correction:
The authors mistakenly used “mg/d” instead of “g/d” to express the unit of alcohol; please see corrections below.
ORIGINAL TEXT (page 2562, Methods)
Alcohol intake was categorized into five categories: non-drinkers or drinkers (<2·9, 2·9 to <15·8, 15·8 to <44·7 or > = 44·7 mg/d).
CORRECTION
Alcohol intake was categorized into five categories: non-drinkers or drinkers (<2·9, 2·9 to <15·8, 15·8 to <44·7 or > = 44·7 g/d).
ORIGINAL TEXT (page 2563, Results)
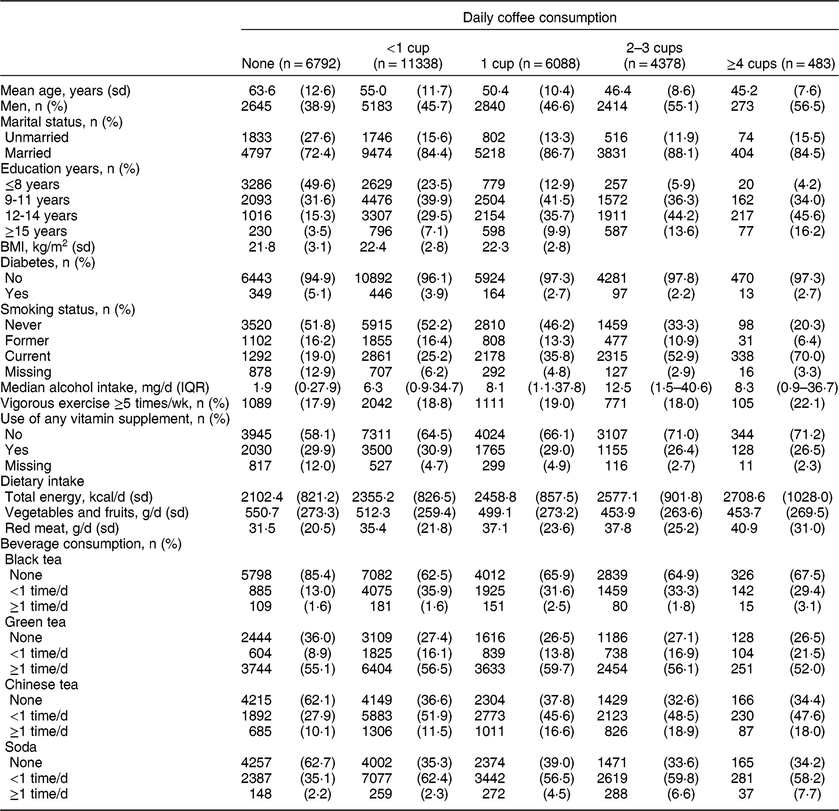
Table 1 Baseline characteristics of total participants according to daily coffee consumption

Abbreviation: n, number; sd, standard deviation; BMI, body mass index; IQR, interquartile range; d, day; wk, week; h, hour
CORRECTION
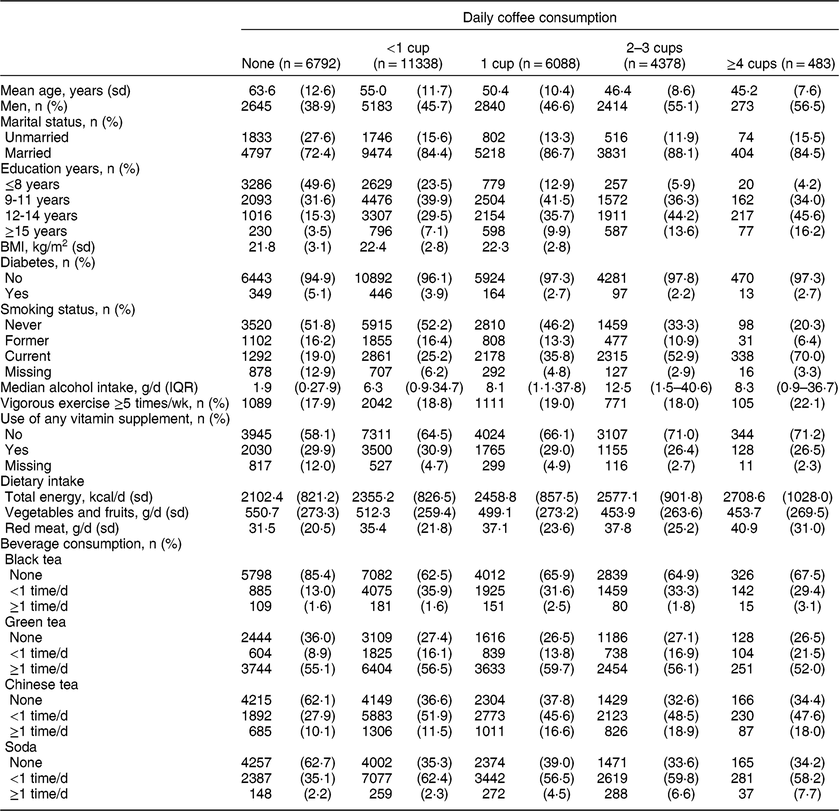
Table 1 Baseline characteristics of total participants according to daily coffee consumption

Abbreviation: n, number; sd, standard deviation; BMI, body mass index; IQR, interquartile range; d, day; wk, week; h, hour
Supplementary material
To view supplementary material for this paper, please visit https://doi.org/10.1017/S1368980019004567


