


Symbols
- A
-
actuator area, m2
- b
-
ratio of buoyancy to its value at the zero
 $\varDelta$
P altitude, B/B
0
$\varDelta$
P altitude, B/B
0
- B
-
buoyant force, N
- c P
-
specific heat and constant pressure, J kg−1 K−1
- C D
-
drag coefficient
- e
-
non-dimensional elasticity parameter defined by Equation (8)
- E
-
modulus of elasticity of wall material, Pa
- F D
-
drag force, N
- g
-
gravitational acceleration at balloon float altitude N kg−1
- k P
-
ratio of total propeller (or rotor) power to ideal induced power
- L
-
atmospheric lapse rate, K m−1
- m
-
mass of gas, kg
- M
-
mass of balloon, kg
- p
-
ratio of ambient pressure to its value at the zero
$\varDelta$
P altitude, P/P
0
- P
-
ambient pressure, Pa
- r
-
balloon radius, m
- R
-
gas constant, J kg−1 K−1
- t
-
wall thickness, m; or time, s
- T
-
gas temperature, K
- v
-
ratio of envelope volume to its value at the zero
$\varDelta$
P altitude, V/V
0
- V
-
envelope volume, m3
- w
-
vertical wind velocity, ms−1
- W
-
work done, J
- z
-
altitude, m
-
$\gamma$
-
ratio of specific heats of helium
-
$\zeta$
-
permeance, kg s−1 Pa−1 m−2
-
$\lambda$
-
scale factor
-
$\upsilon$
-
Poisson ratio of wall material
-
$\rho$
-
gas or ambient density, kg m−3


Acronyms
- EFA
-
equilibrium float altitude
- PAB
-
pressurised anchor balloon
- PIB
-
pressurised internal balloon
- SPB
-
super-pressure balloon
- VPA
-
vertical propulsive assist
- ZPB
-
zero-pressure balloon
1.0 Introduction
Some recent proposals for scientific exploration of the cloud layers of Venus call for balloon platforms (e.g. Refs. [Reference Seager, Petkowski, Carr, Grinspoon, Ehlmann, Saika, Agrawal, Buchanan, Weber, French, Klupar, Worden and Baumgardener1–Reference Arredondo, Hodges, Abrahams, Bedford, Boatwright, Buz, Clayton Cantrall, Clark, Erwin, Krishnamoorthy, Magaña, McCabe, McIntosh, Noviello, Pellegrino, Ray, Styczinski and Weigel5]) capable of flight endurances far greater than offered by descent probes. Of particular interest is the sampling and measurement of aerosol particles in the middle cloud layer, at 50–65 km altitude, where the ambient pressures and temperatures are comparable to those in Earth’s troposphere and the existence of microbial life is plausible [Reference Seager, Petkowski, Carr, Grinspoon, Ehlmann, Saika, Agrawal, Buchanan, Weber, French, Klupar, Worden and Baumgardener1]. Various Venus-balloon mission profiles have been advocated with the most demanding ones specifying the execution of multiple vertical cloud layer traverses upon command (e.g. Refs. [Reference Gilmore, Beauchamp, Lynch and Amato3, Reference Arredondo, Hodges, Abrahams, Bedford, Boatwright, Buz, Clayton Cantrall, Clark, Erwin, Krishnamoorthy, Magaña, McCabe, McIntosh, Noviello, Pellegrino, Ray, Styczinski and Weigel5]) and/or the achievement of several near-equatorial circumnavigations with endurances of up to two weeks (e.g. Ref. [Reference Arredondo, Hodges, Abrahams, Bedford, Boatwright, Buz, Clayton Cantrall, Clark, Erwin, Krishnamoorthy, Magaña, McCabe, McIntosh, Noviello, Pellegrino, Ray, Styczinski and Weigel5]).
Many different possible Venus atmosphere platform options have been previously outlined [Reference Dorrington6]. In this study, four different balloon-type options are considered (Fig. 1):
-
(i) super-pressure balloon (SPB)
-
(ii) zero-pressure balloon (ZPB) with a pressurised anchor balloon (PAB)
-
(iii) ZPB with a pressurised internal ballonet (PIB)
-
(iv) ZPB with vertical propulsive assist (VPA)
Attention is focused on a mission profile that closely matches the trajectory data derived from the 1985 nightside flights of the VEGA 1 and VEGA 2 balloons [Reference Sagdeev, Linkin, Blamont and Preston7]. These helium-filled SPBs had inherent vertical stability that helped them to maintain a near-constant float altitude in an atmosphere with strong vertical wind gusts. In contrast, the alternative options, ii-iv (above), all need to employ active control mechanisms and they each require power input implying an associated mass penalty, potentially reducing the maximum feasible scientific payload mass.
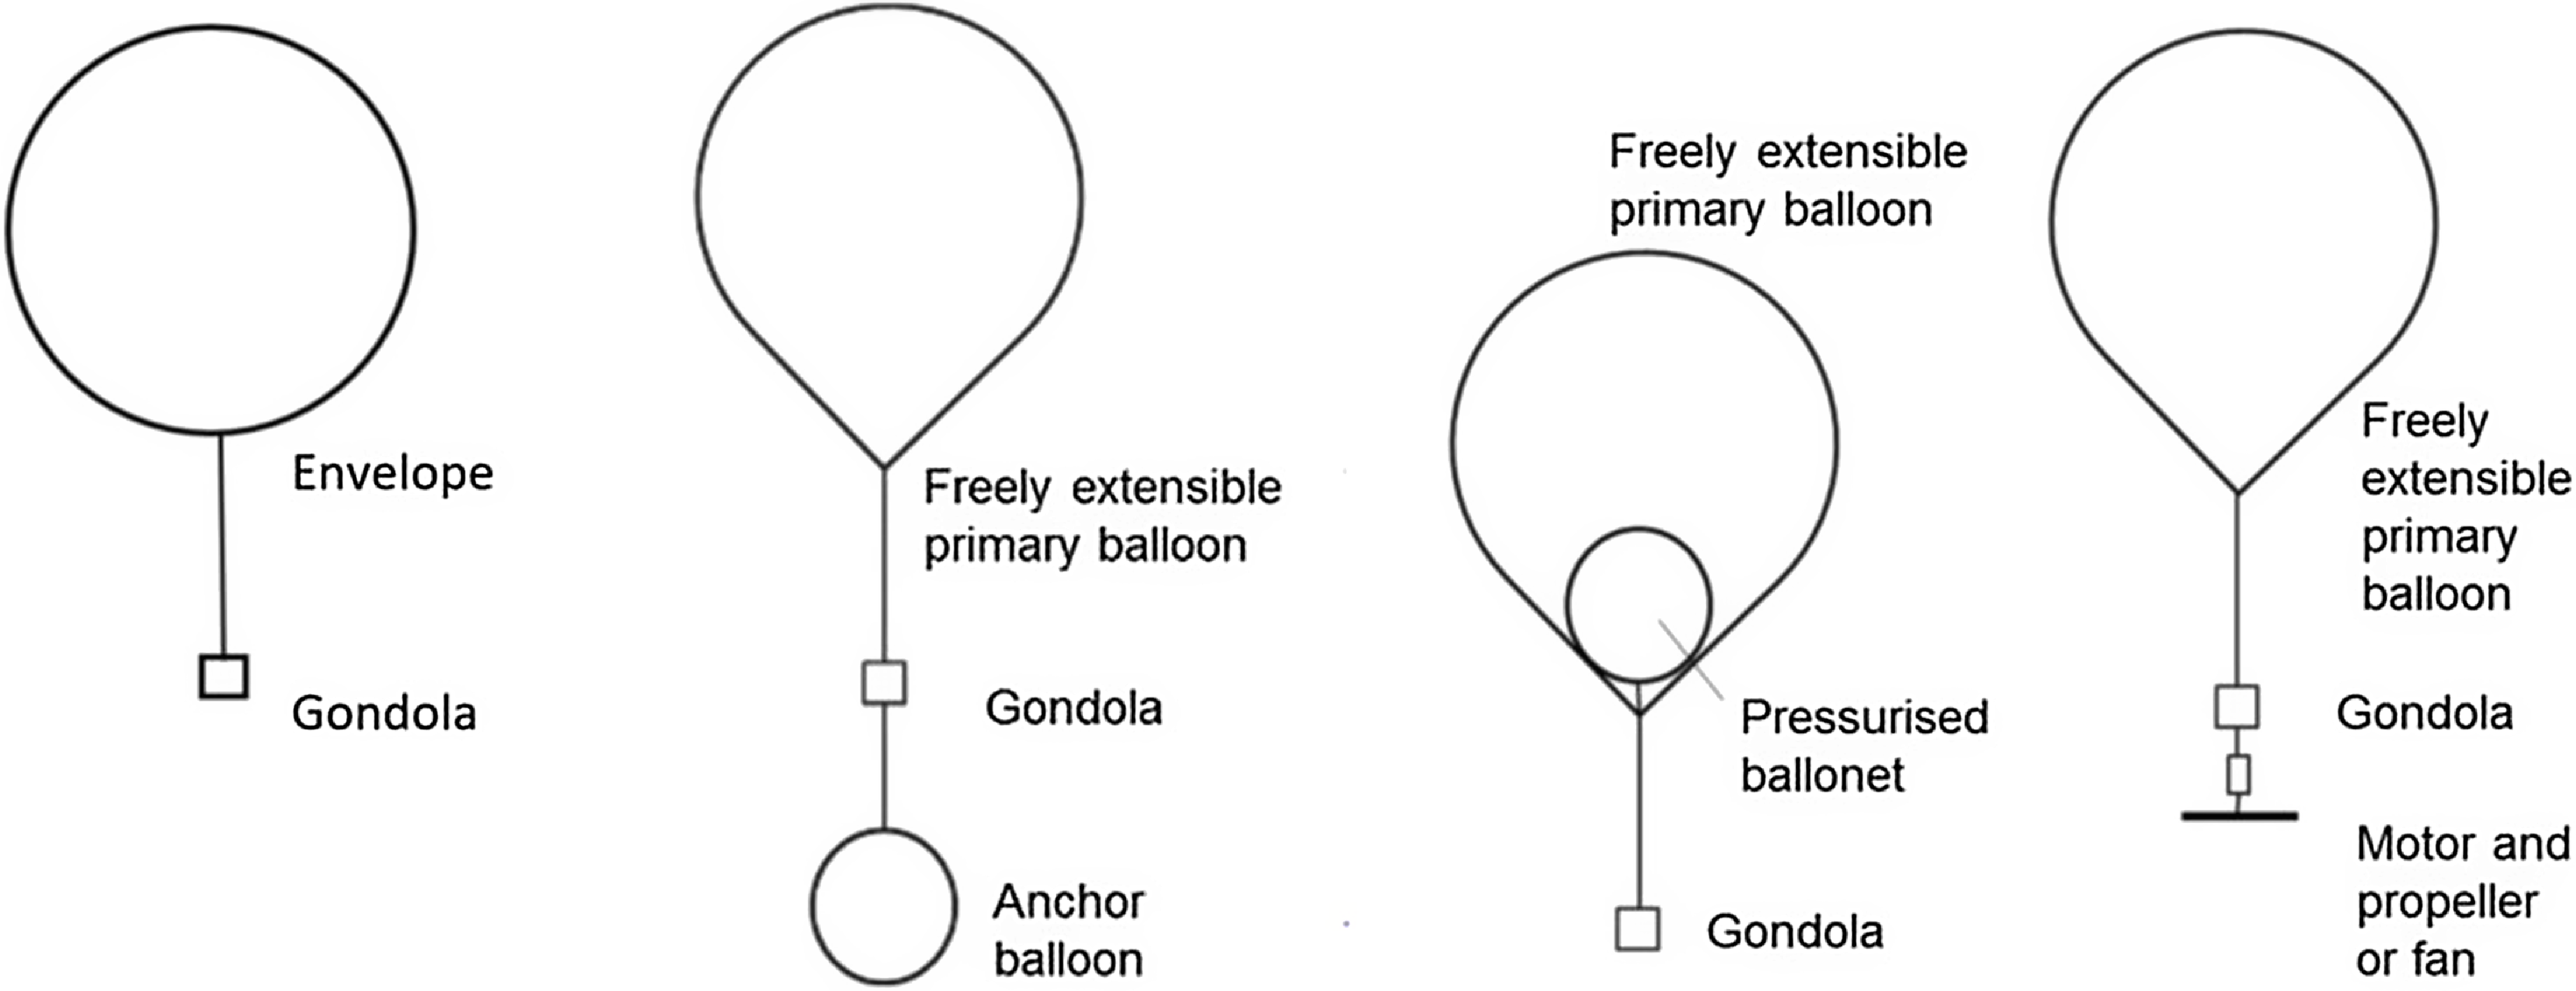
Figure 1. Balloon Options, from left to right: SPB; ZPB-PAB; ZPB-PIB: ZPB-VPA.
To quantify the energy input needed to control options ii-v (above), it is necessary to quantify the vertical wind profile in the Venus atmosphere and the buoyancy variation of the VEGA SPBs. Consequently, in the following section, some general aspects of the modelling of the VEGA balloon flights are redescribed, and some analytical approximations for the buoyancy variation of VEGA SPBs are presented. In Section 3 expressions for the work inputs required to operate the compression devices for the ZPB-PAB and ZPB-PIB options are derived, and energy estimates are obtained. This estimation task is performed by assuming these platform options each maintain the same nightside flight trajectories as per the VEGA balloons, i.e. are subject to the exact same derived vertical wind velocity profiles. In a similar manner, the energy input for the ZPB-VPA option is also estimated and found to be comparable with the ZPB-PAB/PIB options. Finally, it is found that the mass penalty associated with the energy requirement to operate the ZPA-VPA is relatively small compared to the mass saving that could be achieved, e.g. by adopting a lighter envelope wall.
2.0 Modelling of the vega balloon flights
2.1 Structure of the middle atmosphere of Venus
In the analysis presented below, the composition of the Venus middle atmosphere is treated as having a simple composition of 96.5% carbon dioxide and 3.5% nitrogen, with a constant gas constant, R
 $\thickapprox$
191.4 J kg−1 K−1. The atmosphere is assumed to be in hydrostatic equilibrium, i.e. the change in ambient pressure, P, with altitude, z, is prescribed by, dP/dz = -
$\thickapprox$
191.4 J kg−1 K−1. The atmosphere is assumed to be in hydrostatic equilibrium, i.e. the change in ambient pressure, P, with altitude, z, is prescribed by, dP/dz = -
 $\rho$
∞
g, where
$\rho$
∞
g, where
 $\rho$
∞
is the local ambient density. At latitudes less than 30° and within the altitude range of interest, the ambient temperature varies from about 300 to 350 K and the pressure from about 0.5 to 1.0 bar [Reference Linkin, Kerzhanovich, Lipatov, Shurupov, Seiff, Ragent, Young, Ingersoll, Crisp, Elson, Preston and Blamont8, Reference Zasova, Moroz, Linkin, Khatuntsev and Maiorov9]. Consequently, the ideal gas law is deemed to be adequate and used throughout. The atmospheric lapse rate, L, in this altitude range is close to the adiabatic value, i.e. the atmosphere is neutrally stable with L
$\rho$
∞
is the local ambient density. At latitudes less than 30° and within the altitude range of interest, the ambient temperature varies from about 300 to 350 K and the pressure from about 0.5 to 1.0 bar [Reference Linkin, Kerzhanovich, Lipatov, Shurupov, Seiff, Ragent, Young, Ingersoll, Crisp, Elson, Preston and Blamont8, Reference Zasova, Moroz, Linkin, Khatuntsev and Maiorov9]. Consequently, the ideal gas law is deemed to be adequate and used throughout. The atmospheric lapse rate, L, in this altitude range is close to the adiabatic value, i.e. the atmosphere is neutrally stable with L
 $\thickapprox$
g/c
p
. Using g = 8.714 N kg−1 and c
p
= 0.88 kJ kg−1 K−1, the adiabatic lapse rate is approximately 10.1 K km−1, a value that is close to the VEGA measured value, 10.17 K km−1 at 310 K [Reference Linkin, Kerzhanovich, Lipatov, Shurupov, Seiff, Ragent, Young, Ingersoll, Crisp, Elson, Preston and Blamont8], also corroborated by subsequent reports (e.g. Refs. [Reference Zasova, Moroz, Linkin, Khatuntsev and Maiorov9, Reference Ando, Imamura, Tellmann, Pätzo, Häusler, Sugimoto, Takagi, Sagawa, Limaye, Matsuda, Choudhary and Antonita10]).
$\thickapprox$
g/c
p
. Using g = 8.714 N kg−1 and c
p
= 0.88 kJ kg−1 K−1, the adiabatic lapse rate is approximately 10.1 K km−1, a value that is close to the VEGA measured value, 10.17 K km−1 at 310 K [Reference Linkin, Kerzhanovich, Lipatov, Shurupov, Seiff, Ragent, Young, Ingersoll, Crisp, Elson, Preston and Blamont8], also corroborated by subsequent reports (e.g. Refs. [Reference Zasova, Moroz, Linkin, Khatuntsev and Maiorov9, Reference Ando, Imamura, Tellmann, Pätzo, Häusler, Sugimoto, Takagi, Sagawa, Limaye, Matsuda, Choudhary and Antonita10]).
2.2 Some background on the VEGA balloon flights
The primary goal of the VEGA SPBs was to acquire measurements of the Venusian zonal winds via radio-tracking [Reference Sagdeev, Linkin, Blamont and Preston7]. They were also both fitted with a 2 kg meteorological payload intended to collect data on ambient pressure, temperature, cloud particle backscatter, light intensity variations caused by possible lightning events and the local vertical relative wind velocity measured by an anemometer [Reference Sagdeev, Linkin, Kerzhanovich, Lipatov, Shurupov, Blamont, Crisp, Ingersoll, Elson, Preston, Hildebrand, Ragent, Seiff, Young, Petit, Boloh, Alexandrov, Armand, Bakitko and Selivanov11]. The anticipated maximum flight duration of 52 h for each platform was limited by the output of the primary lithium battery supplying ∼4.5 W to the omni-directional antenna [Reference Lorenz, Crisp and Huber12, Reference Kremnev, Linkin, Lipatov, Pichkadze, Shurupov, Terterashvili, Bakitko, Blamont, Malique, Ragent, Preston, ELSON and CRISP13]. As it transpired, both platforms transmitted data over periods of ∼46 h. Ambient pressure, temperature and anemometer output were recorded every 75.4 s and transmitted in a highly compressed format, although there were some deliberate gaps when other measured data needed to be transmitted. A large portion of the data transmitted was retrieved with high confidence, although some data was lost, or was ambiguous [Reference Kremnev, Linkin, Lipatov, Pichkadze, Shurupov, Terterashvili, Bakitko, Blamont, Malique, Ragent, Preston, ELSON and CRISP13].
VEGA 1 and VEGA 2 were separately deployed at Venus midnight on 11 and 15 June 1985, at latitudes ∼7° north and ∼6° south of the equator, respectively. After separation from the descent probe and inflation with ∼2 kg of helium gas (from a jettisoned pressure tank) each balloon ascended ∼4 km, within ∼1 h, to an initial near-equilibrium float altitude of ∼54 km. Both platforms then drifted westward in the strong zonal winds covering a distance corresponding to ∼109° of longitude, before crossing the dawn terminator after ∼33 h. Over this night period, they descended from an average pressure height of ∼53.5 to ∼58 kPa with brief vertical excursions associated with derived vertical winds sometimes exceeding 1 ms−1 [Reference Linkin, Kerzhanovich, Lipatov, Pichkadze, Shurupov, Terterashvili, Ingersoll, Crisp, Grossman, Young, Seiff, Ragent, Blamont, Elson and Preston14, Reference Crisp, Ingersoll, Hildebrand and Preston15]. The largest excursion was experienced by VEGA 2, at around 36–42 h, when it descended to a pressure height as low as ∼88kPa in downward winds with a derived vertical velocity of ∼3 ms−1, a value that is relatively large compared to those measured in the Earth’s atmosphere (e.g. Refs. [Reference Li, Rapp, Stober and Latteck16–Reference Nastrom and Gage19]). After crossing the dawn terminator, the envelopes of both SPBs would have experienced solar heating resulting in expansion of the helium gas contained within them. However, since transmissions ceased soon after, the subsequent flight histories of both VEGA 1 and VEGA 2 are unknown: it is possible that either, or both, achieved one or multiple circumnavigations, or they may both have been destroyed shortly after transmission ceased.
2.3 Vertical equation of motion
Following Nastrom [Reference Nastrom20], the vertical equation of motion of a SPB may be expressed as
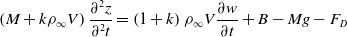 \begin{align}\left( {M + {k \rho_\infty }V} \right)\frac{{{\partial ^2}z}}{{{\partial ^2}t}} = {\left( {1 + k} \right)\rho_\infty }V\frac{{\partial w}}{{\partial t}} + B - Mg - {F_D}\end{align}
where V is the volume of the envelope, w is the vertical (positive, upward) wind velocity, B(z) =
 $\rho$
∞
Vg is the buoyant force, F
D
is the quasi-steady drag force, M is the total mass of the balloon including the gas contained within it and k is the added (also referred to as ‘virtual’ or ‘apparent’) mass coefficient. For a solid sphere in an accelerated potential (inviscid) flow, k = 0.5. In viscous flows with separation and a resulting wake, the value of k may deviate substantially from this value [Reference Wakaba and Balachandar21]; however, 0.5 is used by Linkin et al [Reference Linkin, Kerzhanovich, Lipatov, Pichkadze, Shurupov, Terterashvili, Ingersoll, Crisp, Grossman, Young, Seiff, Ragent, Blamont, Elson and Preston14] to analyse the VEGA flights and assumed herein. The flow around a sphere involves unsteady vortex shedding, but the drag force is described by the steady-flow expression,
$\rho$
∞
Vg is the buoyant force, F
D
is the quasi-steady drag force, M is the total mass of the balloon including the gas contained within it and k is the added (also referred to as ‘virtual’ or ‘apparent’) mass coefficient. For a solid sphere in an accelerated potential (inviscid) flow, k = 0.5. In viscous flows with separation and a resulting wake, the value of k may deviate substantially from this value [Reference Wakaba and Balachandar21]; however, 0.5 is used by Linkin et al [Reference Linkin, Kerzhanovich, Lipatov, Pichkadze, Shurupov, Terterashvili, Ingersoll, Crisp, Grossman, Young, Seiff, Ragent, Blamont, Elson and Preston14] to analyse the VEGA flights and assumed herein. The flow around a sphere involves unsteady vortex shedding, but the drag force is described by the steady-flow expression,
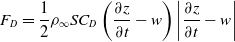 \begin{align}{F_D} = {\frac{1}{2}}\rho_\infty S{C_D}\left( {\frac{{\partial z}}{{\partial t}} - w} \right)\left| {\frac{{\partial z}}{{\partial t}} - w} \right|\end{align}
where C D is the drag coefficient (averaged over a short time period) which is a function of the Reynolds number, Re, based on the envelope diameter, 2r, and S = πr 2. Linkin et al [Reference Linkin, Kerzhanovich, Lipatov, Pichkadze, Shurupov, Terterashvili, Ingersoll, Crisp, Grossman, Young, Seiff, Ragent, Blamont, Elson and Preston14] use an approximation provided by Scoggins [Reference Scoggins22] for a smooth sphere,
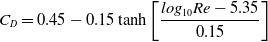 \begin{align}{C_D} = 0.45 - 0.15\tanh \left[ {\frac{{lo{g_{10}}Re - 5.35}}{{0.15}}} \right]\end{align}
For subcritical flows, when Re < 100,000, this approximation yields C
D
 $\thickapprox$
0.6. For supercritical flows, when Re > 500,000, C
D
$\thickapprox$
0.6. For supercritical flows, when Re > 500,000, C
D
 $\thickapprox$
0.3. In the altitude range of interest, the value of the ambient atmospheric dynamic viscosity is about 1.5 × 10⁻⁵ kg m−1 s−1 and for the VEGA balloons with r
$\thickapprox$
0.3. In the altitude range of interest, the value of the ambient atmospheric dynamic viscosity is about 1.5 × 10⁻⁵ kg m−1 s−1 and for the VEGA balloons with r
 $\thickapprox$
1.7 m, Re
$\thickapprox$
1.7 m, Re
 $\thickapprox$
258,000 when the relative flow speed is 1 m s−1, i.e. the flow is transitional.
$\thickapprox$
258,000 when the relative flow speed is 1 m s−1, i.e. the flow is transitional.
In order to analyse the vertical motion of any balloon platform, it is necessary to accurately know the functional dependence of buoyancy on float altitude. For a balloon with a freely extensible envelope, when the mass of the helium in the balloon is constant (no leakage), the product
 $\rho$
∞
V is invariant and the buoyancy is approximately constant, see Section 3.1. For a balloon with a non-extensible envelope, the buoyancy is dependent on
$\rho$
∞
V is invariant and the buoyancy is approximately constant, see Section 3.1. For a balloon with a non-extensible envelope, the buoyancy is dependent on
 $\rho$
∞
(z). For the VEGA SPBs, with elastic envelopes, the buoyancy is dependent on both
$\rho$
∞
(z). For the VEGA SPBs, with elastic envelopes, the buoyancy is dependent on both
 $\rho$
∞
(z) and V(z) as is presented in the next section.
$\rho$
∞
(z) and V(z) as is presented in the next section.
The VEGA balloons were not fitted with inertial sensors to determine their vertical displacement. Consequently, Linkin et al [Reference Linkin, Kerzhanovich, Lipatov, Pichkadze, Shurupov, Terterashvili, Ingersoll, Crisp, Grossman, Young, Seiff, Ragent, Blamont, Elson and Preston14] derive z in terms of pressure height and they reduce Equation (1) to the following approximation,
 \begin{align}\frac{3}{2}\frac{{d{w_{rel}}}}{{dt}} = - \frac{{{C_D}\;}}{2}\;\frac{3}{{4r}}\;\left| {{w_{rel}}} \right|{w_{rel{\rm{\;}}}}\; - \;\frac{\varDelta B}{{\rho_\infty V}}\end{align}
where
 ${w_{rel}} = w + \dot P{/\rho_\infty }g$
is the relative flow velocity and ΔB = B – Mg. When this net excess buoyancy term is small, the characteristic response time is 4r/C
D
|w
rel
|, e.g. ∼15 s when |w
rel
| =1 ms−1. For vertical gusts with periods that are more than a magnitude larger than this response time, Equation (4) becomes a terminal velocity condition where the drag term balances the excess buoyancy term. Since Linkin et al [Reference Linkin, Kerzhanovich, Lipatov, Pichkadze, Shurupov, Terterashvili, Ingersoll, Crisp, Grossman, Young, Seiff, Ragent, Blamont, Elson and Preston14] believed these conditions were satisfied by the VEGA flights they further reduce Equation (4) to
${w_{rel}} = w + \dot P{/\rho_\infty }g$
is the relative flow velocity and ΔB = B – Mg. When this net excess buoyancy term is small, the characteristic response time is 4r/C
D
|w
rel
|, e.g. ∼15 s when |w
rel
| =1 ms−1. For vertical gusts with periods that are more than a magnitude larger than this response time, Equation (4) becomes a terminal velocity condition where the drag term balances the excess buoyancy term. Since Linkin et al [Reference Linkin, Kerzhanovich, Lipatov, Pichkadze, Shurupov, Terterashvili, Ingersoll, Crisp, Grossman, Young, Seiff, Ragent, Blamont, Elson and Preston14] believed these conditions were satisfied by the VEGA flights they further reduce Equation (4) to
 \begin{align}\frac{{{C_D}\;}}{2}\;\frac{3}{{4r}}\;\left| {{w_{rel}}} \right|{w_{rel{\rm{\;}}}}\; = \;\; - \frac{\varDelta B}{{\rho_\infty V}}\end{align}
In order to obtain the vertical wind profile w(t), Linkin et al [Reference Linkin, Kerzhanovich, Lipatov, Pichkadze, Shurupov, Terterashvili, Ingersoll, Crisp, Grossman, Young, Seiff, Ragent, Blamont, Elson and Preston14] derive the variation in excess buoyancy assuming the helium gas temperature is the same as the ambient temperature, i.e. in thermal equilibrium. They also assume a linear loss of helium that is consistent with the gradual fall in the equilibrium float altitude as evidenced by periods when
 $\varDelta$
B =0. Some comments on both these assumptions are offered in the next sections.
$\varDelta$
B =0. Some comments on both these assumptions are offered in the next sections.
2.4 Buoyancy variation of super-pressure balloon (SPB) with an elastic envelope
Following Linkin et al [Reference Linkin, Kerzhanovich, Lipatov, Pichkadze, Shurupov, Terterashvili, Ingersoll, Crisp, Grossman, Young, Seiff, Ragent, Blamont, Elson and Preston14], the envelope of a VEGA-like SPB may be treated as a thin-walled spherical pressure vessel [Reference Case and Chilver24], i.e. the volumetric strain resulting from a differential wall pressure,
 $\varDelta$
P (assumed to be uniform, i.e. the same at any wall location), may be found using a linear approximation,
$\varDelta$
P (assumed to be uniform, i.e. the same at any wall location), may be found using a linear approximation,
 \begin{align}\frac{\varDelta V}{V} = 3\left( {1 - \upsilon} \right)\frac{{\varDelta P{\rm{\;}}r}}{{2Et}}\end{align}
where E is the Modulus of Elasticity of the envelope wall material,
 $\upsilon$
is its Poisson Ratio and t is the wall thickness.
$\upsilon$
is its Poisson Ratio and t is the wall thickness.
The VEGA SPBs were near-spherical with a nominal volume of about 19.4 m3. The envelope of each balloon was made from a Teflon™-coated fabric that stretched significantly when pressurised, such that during an Earth-based test the increase in volume was estimated to be 1.25 m3 at a differential pressure of 1 kPa [Reference Kremnev, Linkin, Lipatov, Pichkadze, Shurupov, Terterashvili, Bakitko, Blamont, Malique, Ragent, Preston, ELSON and CRISP13]. Using Equation (6) with
 $\varDelta$
P = 1 kPa, r
$\varDelta$
P = 1 kPa, r
 $\thickapprox$
1.667 m,
$\thickapprox$
1.667 m,
 $\varDelta$
V/V
$\varDelta$
V/V
 $\thickapprox$
0.0644 and assuming
$\thickapprox$
0.0644 and assuming
 $\upsilon$
= 0.3, yields Et
$\upsilon$
= 0.3, yields Et
 $\thickapprox$
27.2 kNm−1. In the following presentation it will be assumed that this Et value is constant. When ascending or descending in the Venus atmosphere, the material properties would have been dependent on ambient temperature variation and consequently the E value may have altered with altitude, but this alteration is ignored below.
$\thickapprox$
27.2 kNm−1. In the following presentation it will be assumed that this Et value is constant. When ascending or descending in the Venus atmosphere, the material properties would have been dependent on ambient temperature variation and consequently the E value may have altered with altitude, but this alteration is ignored below.
At some ambient pressure, P = P
0, the near-spherical envelope of the SPB will be at the zero super-pressure condition when
 $\varDelta$
P = 0, V = V
0 and the envelope has radius r = r
0. When the SPB rises, the ambient atmospheric pressure falls and
$\varDelta$
P = 0, V = V
0 and the envelope has radius r = r
0. When the SPB rises, the ambient atmospheric pressure falls and
 $\varDelta$
P > 0. In this super-pressure condition, the following non-dimensional variables are used to describe the changes in envelope volume, ambient pressure and temperature: v = V/V
0, p = P/P
0 and
$\varDelta$
P > 0. In this super-pressure condition, the following non-dimensional variables are used to describe the changes in envelope volume, ambient pressure and temperature: v = V/V
0, p = P/P
0 and
 $\tau$
= T/T
0, respectively. Similarly, non-dimensional variables are used for the temperature and mass of the lifting gas (helium) inside the envelope:
$\tau$
= T/T
0, respectively. Similarly, non-dimensional variables are used for the temperature and mass of the lifting gas (helium) inside the envelope:
 $\theta$
= T
H
/T
H0 and
$\theta$
= T
H
/T
H0 and
 $\mu$
= m
H
/m
H0, respectively.
$\mu$
= m
H
/m
H0, respectively.
Using the ideal gas equation, P
H
/P
0 =
 $\mu$
θ/v, Equation (6) may be re-written as
$\mu$
θ/v, Equation (6) may be re-written as
 \begin{align}v \thickapprox 1 + \frac{{\mu\theta}}{{ev}} - \frac{p}{e}\end{align}
where e is a non-dimensional elasticity parameter,
 \begin{align}e = \frac{{2Et}}{{3{P_0}{r_0}\left( {1 - \upsilon} \right)}}\end{align}
Equation (7) may be rearranged as a quadratic and solved [Reference Dorrington25] to yield
 \begin{align}v \thickapprox \frac{{\;\left( {e - p} \right) + \sqrt {\left[ {{{\left( {e - p} \right)}^2} + 4e\mu\theta} \right]} }}{{2e}}\end{align}
For the VEGA balloons in Venus conditions with P
0 = 70 kPa [Reference Linkin, Kerzhanovich, Lipatov, Pichkadze, Shurupov, Terterashvili, Ingersoll, Crisp, Grossman, Young, Seiff, Ragent, Blamont, Elson and Preston14], e
 $\thickapprox$
0.22.
$\thickapprox$
0.22.
For the Earth-based ground tests of the VEGA envelopes [Reference Linkin, Kerzhanovich, Lipatov, Pichkadze, Shurupov, Terterashvili, Ingersoll, Crisp, Grossman, Young, Seiff, Ragent, Blamont, Elson and Preston14], it is likely that the mass of the inflation gas in the balloon was increased with
 $\theta$
 $\thickapprox$
1 and p
$\thickapprox$
1 and p
 $\thickapprox$
1, such that in one test
$\thickapprox$
1, such that in one test
 $\mu$
$\mu$
 $\thickapprox$
1.076 and the resulting super-pressure increased by the quoted value of
$\thickapprox$
1.076 and the resulting super-pressure increased by the quoted value of
 $\varDelta$
P = 1 kPa when P
0
$\varDelta$
P = 1 kPa when P
0
 $\thickapprox$
100 kPa. The use of Equation (7) with e
$\thickapprox$
100 kPa. The use of Equation (7) with e
 $\thickapprox$
0.155 is then consistent with the measured envelope expansion, v
$\thickapprox$
0.155 is then consistent with the measured envelope expansion, v
 $\thickapprox$
1.065. It is also consistent with the quoted measurement of the envelope diameter of 3.54 m [Reference Linkin, Kerzhanovich, Lipatov, Pichkadze, Shurupov, Terterashvili, Ingersoll, Crisp, Grossman, Young, Seiff, Ragent, Blamont, Elson and Preston14] at the quoted pressure difference,
$\thickapprox$
1.065. It is also consistent with the quoted measurement of the envelope diameter of 3.54 m [Reference Linkin, Kerzhanovich, Lipatov, Pichkadze, Shurupov, Terterashvili, Ingersoll, Crisp, Grossman, Young, Seiff, Ragent, Blamont, Elson and Preston14] at the quoted pressure difference,
 $\varDelta$
P = 3 kPa, when P
0
$\varDelta$
P = 3 kPa, when P
0
 $\thickapprox$
100 kPa,
$\thickapprox$
100 kPa,
 $\mu$
$\mu$
 $\thickapprox$
1.234 and v
$\thickapprox$
1.234 and v
 $\thickapprox$
1.197.
$\thickapprox$
1.197.
In the remainder of this section, it will be assumed that the SPB does not leak, i.e.
 $\mu$
= 1 and the gravitational acceleration, g, is invariant with altitude.
$\mu$
= 1 and the gravitational acceleration, g, is invariant with altitude.
Using the ideal gas equation, the non-dimensional buoyancy is given by b = pv/
 $\tau$
. For an atmosphere with a constant lapse rate, d
$\tau$
. For an atmosphere with a constant lapse rate, d
 $\tau$
/dz = -L/T
0. Consequently, for slow changes in balloon float altitude maintaining thermal equilibrium,
$\tau$
/dz = -L/T
0. Consequently, for slow changes in balloon float altitude maintaining thermal equilibrium,
 $\theta$
 $\thickapprox$
 $\tau$
and d
$\tau$
and d
 $\theta$
/dz
$\theta$
/dz
 $\thickapprox$
-L/T
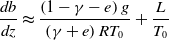
0 also. Assuming atmospheric hydrostatic equilibrium and employing the ideal gas equation again, as well as the derivatives presented in Appendix A, yields [Reference Dorrington25]
$\thickapprox$
-L/T
0 also. Assuming atmospheric hydrostatic equilibrium and employing the ideal gas equation again, as well as the derivatives presented in Appendix A, yields [Reference Dorrington25]
 \begin{align}\frac{{db}}{{dz}} \thickapprox \frac{e}{{\left( {1 + e} \right)}}\left[ {\frac{{ - g\;}}{{R{T_0}\;}} + \frac{L}{{{T_0}}}} \right]\end{align}
Since L < g/R, the buoyancy falls as the SPB rises, i.e. there is a stabilising effect on the vertical motion and this effect becomes larger as the elasticity parameter, e, increases.
In the case of VEGA 1, when the zero super-pressure condition is assumed to occur at an altitude at which P
0 = 70 kPa, T
0 = 326 K,
 $\rho$
0
$\rho$
0
 $\thickapprox$
1.12 kgm−3 the value of reference buoyancy used to define b is B
0
$\thickapprox$
1.12 kgm−3 the value of reference buoyancy used to define b is B
0
 $\thickapprox$
193 N. Using Equation (10) with e = 0.22, gives db/dz
$\thickapprox$
193 N. Using Equation (10) with e = 0.22, gives db/dz
 $\thickapprox$
−2 × 10⁻⁵ m−1 and dB/dz
$\thickapprox$
−2 × 10⁻⁵ m−1 and dB/dz
 $\thickapprox$
−4 N km−1.
$\thickapprox$
−4 N km−1.
For rapid changes in balloon float altitude, the lifting gas will undergo adiabatic changes in temperature, i.e. θ v
(
 $\gamma$
-1) = 1, where
$\gamma$
-1) = 1, where
 $\gamma$
is the ratio of specific heats of the lifting gas and when
$\gamma$
is the ratio of specific heats of the lifting gas and when
 $\mu$
= 1 Equation (7) becomes
$\mu$
= 1 Equation (7) becomes
 \begin{align}\nu \thickapprox 1 + \frac{{{\nu^{-\gamma} }}}{e} - \frac{p}{e}\end{align}
For small changes in volume,
 \begin{align}\nu \thickapprox \frac{{\left( {\gamma + e + 1 - p} \right)}}{{\left( {\gamma + e} \right)}}\end{align}
and the derivative of buoyancy with respect to altitude becomes
 \begin{align}\frac{{db}}{{dz}} \thickapprox \frac{{\left( {1 -\gamma - e} \right)g}}{{\left( {\gamma + e} \right)R{T_0}}} + \frac{L}{{{T_0}}}\;\end{align}
If the ratio of specific heats of the lifting gas had the same value as that of the ambient atmosphere, then when e =0, db/dz = 0. However, the actual value of
 $\gamma$
for helium is much larger than that of the Venus atmosphere (about 1.28). Using e = 0.22 and
$\gamma$
for helium is much larger than that of the Venus atmosphere (about 1.28). Using e = 0.22 and
 $\gamma$
= 5/3, db/dz
$\gamma$
= 5/3, db/dz
 $\thickapprox$
−3.5 × 10⁻⁵ m−1 and dB/dz
$\thickapprox$
−3.5 × 10⁻⁵ m−1 and dB/dz
 $\thickapprox$
−7 N km−1. This illustrates that the magnitude of the stabilising buoyancy effect is larger in the adiabatic case (for all e values), although this effect is time dependent: if the balloon undergoes a rapid step increase in altitude, then the buoyancy will fall by the amount predicted using Equation (13), but afterward it will partially rise as the helium temperature increases to the local ambient condition. The time to reach thermal equilibrium is dependent on the free convective heat transfer rates between the helium gas and the envelope wall and between the wall and the external atmosphere.
$\thickapprox$
−7 N km−1. This illustrates that the magnitude of the stabilising buoyancy effect is larger in the adiabatic case (for all e values), although this effect is time dependent: if the balloon undergoes a rapid step increase in altitude, then the buoyancy will fall by the amount predicted using Equation (13), but afterward it will partially rise as the helium temperature increases to the local ambient condition. The time to reach thermal equilibrium is dependent on the free convective heat transfer rates between the helium gas and the envelope wall and between the wall and the external atmosphere.
Experimental evidence (Appendix B) suggests that when the bulk gas temperature difference is modelled by a simple exponential, i.e.
 $\varDelta$
T =
$\varDelta$
T =
 $\varDelta$
T
0 exp(-t/t
0), the time constant of the VEGA helium balloons (in near still conditions) could have exceeded ∼400 s. VEGA sensors recorded ambient pressure and temperature data, but the internal helium gas temperature was not recorded. Recognising this limitation, Linkin et al [Reference Linkin, Kerzhanovich, Lipatov, Pichkadze, Shurupov, Terterashvili, Ingersoll, Crisp, Grossman, Young, Seiff, Ragent, Blamont, Elson and Preston14] assume that thermal equilibrium is maintained. Whilst this may be reasonable during night conditions, after the dawn terminator was passed solar effects may have resulted in excess temperatures, i.e.
$\varDelta$
T
0 exp(-t/t
0), the time constant of the VEGA helium balloons (in near still conditions) could have exceeded ∼400 s. VEGA sensors recorded ambient pressure and temperature data, but the internal helium gas temperature was not recorded. Recognising this limitation, Linkin et al [Reference Linkin, Kerzhanovich, Lipatov, Pichkadze, Shurupov, Terterashvili, Ingersoll, Crisp, Grossman, Young, Seiff, Ragent, Blamont, Elson and Preston14] assume that thermal equilibrium is maintained. Whilst this may be reasonable during night conditions, after the dawn terminator was passed solar effects may have resulted in excess temperatures, i.e.
 $\theta$
>
$\theta$
>
 $\tau$
. Consequently, the vertical wind data derived after the passing of the dawn terminator is subject to additional uncertainty.
$\tau$
. Consequently, the vertical wind data derived after the passing of the dawn terminator is subject to additional uncertainty.
In the limit of an inextensible envelope, as e → ∞, Equations (10) and (13) both reduce to
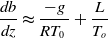 \begin{align}\frac{{db}}{{dz}} \thickapprox \frac{{ - g}}{{R{T_0}\;}} + \frac{L}{{{T_o}}}\end{align}
and db/dz
 $\thickapprox$
−11 × 10−5 m−1 and dB/dz
$\thickapprox$
−11 × 10−5 m−1 and dB/dz
 $\thickapprox$
−21 N km−1. Although this magnitude of dB/dz is several times larger than the previous elastic envelope cases presented above, it does not necessarily follow that an inextensible envelope is preferred, since the altitude range permissible will be determined by the maximum envelope stress.
$\thickapprox$
−21 N km−1. Although this magnitude of dB/dz is several times larger than the previous elastic envelope cases presented above, it does not necessarily follow that an inextensible envelope is preferred, since the altitude range permissible will be determined by the maximum envelope stress.
The maximum volume that the SPB may be extended is given by
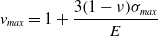 \begin{align}{v_{max}} = 1 + \frac{{3{{\left( {1 - \nu} \right)}\sigma_{max}}}}{E}\end{align}
where σ
max
is the maximum permissible wall stress including an appropriate safety factor. Using Equation (7), the maximum buoyancy variation feasible when
 $\mu$
=1 and
$\mu$
=1 and
 $\theta$
=
$\theta$
=
 $\tau$
is given by
$\tau$
is given by
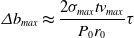 \begin{align}\varDelta{b_{max}} \thickapprox \frac{{{2\sigma_{max}}t{v_{max}}}}{{{P_0}{r_0}}}\tau\end{align}
The failure condition of the VEGA envelopes is not specified, but the lowest ambient pressures recorded by VEGA 1 and 2 were about 53 kPa, or p
 $\thickapprox$
0.74, when
$\thickapprox$
0.74, when
 $\theta$
=
$\theta$
=
 $\tau$
 $\thickapprox$
0.94. At this condition the envelope volume predicted by Equation (15) is V
$\thickapprox$
0.94. At this condition the envelope volume predicted by Equation (15) is V
 $\thickapprox$
23.1 m3 (corresponding to a diameter of 2r
$\thickapprox$
23.1 m3 (corresponding to a diameter of 2r
 $\thickapprox$
3.53 m), which is close to the maximum volume recorded in the above-mentioned Earth-based test [Reference Kremnev, Linkin, Lipatov, Pichkadze, Shurupov, Terterashvili, Bakitko, Blamont, Malique, Ragent, Preston, ELSON and CRISP13]. Using the same value, Equations (15) and (16) give σ
max
t
$\thickapprox$
3.53 m), which is close to the maximum volume recorded in the above-mentioned Earth-based test [Reference Kremnev, Linkin, Lipatov, Pichkadze, Shurupov, Terterashvili, Bakitko, Blamont, Malique, Ragent, Preston, ELSON and CRISP13]. Using the same value, Equations (15) and (16) give σ
max
t
 $\thickapprox$
2.5 kN m−1 and
$\thickapprox$
2.5 kN m−1 and
 $\varDelta$
b
max
$\varDelta$
b
max
 $\thickapprox$
0.05, or
$\thickapprox$
0.05, or
 $\varDelta$
B
max
$\varDelta$
B
max
 $\thickapprox$
11 N. The envelope strain at this condition is ∼7%. Higher strains would likely have been tolerated, i.e. the VEGA balloons would have likely withstood further expansion.
$\thickapprox$
11 N. The envelope strain at this condition is ∼7%. Higher strains would likely have been tolerated, i.e. the VEGA balloons would have likely withstood further expansion.
It should be noted that to avoid envelope bursting, a SPB may be fitted with relief valve such that when
 $\varDelta$
P exceeds a predetermined threshold value, the lifting gas is vented. In practise, helium leakage rate increases when
$\varDelta$
P exceeds a predetermined threshold value, the lifting gas is vented. In practise, helium leakage rate increases when
 $\varDelta$
P increases and the assumption that
$\varDelta$
P increases and the assumption that
 $\mu$
$\mu$
 $\thickapprox$
1 is no longer valid. Note: no distinction is made herein between leakage by diffusion through the envelope wall and leakage through pinholes.
$\thickapprox$
1 is no longer valid. Note: no distinction is made herein between leakage by diffusion through the envelope wall and leakage through pinholes.
2.5 Leakage of the VEGA SPBs
The VEGA SPBs would have lost helium gas that leaked through their envelopes during their flights. To estimate the loss rate, Linkin et al [Reference Linkin, Kerzhanovich, Lipatov, Pichkadze, Shurupov, Terterashvili, Ingersoll, Crisp, Grossman, Young, Seiff, Ragent, Blamont, Elson and Preston14] assume that during ‘Equilibrium Float Altitude’ (EFA) periods, lasting at least 150 s, there is no appreciable relative drag force, i.e. the anemometer confidently recorded a relative wind velocity magnitude of 0 ms−1. The resulting decline in EFA for VEGA 1, as defined by the historic increase in ambient pressure, is shown in Table 1, along with an estimate of the helium mass based on the assumptions of thermal equilibrium and neutral buoyancy. This decline is reasonably matched with analytical predictions that assume that the helium leakage rate is given by
 \begin{align}{\dot m_H} = 4\pi{r^2}\zeta\left[ {\varDelta P + gr\left( {\rho_\infty - {\rho_H}} \right)} \right]\end{align}
Table 1. Equilibrium Float Altitudes and Helium Loss of VEGA 1
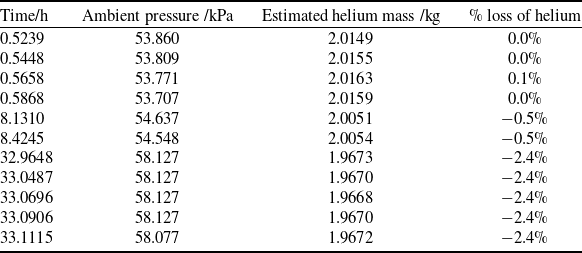
In the case of VEGA 1, a fixed value of permeance,
 $\zeta$
 $\thickapprox$
6
$\thickapprox$
6
 $\zeta$
0, where
$\zeta$
0, where
 $\zeta$
0 = 1 ×10⁻¹² kg s−1 Pa−1 m−2, results in about 2.4% loss of the initial helium mass, which offers a good match with the measured decrease in the EFA over 33 h prior the crossing of the dawn terminator. Note: Linkin et al [Reference Linkin, Kerzhanovich, Lipatov, Pichkadze, Shurupov, Terterashvili, Ingersoll, Crisp, Grossman, Young, Seiff, Ragent, Blamont, Elson and Preston14] report the loss to be 3% to 4 % over the entire mission of ∼46 h.
$\zeta$
0 = 1 ×10⁻¹² kg s−1 Pa−1 m−2, results in about 2.4% loss of the initial helium mass, which offers a good match with the measured decrease in the EFA over 33 h prior the crossing of the dawn terminator. Note: Linkin et al [Reference Linkin, Kerzhanovich, Lipatov, Pichkadze, Shurupov, Terterashvili, Ingersoll, Crisp, Grossman, Young, Seiff, Ragent, Blamont, Elson and Preston14] report the loss to be 3% to 4 % over the entire mission of ∼46 h.
In the case of VEGA 2, a lower value of
 $\zeta$
 $\thickapprox$
1.3
$\thickapprox$
1.3
 $\zeta$
0 results in good match with EFA periods for the first 14 h of flight, but a step increase to
$\zeta$
0 results in good match with EFA periods for the first 14 h of flight, but a step increase to
 $\zeta$
 $\thickapprox$
12
$\thickapprox$
12
 $\zeta$
0 is required to obtain a reasonable match with EFA periods over the remainder of its nightside flight, resulting in a loss of helium of about 2.6%. It is difficult to physically explain what could cause such a step increase in leakage rate. Unfortunately, relevant VEGA 2 data were lost during the period that this step increase event may have occurred. There is no evidence of any strong vertical winds: immediately before and after this possible event, the atmosphere was relatively quiescent, although there was an increase in w(t) fluctuations after 16 h of flight. Another speculative possibility that has been suggested [Reference Dorrington26] is that VEGA 2 encountered ‘drizzle’ during this latter period resulting in envelope weight increase; however, currently there is no reliable evidence that precipitation occurs in the middle cloud layer, nor is there sufficient collaborative evidence that any significant deposition and retention of cloud aerosol particles/droplets onto such a body is possible.
$\zeta$
0 is required to obtain a reasonable match with EFA periods over the remainder of its nightside flight, resulting in a loss of helium of about 2.6%. It is difficult to physically explain what could cause such a step increase in leakage rate. Unfortunately, relevant VEGA 2 data were lost during the period that this step increase event may have occurred. There is no evidence of any strong vertical winds: immediately before and after this possible event, the atmosphere was relatively quiescent, although there was an increase in w(t) fluctuations after 16 h of flight. Another speculative possibility that has been suggested [Reference Dorrington26] is that VEGA 2 encountered ‘drizzle’ during this latter period resulting in envelope weight increase; however, currently there is no reliable evidence that precipitation occurs in the middle cloud layer, nor is there sufficient collaborative evidence that any significant deposition and retention of cloud aerosol particles/droplets onto such a body is possible.
2.6 Buoyancy variation of VEGA 1 and 2
To determine the buoyancy variation of VEGA 1 and VEGA 2, ASCII files for recorded ambient pressure and temperature were downloaded from the NASA Planetary Data System [Reference Lorenz, Crisp and Huber27]. Linear interpolations made in these files during periods of data drop-out were accepted. The following numerical procedure was adopted:
-
(1) The local ambient density values were calculated using the ideal gas law.
-
(2) The gradient dP/dz was deduced using the hydrostatic equation as described above.
-
(3) The gradient dz/dt was calculated between 75.4 s time intervals and z determined by integration over these time steps.
-
(4) The value of P 0 = 70 kPa [Reference Linkin, Kerzhanovich, Lipatov, Pichkadze, Shurupov, Terterashvili, Ingersoll, Crisp, Grossman, Young, Seiff, Ragent, Blamont, Elson and Preston14] was assumed as the zero-pressure condition. It followed that T 0 = 323 K for VEGA 1 and 321 K for VEGA 2, in order that the starting helium mass was m H
$\thickapprox$
2 kg [Reference Linkin, Kerzhanovich, Lipatov, Pichkadze, Shurupov, Terterashvili, Ingersoll, Crisp, Grossman, Young, Seiff, Ragent, Blamont, Elson and Preston14]. -
(5) The starting helium temperature was assumed to equal the ambient temperature, and thermal equilibrium was assumed thereafter.
-
(6) The envelope volume was calculated using Equation (9) with e = 0.22, except at altitudes where super-pressure was lost, i.e. when p >1, v =
$\mu$
θ/p. -
(7) Using the ideal gas law, the helium pressure, P H =P 0
$\mu$
θ/v, and differential pressure (or super-pressure),
$\varDelta$
P = P
H
- pP
0, were calculated. -
(8) The leak rate was calculated using Equation (17) and the
$\zeta$
values quoted in the previous section. The mass of helium residing in the envelope was then calculated by integration over 75.4 s time intervals, and this mass value was used to perform steps (6 and 7) above by iteration. -
(9) The net buoyancy was calculated using a platform mass (without helium) of 18.807 kg for VEGA 1 and 19.175 kg for VEGA 2 [Reference Linkin, Kerzhanovich, Lipatov, Pichkadze, Shurupov, Terterashvili, Ingersoll, Crisp, Grossman, Young, Seiff, Ragent, Blamont, Elson and Preston14].


The deduced variation of net buoyancy, B - Mg, over the nightside flight of VEGA 1 SPB is shown in Fig. 2. After the first EFA period attained at ∼2.8 h, it can be seen that VEGA 1 then experienced some excess buoyancy fluctuations of up to ∼7.5 N at 4–6 h, but the fluctuations are mostly less than ∼2 N, thereafter, during the remainder of the flight.
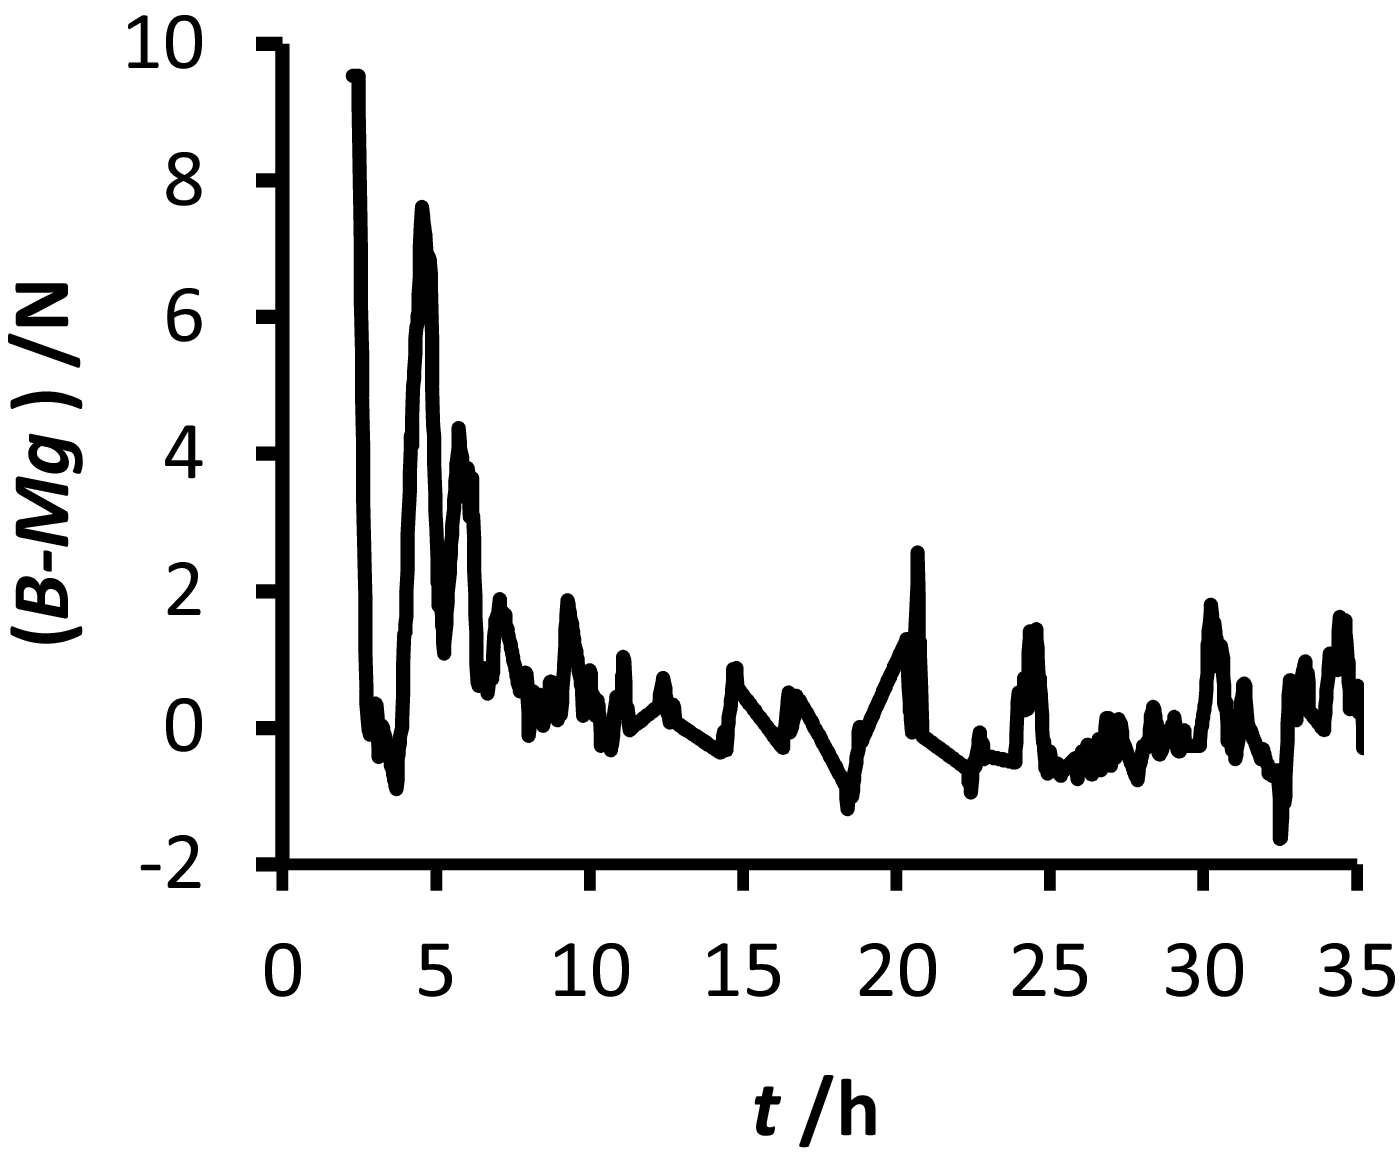
Figure 2. Historic variation of VEGA 1 net buoyancy.
In the case of VEGA 2, the first EFA period is reached about 4 h into the flight. The subsequent trajectory was relatively undisturbed over the next 11 h, but some strong vertical downdrafts were experienced thereafter resulting in buoyancy spikes up to ∼4 N, Fig. 3. For both VEGA 1 and 2, the root-mean-square of the excess buoyancy from the first EFA up to 33 h is ∼1.3 N.
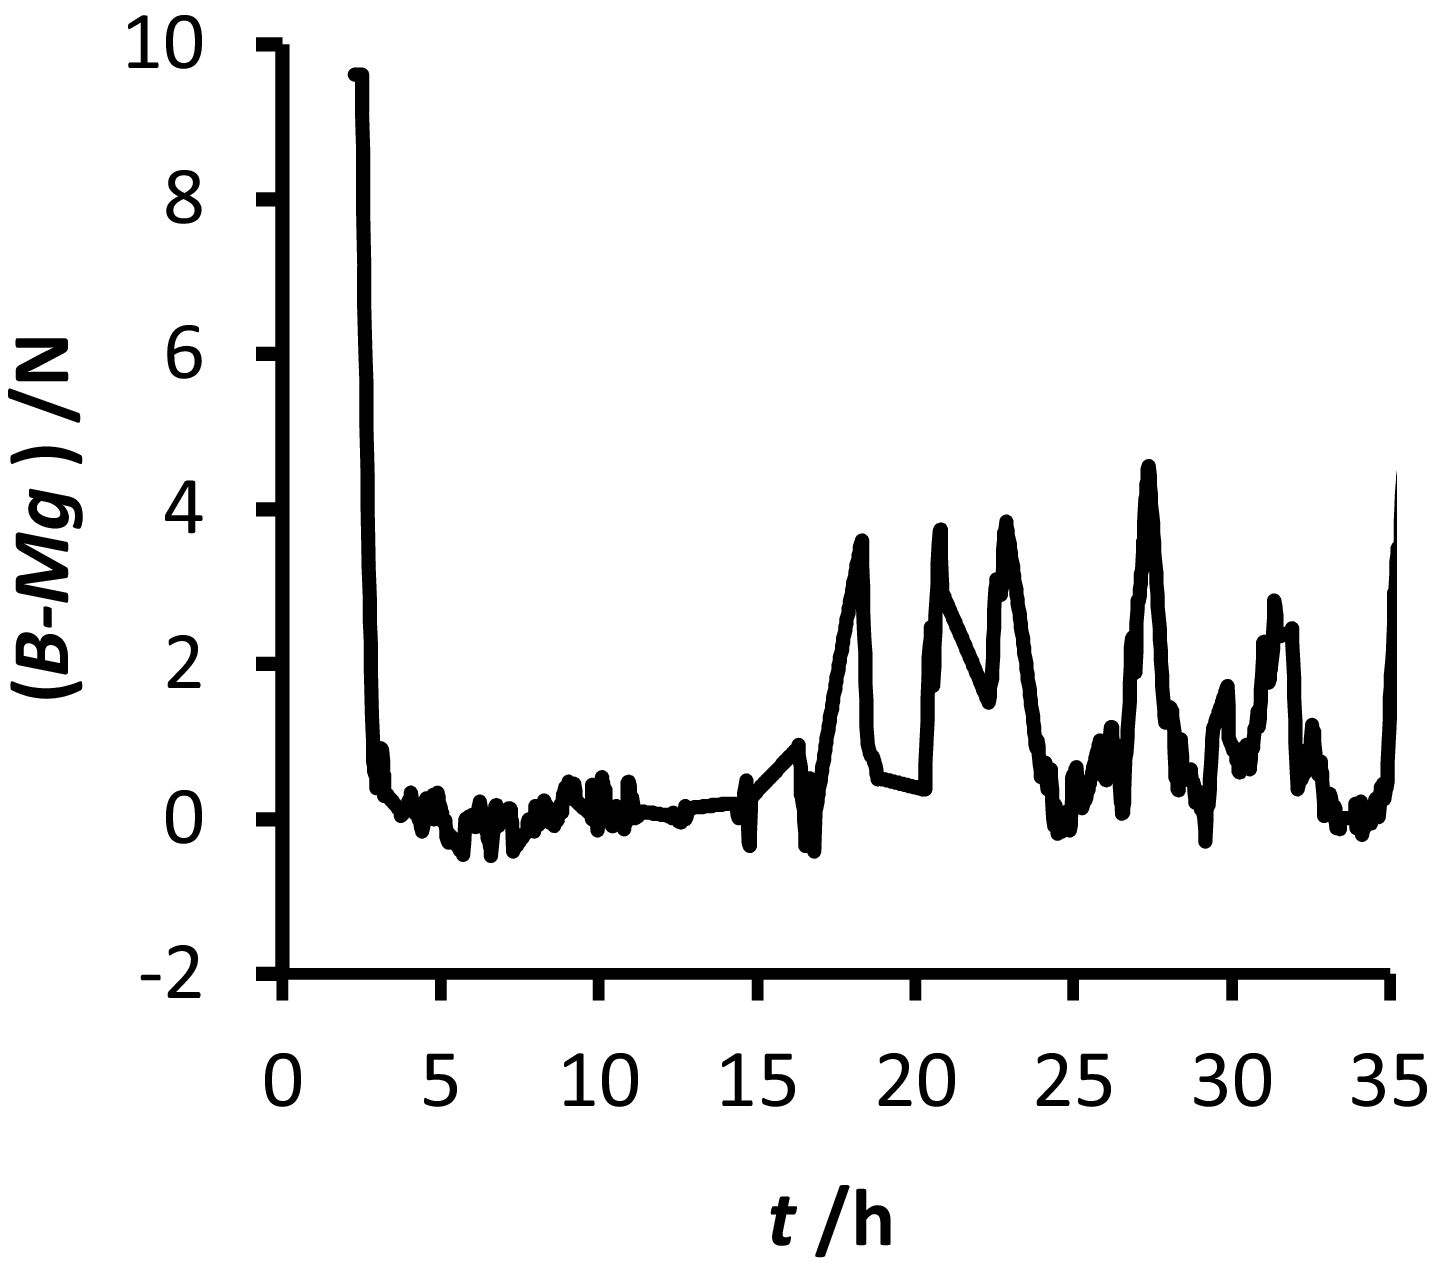
Figure 3. Historic variation of VEGA 2 net buoyancy.
3.0 Investigation of alternative balloon options
3.1 Zero-pressure balloon (ZPB)
In the following subsections various alternative balloon options are briefly described and first order expressions are derived for the work required to bring about controlled buoyancy changes. Since these alternatives all involve ZPBs, it is first worthwhile noting the following assumption.
So-called ZPBs have a variable pressure differential across the envelope wall, but they have zero excess pressure at the base. When they are in thermal equilibrium with the ambient atmosphere and no venting occurs, the buoyancy of a ZPB does not change with altitude since,
 \begin{align}B = \rho Vg = \frac{{{R_H}{T_H}}}{{RT}}\frac{P}{{{P_H}}}{m_H}g \thickapprox \frac{{{R_H}{T_H}}}{{RT}}{m_H}g\end{align}
This simple thermal equilibrium condition is assumed in Sections 3.2 to 3.4. For rapid altitude changes adiabatic effects would result in temporal ZPG buoyancy variation, see Section 2.4
3.2 ZPB with pressurised anchor balloon (PAB)
For the ZPG-PAB scheme shown in Fig. 1, the change in weight resulting from the compression of external atmospheric gases into the non-extensible anchor balloon, from an initial state ‘1’ to state ‘2’, may be written as
 \begin{align}g\varDelta m = \left[ {{m_2} - {m_1}} \right]g = \left[ {\rho_2 - {\rho_1}} \right]{V_A}g\end{align}
where V A is the volume of the anchor balloon.
Initially, it may be assumed that the gas in the anchor balloon has the same temperature as the surrounding ambient atmosphere at the float altitude, i.e. T 1 = T ∞ .
After an incremental adiabatic (isentropic) compression, when the change in anchor gas temperature,
 $\varDelta$
T
$\varDelta$
T
 $ \ll $
T
1, the change in weight can be expressed as
$ \ll $
T
1, the change in weight can be expressed as
 \begin{align}g\varDelta m = \left[ {{{\left( {{T_{2\;}}/\;{T_1}} \right)}^n} - 1} \right]{m_1}g \approx n{m_1}g\varDelta T/{T_1}\end{align}
where n = 1/(
 $\gamma$
∞
-1) and
$\gamma$
∞
-1) and
 $\gamma$
∞
is the ratio of specific heats of the ambient atmosphere. Similarly, the work input required to bring about this incremental adiabatic compression is given by
$\gamma$
∞
is the ratio of specific heats of the ambient atmosphere. Similarly, the work input required to bring about this incremental adiabatic compression is given by
 \begin{align}\varDelta W = m{c_\nu}\left[ {{T_2} - {T_1}} \right] \approx n{m_1}R\varDelta T\end{align}
where c v = nR is the specific heat at constant volume and R is the gas constant of the surrounding atmosphere.
Combining Equations (20) and (21), it follows that
 \begin{align}\varDelta W \approx R{T_1}\varDelta m = R{T_\infty }\varDelta m\end{align}
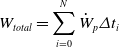
Assuming no recovery of useful work occurs during incremental expansions (when gas is transferred from the anchor balloon back to atmosphere), the total work input required to bring about a sequence of N incremental compressions at varying float altitudes with different ambient temperatures, T i , may be written as
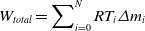 \begin{align}{W_{total}} = \mathop \sum \nolimits_{i = 0}^N R{T_i}\varDelta {m_i}\end{align}
The actual energy input required would be somewhat larger since the pumping device used to perform the compressions would have an efficiency that is less than 100%.
3.3 ZPB with pressurised internal ballonet (PIB)
For the ZPG-PIB scheme shown in Fig. 1, the change in buoyancy is determined by the change in volume of the freely extensible balloon brought about when the lifting gas (hydrogen or helium) is transferred to and from the ballonet, which is assumed to be non-extensible. The change in buoyancy between state ‘1’ and state ‘2’ is given by
 \begin{align}\varDelta B = \rho_{\infty }\left[ {{V_2} - {V_1}} \right]g\end{align}
where
 $\rho$
∞
denotes the density of the ambient atmosphere at the float altitude.
$\rho$
∞
denotes the density of the ambient atmosphere at the float altitude.
Similarly, as shown in previous section, the incremental work done to pump the lifting gas into the ballonet adiabatically is
 \begin{align}\varDelta W \approx {R_H}{T_H}\varDelta m\end{align}
Since the change in mass of the lifting gas in the freely extensible balloon,
 $\varDelta$
m, is the product of the change in volume and its density,
$\varDelta$
m, is the product of the change in volume and its density,
 $\rho$
H
, and the difference in ballonet gas and ambient temperatures will be small, it follows that the increment in work to bring about an equivalent change in buoyancy
$\rho$
H
, and the difference in ballonet gas and ambient temperatures will be small, it follows that the increment in work to bring about an equivalent change in buoyancy
 $\varDelta$
B = gΔm is
$\varDelta$
B = gΔm is
 \begin{align} \varDelta W \approx \left( {\rho_H{/\rho_\infty }} \right){R_H}{T_H}\varDelta B/g\;\; \approx \;R{T_\infty }\varDelta B/g\end{align}
Again, assuming that no useful work is recovered during incremental expansions, the total work input required to perform N sequential incremental compressions is
 \begin{align}{W_{total}} = \mathop \sum \nolimits_{i = 0}^N \;R{T_i}\varDelta{B_i}/g\end{align}
This result implies that to bring about a sequence of matching magnitude
 $\left| {B\; - \;Mg} \right|$
variations, the ZPG-PAB scheme (previous section) and the ZPG-PIB scheme (this section) require approximately the same total work input. Note: it’s possible the PIB scheme has a weight advantage over the PAB scheme, since the PIB does not need to be exposed to the acidic Venus atmosphere.
$\left| {B\; - \;Mg} \right|$
variations, the ZPG-PAB scheme (previous section) and the ZPG-PIB scheme (this section) require approximately the same total work input. Note: it’s possible the PIB scheme has a weight advantage over the PAB scheme, since the PIB does not need to be exposed to the acidic Venus atmosphere.
3.4 ZPB with vertical propulsive assist (VPA)
Another way to bring about changes in altitude, or to counter vertical winds, is to employ a vertical thrusting propeller (or ducted fan) that is positioned below the payload [Reference Dorrington28].
The shaft power required to bring about a thrust force, F T , is well approximated by simple momentum theory
 \begin{align} \dot{W}_{p} = k_{p}f\ F_{T}u_{i} = k_{p}f\sqrt{\frac{F^{3}_{T}}{2\rho_{\infty}A}} \end{align}
where k
p
 $\thickapprox$
1.8 accounts for the propeller profile power and A is the so-called ‘actuator area’, which is the same as the projected propeller disk area and f is factor that accounts for vertical relative wind [Reference Seddon23]. In this presentation, it will simply be assumed f = 1.2 in both ascending and descending relative flows, which is consistent herein with a propeller diameter of ∼0.5 m [Reference Seddon23].
$\thickapprox$
1.8 accounts for the propeller profile power and A is the so-called ‘actuator area’, which is the same as the projected propeller disk area and f is factor that accounts for vertical relative wind [Reference Seddon23]. In this presentation, it will simply be assumed f = 1.2 in both ascending and descending relative flows, which is consistent herein with a propeller diameter of ∼0.5 m [Reference Seddon23].
The total energy input required to bring about a sequence of N impulses, F
Ti
 $\varDelta$
t
i
, that match a prescribed sequence is
$\varDelta$
t
i
, that match a prescribed sequence is
 \begin{align} W_{total} = \sum^{N}_{i=0} \dot{W}_{p}\varDelta t_{i} \end{align}
Like the previous schemes the actual energy input required would be somewhat larger since the motor driving the propeller/fan would have an efficiency less than 100%.
3.5 Comparison of power requirements of alternative schemes
Using the historic variations of the buoyancy of VEGA 1 (Fig. 1), the equivalent total work needed to maintain the exact same flight profile may be estimated for ZPB-PAB, ZPB-PIB and ZPB-VPA schemes using Equations (23), (27) and (29), respectively. To make these estimates, it was assumed that the values of envelope radius and drag coefficient (used in Equation (5)) are the same for each scheme.
Table 2 lists the total energy input for these options over the flight period 4–33 h.
Table 2. Energy estimates of balloon options matching flight profiles of VEGA 1/2
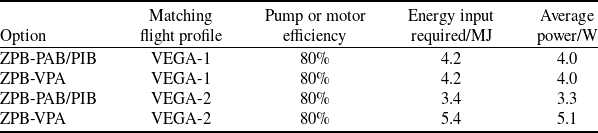
Assuming a primary lithium battery is used, then specific energies of 250–500 W h kg−1 could be realised [Reference Krause, Jones, Jones, Pasalic, Billings, West, Smart, Bugga, Brandon and Destephen29, Reference Knap, Kjeldgaard and Stroe30], i.e. the extra battery mass required for all the actively controlled platform options could be as little as ∼0.5–1 kg.
The VEGA SPB envelope had a mass of ∼12 kg, or mass per unit area of ∼0.35 kg m−2. The ZPB envelopes are subject to lower stresses after inflation and could potentially be made of a lighter material. Hall et al [Reference Hall, Yavrouian, Kerzhanovich, Fredrickson, Pauken, Kulczycki, Walsh, Said and Day31] also quote the use of an envelope material with 0.173 kg m−2 for an SPB which would offer a saving of ∼6 kg. These cursory estimates suggest that all the options in Table 2 are at least feasible.
The ZPB-PAB scheme has been previously tested in the Earth atmosphere [Reference Wetzel, Borys, Lowenthal and Brown32] and PIB schemes have been previously investigated [Reference Hall, Israelevitz, Cameron, Harsh, Lachenmeier, Elder and Pauken33] but the ZPA-VPA scheme has not received similar attention. Consequently, it is recommended that the ZPA-VPA scheme receives further attention.
4.0 Discussion
The comparison in the previous section was made under the assumption that each of the alternative options shown in Fig. 1 match the exact same excess buoyancy variation predicted for either VEGA 1 or VEGA 2. Exact matching was invoked with the intention that the alternative options experience the same predicted vertical winds, i.e. the same vertical dynamics. However, different control strategies could be adopted to potentially reduce the energy inputs required. Models of the vertical wind spectrum at all altitudes along the flight trajectory would be needed to derive these strategies, but such a comprehensive data set is not yet available. The assumption that these alternatives all have the same drag coefficient and same envelope size for a prescribed gondola mass may also be questioned. For the ZPB-PAB scheme this assumption may be optimistic since the PAB would increase the drag. On the other hand, the drag coefficient of the ZPG could be substantially lower in downward relative flows since sphere-plus-tail-cone configurations have lower drag than a sphere [Reference Dorrington34].
Buchanan et al [Reference Buchanan, de Jong, Agrawal, Petkowski, Arora, Saikia, Seager and Longuski2] propose several different balloon missions with nominal durations of ∼1 week. One scientific motivation for such long endurance is the possible discovery of diurnal variations in atmospheric chemistry and/or cloud particle properties. However, the vertical dynamics of SPBs on the dayside of Venus is poorly constrained: the assumption of thermal equilibrium to derive vertical wind velocities during the daytime is subject to doubt. As stated earlier (Section 2.2), the fate of the VEGA balloons is open to speculation. It’s possible that may they achieved multiple circumnavigations. Alternatively, around midday, they may have been either over-expanded during persistent ascents or they may have first suffered envelope melting when descending to much lower altitudes. In other words, daytime flight poses an unknown risk. Given that solar photovoltaics could be used to augment to daytime power demands, a SPB-VPA scheme (not included in Fig. 1) could have some merit providing additional vertical control assurance to mitigate the risk of excessive altitude departures resulting in possible early destruction.
The use of a VEGA-sized balloon, even with a lighter envelope (as suggested in the previous section) would limit the feasible payload to ∼2 kg. While this would seem overly restrictive it should be noted that an autofluorescing nephelometer proposed for a single cloud traverse descent probe [Reference French, Mandy, Hunter, Mosleh, Sinclair, Beck, Seager, Petkowski, Carr, Grinspoon and Baumgardner35] has a predicted mass of ∼1 kg. To perform more comprehensive measurements offering greater science return, larger payloads are needed (e.g. Ref. [Reference Buchanan, de Jong, Agrawal, Petkowski, Arora, Saikia, Seager and Longuski2, Reference Arredondo, Hodges, Abrahams, Bedford, Boatwright, Buz, Clayton Cantrall, Clark, Erwin, Krishnamoorthy, Magaña, McCabe, McIntosh, Noviello, Pellegrino, Ray, Styczinski and Weigel5, Reference Wilson, Chassefière, Hinglais, Baines, Balint, Berthelier, Blamont, Durry, Ferencz, Grimm, Inamura, Josset, Leblanc, Lebonnois, Leitner, Limaye, Marty, Palomba, Pogrebenko and Rafkin36]), or fleets of similar-sized (or smaller) balloons could be employed [Reference Hein, Lingam, Eubanks, Hibberd, Fries and Blase37]. Buchanan et al [Reference Buchanan, de Jong, Agrawal, Petkowski, Arora, Saikia, Seager and Longuski2] invoke gondola masses of ranging from ∼23 to ∼145 kg, resulting in the need for much larger balloon envelopes. The scaling of the dynamic equations was not considered in Section 2.3, but the characteristic response time of larger balloons will be somewhat longer.
If it is assumed that the VEGA balloons, are scaled-up by a linear factor
 $\lambda$
, then at simplest the buoyancy variation would scale with
$\lambda$
, then at simplest the buoyancy variation would scale with
 $\lambda$
3. To maintain constant specific energy, the actuator disk area of the VPA scheme (Fig. 1) described in Section 3.4 would also need to scale with
$\lambda$
3. To maintain constant specific energy, the actuator disk area of the VPA scheme (Fig. 1) described in Section 3.4 would also need to scale with
 $\lambda$
3. Since this appears to be plausible, e.g. for
$\lambda$
3. Since this appears to be plausible, e.g. for
 $\lambda$
 $\thickapprox$
2–3, it is also plausible that the similar energy result presented in Table 2, would still apply for the larger payloads envisaged, (e.g. Ref. [Reference Buchanan, de Jong, Agrawal, Petkowski, Arora, Saikia, Seager and Longuski2, Reference Arredondo, Hodges, Abrahams, Bedford, Boatwright, Buz, Clayton Cantrall, Clark, Erwin, Krishnamoorthy, Magaña, McCabe, McIntosh, Noviello, Pellegrino, Ray, Styczinski and Weigel5, Reference Wilson, Chassefière, Hinglais, Baines, Balint, Berthelier, Blamont, Durry, Ferencz, Grimm, Inamura, Josset, Leblanc, Lebonnois, Leitner, Limaye, Marty, Palomba, Pogrebenko and Rafkin36]). The VPA scheme may have other advantages:
$\thickapprox$
2–3, it is also plausible that the similar energy result presented in Table 2, would still apply for the larger payloads envisaged, (e.g. Ref. [Reference Buchanan, de Jong, Agrawal, Petkowski, Arora, Saikia, Seager and Longuski2, Reference Arredondo, Hodges, Abrahams, Bedford, Boatwright, Buz, Clayton Cantrall, Clark, Erwin, Krishnamoorthy, Magaña, McCabe, McIntosh, Noviello, Pellegrino, Ray, Styczinski and Weigel5, Reference Wilson, Chassefière, Hinglais, Baines, Balint, Berthelier, Blamont, Durry, Ferencz, Grimm, Inamura, Josset, Leblanc, Lebonnois, Leitner, Limaye, Marty, Palomba, Pogrebenko and Rafkin36]). The VPA scheme may have other advantages:
-
(i) From a science standpoint it also pays to sample larger quantities of cloud particles and consequently the integral of |w rel | becomes important. In the case of the VPA scheme, larger fluxes of particles (and more particle deposition) could be achieved by diverting some of the flow induced by the propeller or fan into the sampling device.
-
(ii) Active propulsion might be used to maintain yaw control to help facilitate precision directional control of the communication antenna.
Direct use of VEGA data to analyse the balloon options presented above does not offer any guarantee of predictive accuracy for any future mission. Aside from the fact that the weather profiles encountered by the VEGA balloons are likely to be strongly related to their flight latitudes (noting also that VEGA-2 overflew the Aphrodite Terra), Venus atmospheric conditions may have long term periodic changes [Reference Khatuntsev, Patsaeva, Titov, Zasova, Ignatiev and Gorinov38]. Nevertheless, the approach offered herein is recommended to augment future studies.
5.0 Conclusion
The two VEGA balloons that floated in the Venus atmosphere in 1985 had near-spherical elastic envelopes offering inherent vertical stability with a weak, near-linear, corrective force of ∼4 N per kilometre displacement from the equilibrium float altitude. This passive stabilising property permitted them both to achieve successful night flights lasting ∼34 h despite the relatively strong vertical gusts they encountered. The vertical pressure-height oscillations resulted in the root-mean-square excess buoyancy variation of ∼1.3 N prior to the crossing of the dawn terminator.
Several alternative, actively controlled, balloon options shown in Fig. 1 could theoretically match the exact same buoyancy variation profile over the same night-time period. The energy required to operate each of these options, to achieve the matching profile, is not widely dissimilar and all appear to be viable from cursory first-order mass estimates. Little attention has been spent on the vertical propulsive assist option shown in Fig. 1 and hence it is recommended this option is investigated alongside others.
Appendix A. Derivatives of v and b
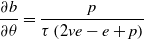
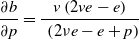
The partial derivatives of v with respect to p = P/P 0 and θ = T/T 0 are,
 \begin{align}\frac{{\partial v}}{{\partial p}} = \frac{{ - v}}{{\left( {2ve - e + p} \right)}}\end{align}
 \begin{align}\frac{{\partial v}}{\partial \theta} = \frac{1}{{\left( {2ve - e + p} \right)}}\end{align}
The non-dimensional buoyancy, b = pv/
 $\tau$
, and its partial derivatives are:
$\tau$
, and its partial derivatives are:
 \begin{align}\frac{{\partial b}}{\partial \tau } = \frac{{ - pv}}{{\tau^{2}}}\end{align}
 \begin{align}\frac{{\partial b}}{\partial \theta} = \frac{p}{{{{\tau\left( {2ve - e + p} \right)}}}}\end{align}
 \begin{align}\frac{{\partial b}}{{\partial p}} = \frac{{{v}\left( {2{v{e}} - {{e}}} \right)}}{{{\rm{\;}}\left( {2{\nu{e}} - {{e}} + {{p}}} \right)}}\end{align}
When p
 $\thickapprox$
1, v
$\thickapprox$
1, v
 $\thickapprox$
1 and
$\thickapprox$
1 and
 $\tau$
 $\thickapprox$
1, the above derivatives reduce to:
$\thickapprox$
1, the above derivatives reduce to:
 \begin{align}\frac{{\partial b}}{\partial \tau} \thickapprox - 1\end{align}
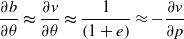 \begin{align}\frac{{\partial b}}{\partial \theta}\thickapprox\frac{{\partial v}}{\partial \theta}\thickapprox\frac{1}{{\left( {1 + e} \right)}} \approx - \frac{{\partial v}}{{\partial p}}\end{align}
 \begin{align}\frac{{\partial b}}{\partial p}\thickapprox\frac{e}{{\left( {1 + e} \right)}}\end{align}
The total derivatives of v and b with respect to, z, are
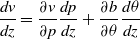 \begin{align}\frac{{dv}}{{dz}} = \frac{{\partial v}}{{\partial p}}\frac{{dp}}{{dz}} + \frac{{\partial b}}{\partial \theta}\frac{d\theta}{{dz}}\end{align}
 \begin{align}\frac{{db}}{{dz}} = \frac{{\partial b}}{{\partial p}}\frac{{dp}}{{dz}} + \frac{{\partial b}}{\partial \tau}\frac{d\tau}{{dz}} + \frac{{\partial b}}{\partial \theta}\frac{d\theta}{{dz}}\end{align}
Appendix B. Laboratory experiment with helium-filled latex balloon
A latex rubber meteorological balloon with a diameter of about 1.6 m was filled with a mixture of about 85% helium, 15% air. The mixture was heated internally by passing a direct current through a centrally mounted 1.5 Ω resistor, using an externally mounted 12 V battery, i.e. the power input was about 96 W. The variation of buoyancy of the assembly was measured in a small (air filled) room. After the power supply was switched on, the excess buoyancy and the deduced temperature of the mixture plateaued at about 0.15 N and 2 K above the initial conditions, respectively. When the power supply was switched off, the buoyancy decay matched an exponential expression, b = exp(-t/t
0), where t
0
 $\thickapprox$
400 s. The VEGA balloon envelopes were somewhat larger than the one used for this simple test. Scaling laws for external free convection suggest that time constant would become larger as balloon radius increases. On the other hand, the external heat transfer for the VEGA balloons would have been dictated by forced convection, possibly reducing the time constant. Whatever the modification, introducing a thermal lag such that the internal gas temperature at time t + t
0 equals the ambient temperature at time t, does not substantially alter the excess buoyancy histories of VEGA 1 and 2, shown in Fig. 2 and 3, respectively.
$\thickapprox$
400 s. The VEGA balloon envelopes were somewhat larger than the one used for this simple test. Scaling laws for external free convection suggest that time constant would become larger as balloon radius increases. On the other hand, the external heat transfer for the VEGA balloons would have been dictated by forced convection, possibly reducing the time constant. Whatever the modification, introducing a thermal lag such that the internal gas temperature at time t + t
0 equals the ambient temperature at time t, does not substantially alter the excess buoyancy histories of VEGA 1 and 2, shown in Fig. 2 and 3, respectively.


