The antioxidative properties of multiple bioactive compounds have been proposed to partially contribute to the protective effects of vegetables and fruits on chronic diseases( Reference Genkinger, Platz and Hoffman 1 , Reference Heidemann, Schulze and Franco 2 ). These compounds include various antioxidants including ascorbic acid, tocopherols, carotenoids, and polyphenols such as simple phenolics, flavonoids and proanthocyanidins. In epidemiological or clinical investigations, several studies have reported inverse associations between dietary antioxidants and incidences of CVD or cancer( Reference Arai, Watanabe and Kimira 3 – Reference Liu 6 ), while others did not confirm these findings( Reference Rimm, Katan and Ascherio 7 – Reference Sesso, Paffenbarger and Oguma 9 ). Therefore, clarification on the health implications of dietary antioxidants needs to be continuously explored, which, to a large extent, relies upon the quality of dietary exposure assessment( Reference Satia, Waiters and Galanko 10 ).
Despite the potential importance of various antioxidants, there is a paucity of development and validation studies, especially of dietary flavonoids, which probably stems from methodological limitations imposed by a lack of flavonoid composition data for foods. The self-administered FFQ is the primary method of dietary assessment used in epidemiological studies( Reference Willett 11 ), owing to its capability of capturing a long-term dietary behaviour, low participant burden and ease in data processing. A new FFQ was developed to assess a comprehensive antioxidant intake profile containing vitamin C, vitamin E, carotenoids, flavonoids and proanthocyanidins, as well as total antioxidant capacity (TAC), an integrated measure of the ‘quenching abilities’ of antioxidants( Reference Yang, Wang and Davis 12 ). This FFQ provided a reasonable validity in a sample of American college students( Reference Yang, Wang and Davis 12 ). Nevertheless, since this FFQ was initially created to assess short-term antioxidant intake status (1 month), whether it could be applied in other populations and whether it could be extended to measure usual antioxidant intake needed further investigation. The aims of the present study therefore were to evaluate the validity of the newly developed FFQ in overweight postmenopausal women and to extend its feasibility in assessing long-term antioxidant intake with respect to this target group.
Materials and methods
Participants and study design
A 9-month observational study was conducted in 40–70-year-old, overweight/obese (BMI = 25·0–39·9 kg/m2), non-smoking postmenopausal women. Volunteers were identified as potential subjects through a telephone interview and were immediately invited to the Clinical Research Center located at the University of Connecticut Health Center in Farmington, Connecticut, USA. On the initial visit, after written informed consent was obtained, anthropometric parameters (height, weight) and blood pressure were measured by one nurse in the University of Connecticut Health Center to determine the eligibility of participants. Height was measured by having the participants stand against a wall ruler without shoes. Weight was measured using the scale provided to the participants. Two measurements of blood pressures, 45 s apart, were taken on the participants’ left arms. Data recorded for each measurement included systolic and diastolic blood pressure and the time of day the reading was taken. An interview performed by the same nurse was followed regarding the participants’ medical, dietary, smoking and alcohol consumption histories. Exclusion criteria included: (i) having any history of chronic disease such as diabetes mellitus, CVD, arthritis (except for osteoarthritis), kidney disease, currently being treated for cancer (i.e. chemotherapy, radiation therapy) and any history of malnutrition or digestion problems; (ii) taking any anti-inflammatory medicines; (iii) following slimming diets; and (iv) consuming alcohol exceeding 2 drinks/d or a total of 12 drinks/week. This population was specifically chosen because obesity and postmenopausal status serve as significant risk factors of chronic inflammation and CVD( Reference Weyer, Yudkin and Stehouwer 13 , Reference Billington, Epstein and Goodwin 14 ). The data from this population will be further used for FFQ application. If the participants were eligible, a 12 h fasting venous blood sample was taken. A dietitian instructed the participants on how to record a 7 d food record (7dFR). At the second visit seven days after the initial screening, the eligible participants submitted the 7dFR and completed the newly developed FFQ (FFQ1). After the second visit, participants were requested to complete one set of FFQ along with a 7dFR in each season and mail them back to the research team. In total, four sets of FFQ and 7dFR were collected and numbered 1 to 4 chronologically. Among forty-one eligible participants, forty completed the second visit. All but five volunteers (88 %) finished and submitted three other sets of FFQ and 7dFR during 9 months.
Dietary assessment by FFQ
The FFQ is a questionnaire that integrates nine food groups into seventy-four questions, including four on dietary supplements, aiming to estimate a comprehensive dietary antioxidant profile (vitamin C, vitamin E, carotenoids, flavonoids, proanthocyanidins) along with TAC values. The food list in the FFQ was determined based on the ranking of TAC scores of mostly consumed food items in the American diet( Reference Yang, Chung and Chung 15 ), using food consumption data of 8809 US adults in the National Health and Nutrition Examination Survey (NHANES) 1999–2002( 16 , 17 ). The US Department of Agriculture's flavonoid and proanthocyanidin data sets( 18 – 20 ) and the antioxidant capacity data set of forty-three major antioxidant nutrients( Reference Kim, Chun and Kim 21 ) were used to calculate TAC scores. Antioxidant capacity of each antioxidant from the food items was calculated by multiplying daily consumption of each antioxidant by its corresponding antioxidant capacity. TAC score from the specific food consumed daily was assessed by summing individual antioxidant capacities. The top food items contributing most to TAC in this food list were selected to cover at least 83 % of the cumulative TAC and were translated into seventy questions. The final FFQ contained eight food groups without specific information such as preparations (fifteen vegetables and vegetable products, eighteen fruits, twenty-one beverages, two breads and cereals, six dairy and eggs, four oils and seasonings, two sweets and desserts, and two others such as nuts or seeds). Since the TAC scores of vitamin C, α-tocopherol and β-carotene from dietary supplements contributed to almost 25 % of the TAC from diet and supplements in Americans according to the previous study( Reference Yang, Chung and Chung 15 ), vitamin C, α-tocopherol, β-carotene and multivitamins were included in the four dietary supplement questions with dosage information nested. Because limited information is available on supplementary flavonoid composition, and the flavonoid intake from supplements was documented to be less than 2 % in US adults( Reference Yang, Chung and Chung 15 , Reference Chun, Floegel and Chung 22 ), flavonoid intake from supplements was not included. Food frequency was coded as daily, weekly and monthly, and from 0 to 7 occasions including none, 1 time/month, <1 time/week, 1–2 times/week, 3–4 times/week, 5–6 times/week, 1 time/d and >1 time/d. The FFQ was intended to cover the previous 1-month consumption of food and supplements. Portion sizes were estimated using three different scales (small, medium and large); small serving was half of the medium serving, while large serving equalled one-and-half of the medium serving. Photographic figures for medium serving size were included to illustrate the portion size.
To calculate antioxidant intake from the FFQ, a ‘unit’ antioxidant database based on a ‘medium’ serving size was created by combining the dietary nutrient profile for individual food items from the Nutrition Data System for Research (NDSR) release 2010 (University of Minnesota, Minneapolis, MN, USA) with the Flavonoid/Proanthocyanidin Provisional Table developed by the Nutrition Coordinating Center (NCC). This NCC Provisional Table provided a way for NDSR users to link the US Department of Agriculture data with NDSR data via NDSR food identification codes( 23 ). Frequency from the FFQ was converted proportionally to daily units. Consequently, daily antioxidant intake from food was obtained by multiplying the ‘unit’ antioxidant database by the frequency and the factor of the reported portion size relative to a ‘medium’ serving. Vitamin C, α-tocopherol and β-carotene intakes from dietary supplements were determined from the addition of single-nutrient supplements and multivitamin use according to the default dietary supplements database in NHANES 2007–2008( 24 ). The mean daily dose of multivitamins was calculated by the frequency of intake. Individual antioxidant capacity for a specific food item or dietary supplement was obtained through multiplying the daily antioxidant intake by the corresponding antioxidant capacity. TAC of each food item or dietary supplement was calculated by summing the individual antioxdiant capacities in the foods or supplements. TAC from the whole diet was calculated by summing all TAC scores from individual food or dietary supplements( Reference Yang, Chung and Chung 15 ).
Dietary assessment by food record
The study dietitian trained the participants to complete a 7dFR by including all foods, beverages and dietary supplements consumed during the seven consecutive days and reviewed the records to check for errors or omissions every day. Dietary intake data were collected and analysed by using NDSR and the Flavonoid/Proanthocyanidin Provisional Table. Dietary supplement data were estimated through NDSR updated with an NCC enhanced version of the NHANES Dietary Supplement Database 2007–2008( 23 ). TAC from diet and TAC from supplements were obtained through multiplying antioxidant profiles by antioxidant capacities.
Measurements of plasma antioxidants, total antioxidant capacity and lipids
A 12 h fasting blood sample for plasma antioxidant analysis was collected in vacutainers containing heparin sodium or EDTA at the initial visit. Samples were centrifuged immediately at 3000 g for 10 min at 4 °C. Plasma was separated and stored at −80 °C until further measurements. Plasma vitamin C was measured on deproteinized plasma by HPLC with a UV detector as described by Ross( Reference Ross 25 ). In order to preserve vitamin C, an aliquot of plasma was deproteinized with 10 % (w/v) perchloric acid. This sample was then centrifuged (15 000 g , 5 min, 4°C) and the supernatant was kept at −80°C until analysis. Plasma α-tocopherol and γ-tocopherol were analysed using HPLC( Reference Leonard, Bruno and Paterson 26 ). The slightly modified method described by Karppi et al. ( Reference Karppia, Nurmia and Olmedilla-Alonsob 27 ) was used for carotenoid analyses. Plasma TAC was determined by the ABTS assay developed by van den Berg et al. ( Reference van den Berg, Haenen and van den Berg 28 ) and modified by Floegel et al. ( Reference Floegel, Kim and Chung 29 ). Lipid profiles including total cholesterol and TAG were measured with the Cobas C111 analyser (Roche Diagnostics, Indianapolis, IN, USA).
Statistical analysis
All statistical analyses were carried out using the SAS statistical software package version 9·2. Descriptive statistics were computed to describe sociodemographic characteristics, averaged daily antioxidant intake estimated from the first set of 7dFR and FFQ, and plasma antioxidant and TAC levels. For validity testing, Spearman rank correlation coefficients were calculated between the dietary nutrients estimated from 7dFR1 and FFQ1 and between the corresponding dietary and plasma nutrients after adjusting for age, BMI, ethnicity and (except for vitamin C) plasma cholesterol and TAG concentrations. This was also performed for antioxidant intakes estimated from FFQ1 and FFQ4 for testing reliability. Bland–Altman plots were generated to assess the agreement between the first set of 7dFR and FFQ( Reference Bland and Altman 30 , Reference Cade, Thompson and Burley 31 ). Repeated ANOVA was performed to compare antioxidant intakes or the respective major food sources estimated from four 7dFR or four FFQ for examining seasonal variations of dietary antioxidants. To test whether this FFQ was able to assess long-term antioxidant intake, Spearman rank correlations were calculated between antioxidant intakes estimated from averaged four 7dFR, those from averaged four FFQ and those obtained from four individual FFQ, respectively. In addition, cross-classification was assessed by calculating the percentages of respondents classified into the same third or the adjacent third of antioxidant intake by 7dFR1 and FFQ1, and by averaged four 7dFR, averaged four FFQ and four individual FFQ. Misclassification was reported as the percentage of respondents categorized into the extreme opposite tertiles. Significance was set at a value of P < 0·05 for two-sided testing.
Results
The forty participants who completed the second visit for the FFQ validity test were predominantly non-Hispanic white, with an average age of 58 years and a BMI of 30·0 kg/m2 (Table 1). Sixteen participants reported taking a daily multivitamin. Three took a daily vitamin C only supplement, two took a vitamin E only supplement and none of them took a β-carotene only supplement.
Table 1 Sociodemographic characteristics, antioxidant supplement use and plasma antioxidant concentrations of overweight and obese postmenopausal women who completed the first set of FFQ and 7dFR (n 40)

7dFR, 7d food record; TAC, total antioxidant capacity; VCE, vitamin C equivalent.
*Supplement use was estimated based on the first 7dFR.
†Plasma TAC was measured by the ABTS assay and expressed as mg VCE/l.
Daily consumption of vitamin E, vitamin C, carotenoids, flavonoids and proanthocyanidins estimated from FFQ1 accounted for 50·1 % (88·9 % including vitamin E supplements), 93·5 % (106·6 % including vitamin C supplements), 82·8 %, 77·2 % and 89·8 %, respectively, of those from average 7dFR1. TAC estimated by FFQ1 was approximately 80 % of the value calculated from 7dFR1 (Table 2). There was a moderately to highly positive correlation between dietary intake estimated from the first set of FFQ and 7dFR for individual antioxidants and TAC, except for γ-tocopherol (r = 0·34 to 0·87, P < 0·05; Table 2). The proportion of participants categorized in the opposite tertiles averaged 7 % (Table 2). Significant Spearman correlations were observed between dietary vitamin C and carotenoids (β-carotene, β-cryptoxanthin, lutein + zeaxanthin, lycopene) estimated from FFQ1 and their corresponding plasma levels, in the range of 0·35 to 0·50 (P < 0·05) after adjusting for relevant covariates. α-Tocopherol intake from diet only did not show any correlation with plasma α-tocopherol level; however, including supplementary α-tocopherol greatly increased the correlation (r = 0·15 and 0·74, respectively). Neither TAC from diet nor TAC from diet and supplements was associated with plasma TAC level (Table 3). Bland–Altman plots exemplified by dietary vitamin E, vitamin C, carotenoids, flavonoids, proanthocyanindins and TAC showed that the plotted points remained predominantly within the 95 % limits of agreement, suggesting no systematic bias in measurement using the FFQ compared with 7dFR (Fig. 1).
Table 2 Averaged daily antioxidant intakes and validity test (Spearman correlation coefficients and misclassification percentage) between the first set of 7dFR and FFQ collected from overweight and obese postmenopausal women (n 40)
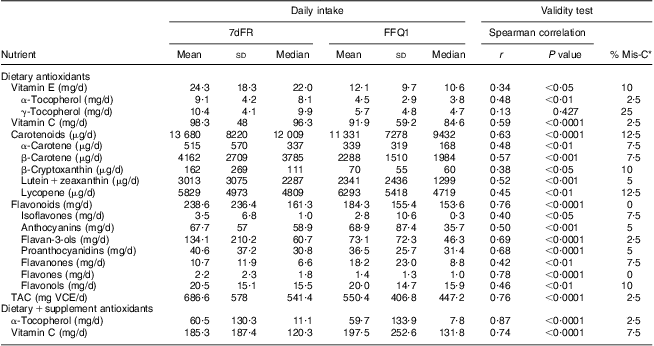
7dFR, 7 d food record; % Mis-C, percentage of misclassification; r, correlation coefficient; TAC, total antioxidant capacity; VCE, vitamin C equivalent.
*Percentage of respondents categorized into the extreme opposite tertile.
Table 3 Spearman rank correlations between dietary antioxidants estimated from the first set of FFQ and 7dFR and corresponding plasma antioxidant levels in overweight and obese postmenopausal women who completed the first set of FFQ and 7d FR (n 40)Footnote *

7dFR, 7 d food record; r, correlation coefficient; TAC, total antioxidant capacity.
* Models were adjusted for age, gender, ethnicity, BMI and (except for vitamin C) plasma cholesterol and plasma TAG concentrations, and supplement use.
† Spearman correlations were calculated between dietary antioxidants and corresponding plasma concentrations.
‡ Spearman correlations were calculated between dietary and supplementary antioxidants and corresponding plasma concentrations.
§ Models were adjusted for age, gender, ethnicity, BMI, plasma uric acid concentration and supplement use.
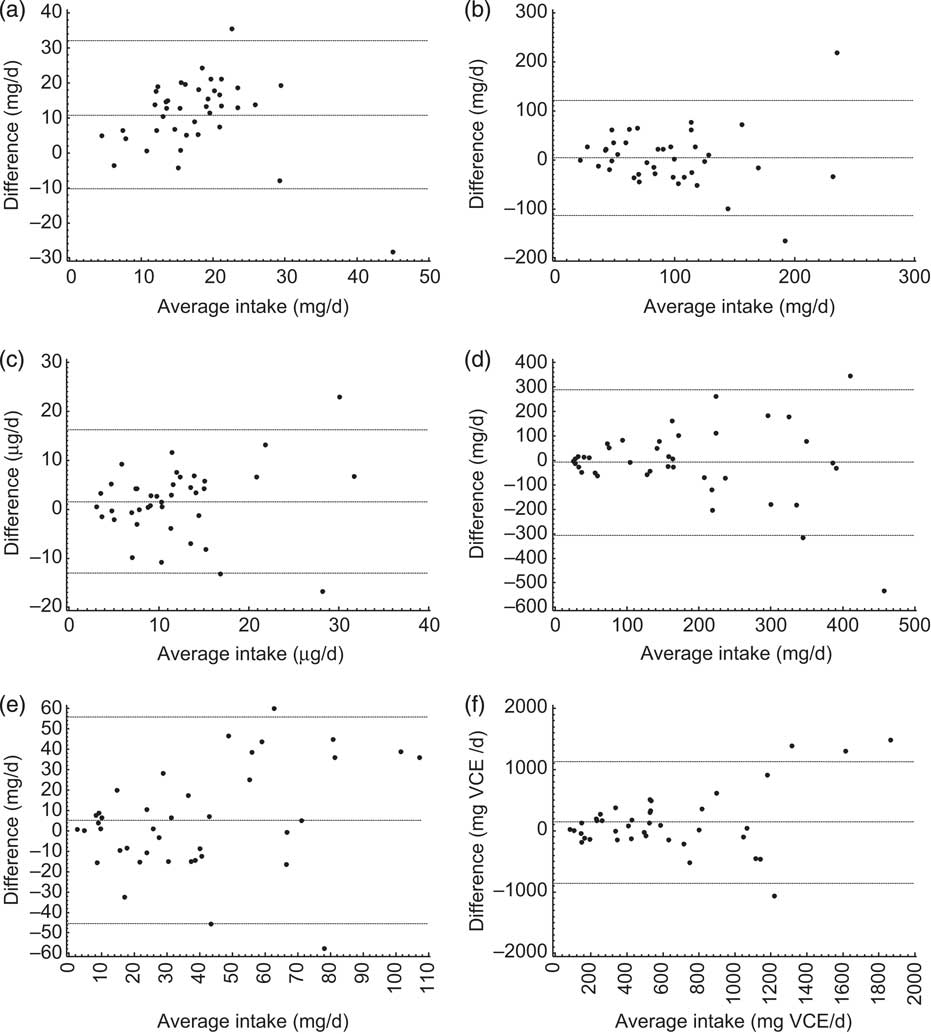
Fig. 1 Bland–Altman plots comparing the dietary intake of (a) vitamin E, (b) vitamin C, (c) total carotenoids, (d) flavonoids, (e) proanthocyanidins and (f) total antioxidant capacity measured using the first set of 7 d food records and FFQ collected from overweight and obese postmenopausal women (n 40). The middle line represents the mean difference between the two assessment methods; the upper and lower lines are the 95% limits of agreement. VCE, vitamin C equivalent
Dietary antioxidants estimated from four 7dFR and four FFQ collected every season are shown in Fig. 2. No time effect was observed for antioxidant intakes over 9 months. However, investigations on supplement intake collected by four FFQ showed that neither frequency nor amount of dietary supplements was consistent in these overweight postmenopausal women (data not shown). Therefore, subsequent analyses on long-term antioxidant intake did not include dietary supplements from each FFQ.
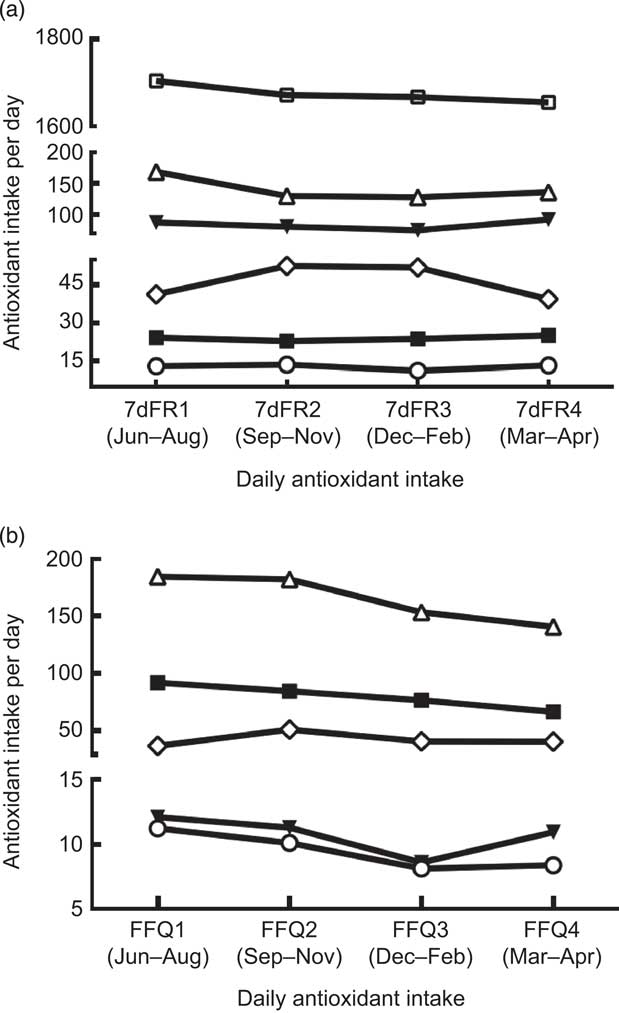
Fig. 2 Comparisons among dietary antioxidant intakes (—□—, energy (kcal/d; 1 kcal = 4·184 kJ); —▾—, vitamin E (mg/d); —▪—, vitamin C (mg/d); —○—, carotenoids (μg/d); —▵—, flavonoids (mg/d); —◊—, proanthrocyanidins (mg/d)) estimated from (a) four sets of 7 d food records (7dFR) and (b) four sets of FFQ collected every 3 months in overweight and obese postmenopausal women (n 35). There was no time effect on antioxidant intake over 9 months
Correlations of dietary antioxidant estimates from averaged four sets of 7dFR with averaged four FFQ, FFQ1 and FFQ4 collected during 9 months are shown in Table 4. Compared with antioxidant intake estimated from averaged four 7dFR, significant Spearman correlations to examine validity were found to fall within the range from 0·52 to 0·91 for averaged four FFQ except for γ-tocopherol and flavones, from 0·38 to 0·86 for FFQ1 except for γ-tocopherol and lutein + zeaxanthin, and from 0·38 to 0·78 for FFQ4 except for γ-tocopherol, lutein + zeaxanthin and flavones (P < 0·05). On the basis of all the antioxidants among averaged four FFQ, FFQ1 and FFQ4 compared with averaged four 7dFR, 4 %, 4 % and 9 % on average were misclassified into the opposite tertiles, respectively (Table 4). Correlation coefficients to estimate test–retest reliability between FFQ1 and FFQ4 collected 9 months apart were found to be higher than 0·5 for individual antioxidants and TAC (Table 5).
Table 4 Spearman correlation coefficients and misclassification percentage of dietary antioxidants and TAC between averaged four 7dFR, averaged four FFQ, FFQ1 and FFQ4 in overweight and obese postmenopausal women who completed four sets of 7dFR and FFQ during 9 months (n 35)Footnote *
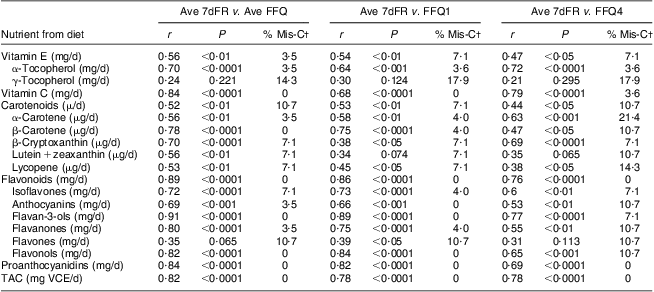
7dFR, 7 d food record; Ave FR, averaged four 7dFR, Ave FFQ, averaged four FFQ; r, Spearman correlation coefficient; % Mis-C, percentage of misclassification; TAC, total antioxidant capacity; VCE, vitamin C equivalent.
* Individual antioxidants and TAC were estimated from diet.
† Percentage of respondents categorized into the extreme opposite tertile.
Table 5 Spearman rank correlations between dietary antioxidants estimated from FFQ1 and FFQ4 in overweight and obese postmenopausal women who completed four sets of 7dFR and FFQ during 9 months (n 35)
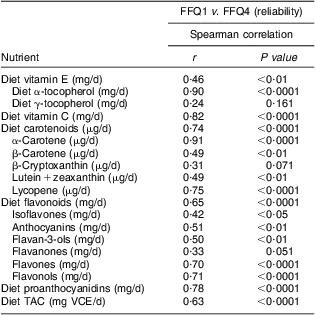
7d FR, 7 d food record; TAC, total antioxidant capacity; VCE, vitamin C equivalent.
Discussion
The present study demonstrated the reasonable validity of an FFQ to comprehensively assess short-term antioxidant intake in overweight postmenopausal women. It also validated this FFQ in estimating a longer-term antioxidant intake through justifying the seasonal variability of antioxidant intake. This extension improved the FFQ applicability in epidemiological and clinical settings. Different statistical methods were used for testing FFQ validity, including Spearman rank correlation, cross-classification and Bland–Altman plots. Biochemical surrogates were added as a comparison measure, as the measurement errors from biochemical markers and the FFQ are independent( Reference Hodge, Simpson and Fridman 32 ).
Daily intakes of vitamin C, several carotenoids and flavonoids, proanthocyanidins and TAC estimated from the 7dFR and the FFQ were generally comparable with a difference of 10 % to 30 %. However, daily intakes of vitamin E (α-tocopherol and γ-tocopherol), certain carotenoids (α-carotene, β-carotene and β-cryptoxanthin) and flavonoids (flavan-3-ols, flavanones and flavones) from the FFQ were considerably lower than those from 7dFR. These results, to some extent, emphasize that the FFQ could not be used for evaluating the absolute intake quantitatively. However, the FFQ is usually used to rank individuals in a target population according to dietary nutrients rather than to quantify estimates. Among these overweight postmenopausal women, we found moderate to high correlations of short-term antioxidant intake between the first set of FFQ and 7dFR. These validation data were generally comparable to those reported by previous studies using food records as a ‘gold standard’ reference method. Correlations observed between these two assessment tools were within the ranges noted by other investigators, from 0·27 to 0·71 for vitamin C( Reference Andersen, Solvoll and Johansson 33 – Reference Date, Fukui and Yamamoto 37 ), from 0·33 to 0·75 for vitamin E( Reference Henriquez-Sanchez, Sanchez-Villegas and Doreste-Alonso 38 – Reference Schroder, Covas and Marrugat 40 ) and from 0·14 to 0·38 for total carotenoids and respective subclasses( Reference McNaughton, Marks and Gaffney 41 , Reference Satia, Watters and Galanko 42 ). Additionally, since the correlation analysis for testing validity has been questioned for its failure in measuring agreement( Reference Bland and Altman 30 , Reference Willett 43 ), Bland–Altman plots and cross-classification were used in the present study to bridge this gap( Reference Labonte, Cyr and Baril-Gravel 44 ). Bland–Altman plots did not show any systematic bias. Cross-classification indicated an acceptable low misclassification percentage of antioxidant groups, although individual antioxidants had relatively higher non-agreements. Furthermore, positive associations were demonstrated for most antioxidants estimated from FFQ with plasma concentrations, although most correlation coefficients were less than 0·50. Nevertheless, diet–plasma coefficients observed for α-tocopherol and a number of carotenoid subclasses were within the range reported previously (sometimes higher)( Reference Hodge, Simpson and Fridman 32 , Reference McNaughton, Marks and Gaffney 41 , Reference Satia, Watters and Galanko 42 , Reference Dixon, Subar and Wideroff 45 ). Of note, as indicated before( Reference Dixon, Subar and Wideroff 45 ), plasma α-tocopherol level was probably not a good predictor of the diet source only, while including dietary supplements significantly improved the association. The use of plasma vitamin C and TAC is limited and did not produce consistent correlations( Reference Schroder, Covas and Marrugat 40 , Reference Pellegrini, Salvatore and Valtuena 46 ), suggesting a cautious approach is needed when using these surrogate measurements of dietary estimates. To summarize, the combination of correlation coefficients and agreement measurements as well as biochemical indicators provided sufficient data to support the overall ability of this FFQ in assessing antioxidant intakes during a short-term period in these overweight postmenopausal women.
However, in epidemiological studies, the underlying principle of using an FFQ is to obtain usual dietary exposures over weeks, months or years( Reference Ocke, Bueno-de-Mesquita and Goddijn 47 ). Dietary antioxidants have a greater daily variation than macronutrients( Reference Willett 43 , Reference Davis 48 ) and the corresponding food sources may be highly influenced by food availability. Therefore, to extend the period of dietary data collection using the FFQ, seasonal variability needs to be assessed using multiple FFQ collected every season during the reference period and validity also needs to be tested against multiple food records( Reference Henriquez-Sanchez, Sanchez-Villegas and Doreste-Alonso 38 ). We did not find a time effect on dietary antioxidant intakes over 9 months using four sets of both 7dFR and FFQ. Analysis of food sources contributing to specific antioxidant intakes indicated consistent consumption of major food contributors that most affected the corresponding antioxidants (data not shown). A number of previous investigations documented differences in fruit and vegetable consumption across chronologic seasons and found that vegetables were generally consumed year-round whereas certain fruits were eaten primarily in certain seasons( Reference Locke, Coronado and Thompson 49 , Reference Ziegler, Wilcox and Mason 50 ). However, few studies have measured the seasonal variation of antioxidant intakes. We identified a study that used an FFQ to assess seasonal impact on micronutrient intakes in Ireland( Reference O'Connell, Nolan and Stack 51 ). That study did not find any significant variation in micronutrient intake with respect to the month or the season. Nevertheless, convincing data have not been fully reported yet in this respect. In the present study, repeated 7dFR collected every season were used as a reference measure to compare long-term antioxidant intake against the FFQ and we found that this FFQ is capable of reflecting year-round antioxidant intake without being influenced by seasonal change. Moderate to high correlation coefficients of most antioxidants were observed between these two methods, which were within the ranges reported by previous studies( Reference Andersen, Solvoll and Johansson 33 – Reference Schroder, Covas and Marrugat 40 , Reference Block, Woods and Potosky 52 ), and only 4 % to ∼9 % of participants were allocated into the completely opposite tertile. Taking into account desirable cut-off values suggested by Masson et al. ( Reference Masson, McNeill and Tomany 53 ) (Spearman correlation coefficient above 0·5; less than 10 % for misclassification), most nutrients coincided with these cut-off standards except for γ-tocopherol, certain carotenoids and flavones. On the whole, based on different statistical methods, it can be concluded that this 1-month FFQ can be used for estimating long-term comprehensive antioxidant intake in this population.
This FFQ has matured sufficiently to exhibit several strengths. First of all, to the authors’ knowledge, this is the first FFQ developed to specifically investigate a complete antioxidant intake profile. Although previous studies have documented the assessment of antioxidant vitamins or certain flavonoids using an FFQ, no information is available in the literature about extensive estimations of individual antioxidant intake as well as dietary TAC. Second, validation of the FFQ in assessing antioxidant intake prudently considered the daily variation and seasonal change of antioxidant intake and the ‘gold standard’ reference. Third, multiple statistical approaches in the validity tests and comparisons with previous validation studies attested to the applicability and comprehensiveness of the FFQ tested. However, the interpretation of the present study is limited by a small sample size of overweight postmenopausal women from the north-east USA. The usefulness of this FFQ in this target group does not guarantee it would function well in other populations, especially with respect to the observed seasonal impact on antioxidant intake. As a result, the duration may be extended to 1 year and seasonal questions may be incorporated to improve the validity of the FFQ in different populations.
Conclusions
The new questionnaire generally provides a comprehensive antioxidant intake profile and reasonable rankings of self-reported dietary estimates through multiple statistical tools including correlation analysis, cross-classification and (more rigorously) biochemical surrogates. No significant seasonal variation of antioxidant intakes supports the applicability of this 1-month FFQ in capturing a usual dietary antioxidant pattern with respect to these overweight postmenopausal women. The validated comprehensiveness of this FFQ in assessing both short-term and long-term antioxidant intake may justify the use of this FFQ in associating dietary antioxidants with disease risks in this population.
Acknowledgements
Sources of funding: The present study was supported by the Donaghue Nutrition Research Program. Conflict of interest: All authors have no conflicts of interest to declare. Ethics: The study was approved by the Human Investigation Review Committees of the University of Connecticut Health Center and the University of Connecticut Institutional Review Board. Authors’ contributions: O.K.C. developed the concept. O.K.C. and M.Y. prepared the preliminary data, developed the FFQ and designed the validation study. M.Y., Y.W. and C.G.D. acquired the data. S.G.L. analysed the plasma biomarkers. M.Y. conducted the statistical analysis and drafted the manuscript. S.I.K., M.L.F. and E.C. provided technical support and advice as members of the project steering group. All authors were involved in the data interpretation and manuscript preparation. Acknowledgements: The authors would like to thank all of the postmenopausal women who participated in the study and colleagues in the General Clinical Research Center of the University of Connecticut Health Center for their help.


