INTRODUCTION
Following the emergence in 1997 of a new strain of avian influenza, A(H5N1), which is capable of infecting humans [Reference Li1], and the spread of this strain to Europe in 2005 [2], concerns were raised over the occurrence of a pandemic caused by A(H5N1) or a closely related strain [Reference Monto3, Reference Stephenson4]. Consequently, countries have been urged to strengthen their preparedness for an influenza pandemic [5], an important aspect of which is predicting the spread of infection.
According to the predictive models used to date [Reference Ferguson6–Reference Cooper12], influenza would spread worldwide over a period of 2–6 months, depending on the basic reproductive number (R 0), and reducing transmission would entail combining control measures, specifically, reducing contacts and performing both antiviral prophylaxis (AVP) and vaccination [Reference Ferguson7–Reference Germann9, Reference Colizza11, Reference Flahault13].
We developed a SEIR (susceptible–exposed, but not yet infectious–infectious–recovered, and no longer susceptible) deterministic model with a stochastic simulation component to predict the spread of pandemic influenza in Italy and to evaluate the impact of vaccination, AVP and social distancing measures.
METHODS
The SEIR model
We developed a SEIR model in which the population is structured according to age and region of residence. We defined six age classes: infants (0–2 years), children (3–14 years), teenagers (15–18 years), young adults (19–39 years), adults (40–64 years) and the elderly (⩾65 years). In the model, the national population (56 995 744 inhabitants) was also distributed in Italy's 20 regions, according to national demographic data obtained from the 2001 Census [14]. The contact matrix was defined by considering, separately, household, school/work-place and random contacts, and by using data on household composition, school attendance, and employment status. The transportation matrix was defined using data on national airline traffic [15]. The model consists of a system of differential equations, reported in the Appendix.
We also introduced a stochastic component that takes into account all of the random effects that are important during a pandemic's initial and final stages, when the number of infected individuals would be low. Precisely, whenever the deterministic prediction of the number of infected individuals in an age class/region was below the threshold value of 10, it was replaced by a Poisson variable with the same mean. In each simulation, the pandemic began with the introduction of five infected adults in the Lazio Region, where Rome's intercontinental airport is located.
Based on published studies [Reference Glezen16] and using the method described by Diekmann & Heesterbeek [Reference Diekmann and Heesterbeek17], we computed an R 0 of 1·8, which, when applying the contact matrix, corresponds to a cumulative infected attack rate (AR) of 35%.
Based on the literature [Reference Ferguson6, Reference Longini8, Reference Flahault18], in the model we assumed an incubation period of 1 day and an infectious period of 3·9 days. The results were obtained by averaging over 200 simulations for each scenario. For all of the results, the 5–95 percentile values of the AR estimates were within 11%.
Control measures
We considered both single and combined control measures, most of which are included in the Italian National Plan for preparedness and response to an influenza pandemic [19]. We assumed that two doses of vaccine would be administered, 1 month apart. The target population was divided into four categories: (I) personnel providing essential services (15% of the working population, aged 25–60 years) [14]; (II) elderly persons (aged ⩾65 years); (III) children and adolescents (aged 2–18 years); and (IV) adults (aged 40–64 years). We assumed a vaccination coverage of 60% of the target population, based on the 2005–2006 national influenza coverage [20]. We assumed that a period of 2 weeks would be necessary for administration of the vaccine to each target category. For vaccine effectiveness (VE) we made two different assumptions: (1) VE of 70% for all categories; and (2) VE of 50% for all categories; for both assumptions, we assumed that the VE would be reached starting 15 days after the second dose.
We considered different scenarios of vaccine availability; in one scenario, adequate VE would be reached 4 months after the first national case; in the second scenario, it would be reached after 5 months. An adequate VE at 4 months would be feasible only if the first dose contained an avian virus precursor of the pandemic strain [Reference Monto3], followed by a dose of pandemic vaccine; the actual VE of this regimen was assumed to be equal to that of two doses of the pandemic vaccine.
The AVP for uninfected individuals was assumed to reduce susceptibility by 30% and infectiousness by 70% [Reference Longini8]. We considered the administration of one course of antiviral drugs. We assumed that AVP would be provided to all household contacts of 80% of the clinical cases (66% of all infected individuals). We considered administration of AVP for the entire epidemic period; however, since the feasibility of actually doing this would be limited, we also considered other scenarios, i.e. administering AVP only for 2, 4, 8, or 16 weeks after the occurrence of the first Italian case. AVP was assumed to reduce the transmission rate among household contacts, based on the consideration that those household contacts already infected at the time of starting AVP would have a reduced infectiousness, therefore it would be as if only a fraction of them were actually infected; those not yet infected when starting AVP would benefit from both lower susceptibility and lower infectiousness.
We considered the nationwide closure of all schools, public offices, and public meeting places (e.g. restaurants, cinemas, and churches). We simulated the closure of schools for 3 weeks, public offices for 4 weeks and public meeting places for 8 weeks. We assumed that these measures would be introduced simultaneously, at different times (i.e. 2, 4 or 8 weeks after the start of the pandemic). In the model, school closure would reduce the contacts among children and teenagers (the school component of the transmission rate) by 75%; workplace closure would reduce the job component of the transmission rate by 16%; closure of public meeting places would reduce the random component of the transmission rate by 50%.
Sensitivity analysis
We evaluated how the results would change depending on different levels of pathogen transmissibility, with a resulting R 0 value of 1·6, 1·8 or 2·0. We also considered the resulting AR for the three R 0 values for the baseline scenario and for scenarios that differed in terms of the specific control measures adopted.
RESULTS
Baseline dynamics
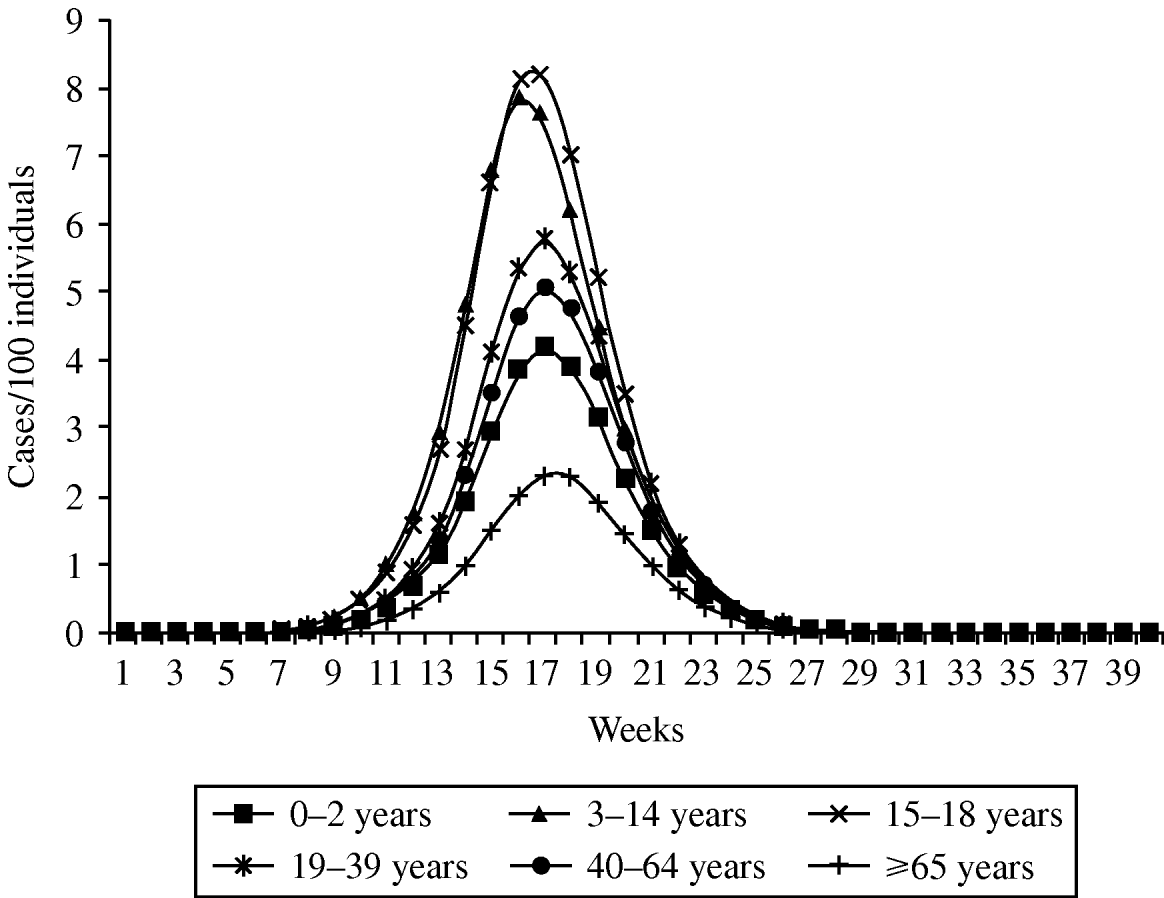
In the absence of control measures, the epidemic peak would be reached about 4 months after the identification of the first case, with a total of 3 million cases during the peak week. The epidemic would be over in 7 months, with a cumulative infected attack rate (AR) of 35% (about 20 million cases). The dynamics of the epidemic were similar in all age groups, whereas the AR varied markedly by age group. The incidence would be particularly high among those aged 15–18 years, with a AR of 54% (Fig. 1).

Fig. 1. Weekly attack rate, by age group, with no control measures.
Because of the model's stochastic component, the introduction of few infectious individuals in the population did not always result in an outbreak; in fact, in around 40% of the simulations, the number of infected individuals in the early stages of the pandemic was insufficient for sustaining transmission, and the epidemic expired spontaneously.
Single control measures
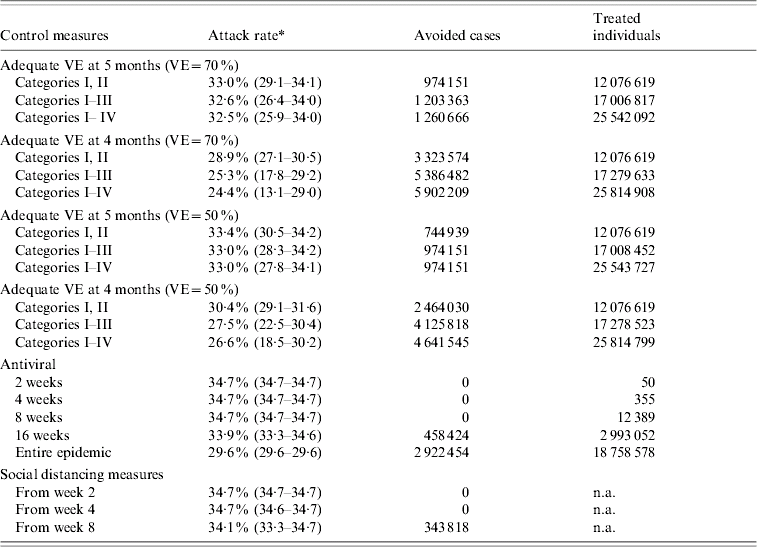
The impact of single control measures is shown in Table 1. The introduction of control measures frequently increased the probability of stochastic extinction of the pandemic. Vaccination seems to be the most effective measure, especially when VE is reached at 4 months. Vaccinating three of the four target categories (i.e. personnel providing essential services; elderly persons; and those aged 2–18 years) would reduce the AR from 35% to 25%, with almost 5 million cases avoided by treating about 17 million individuals. Vaccinating the fourth target category (i.e. the 40–64 years age group) would not result in an important additional reduction in the AR. If protective VE were reached at 5 months (two doses of pandemic vaccine), vaccinating all four categories, the AR would be 32·5%. Assuming a VE of 50% for all categories would not greatly affect the AR; in fact, the AR would be only 2 or 3 percentage points higher than the AR when assuming a 70% VE for all categories (Table 1).
Table 1. Effectiveness of single control measures on the dynamics of an influenza pandemic with an R0 of 1·8 and an attack rate of 35%, for different values of vaccine effectiveness (VE)

n.a., Not applicable.
For age categories see text (Control measures section).
* Value in parentheses represent the 5–95 percentile values of the attack rate estimates.
Social distancing measures and AVP were not effective in reducing the AR. However, providing AVP for 16 weeks after the identification of the first Italian cases and implementing social distancing measures starting at week 4 or week 8 would delay the epidemic peak by 1 or 3 weeks, respectively.
Combined control measures
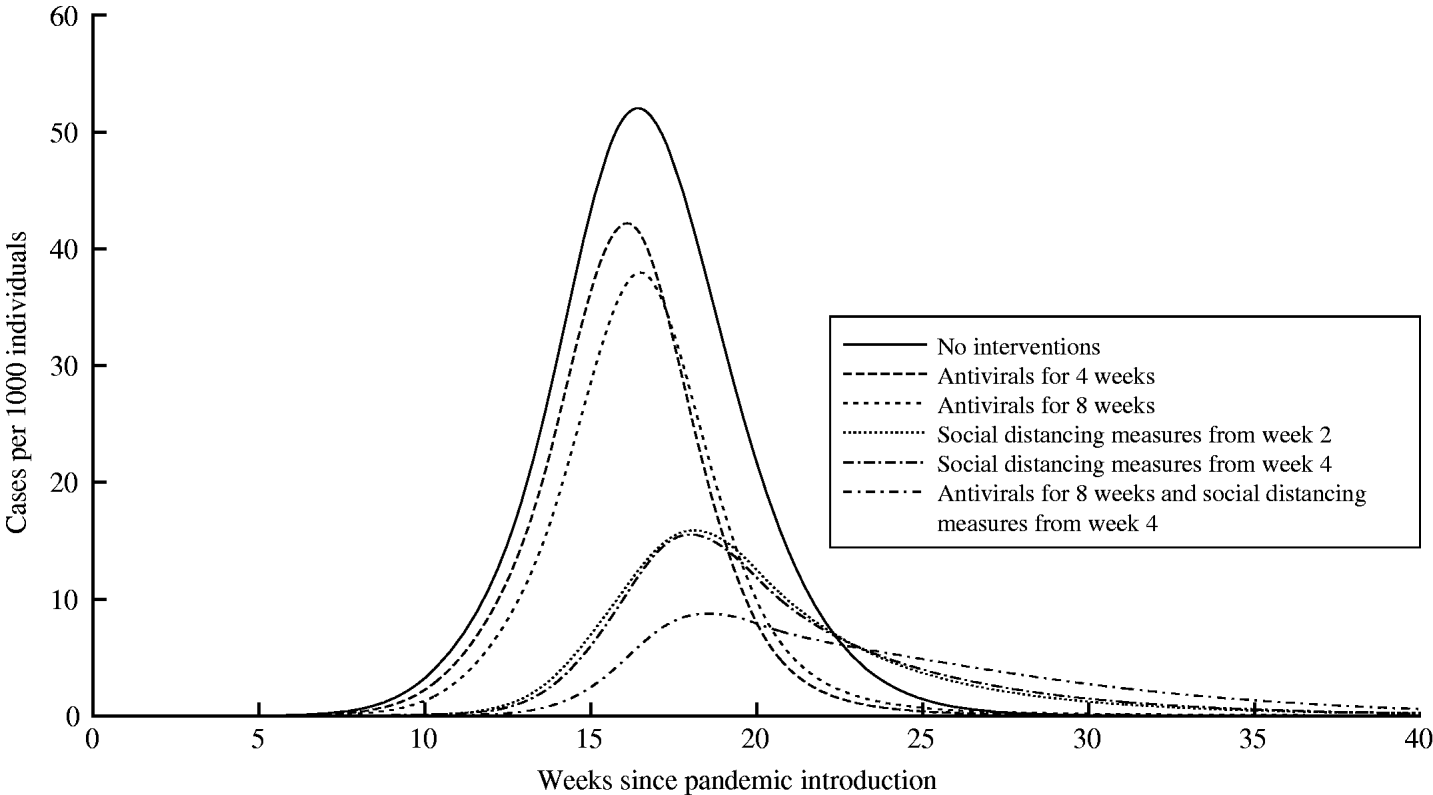
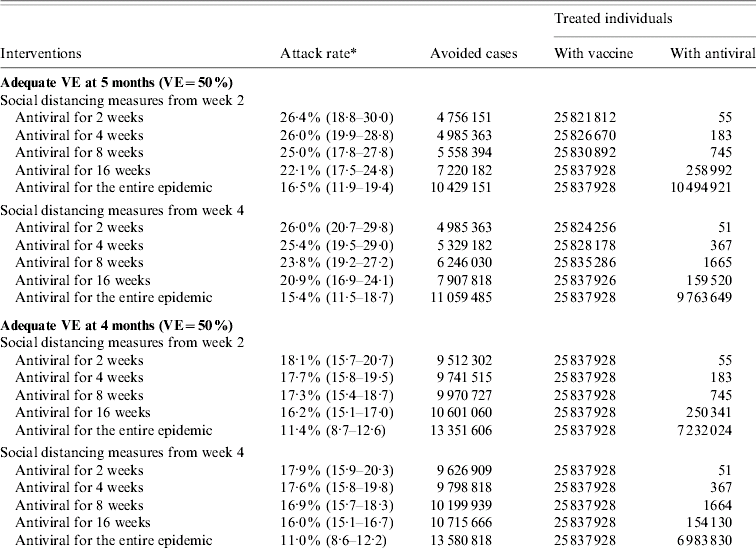
The combination of control measures would be more effective than single measures (Tables 2 and 3). The highest reduction (from 35% to 4·2%) would be obtained by starting social distancing measures at week 4, providing AVP throughout the entire epidemic, and performing vaccination with a VE of 70% at 4 months (when combining measures, we assumed that vaccination would be provided for all categories). This would allow for 17 million cases to be avoided by vaccinating around 26 million individuals and by providing AVP to about 3 million individuals. The AR would be higher (11%) if VE were reached at 5 months, avoiding 13 million cases by treating 25 million individuals and 7 million individuals with vaccine and AVP respectively (Table 2). Providing AVP for 16 weeks, instead of for the entire epidemic period, would increase the AR to 8·4% or 16·6% if VE were reached at 4 or 5 months, respectively. However, this would determine an important reduction in the number of treated individuals (about 150 000). Combining control measures would also increase the probability of stochastic extinction during the initial phases of the epidemic, due to a low number of infectious individuals. A VE of 50% for all categories considered would affect the AR estimates, but only when considering adequate VE at 4 months. In fact, the AR would be 6–8 percentage points higher than the AR assuming a VE of 70%, with a remarkable difference in terms of the number of avoided cases (Table 3). The impact of combined control measures (pre-pandemic vaccine in all categories and AVP and/or social distancing measures), compared to the baseline dynamics of the influenza pandemic, is shown in Figure 2.

Fig. 2. Impact of different combinations of control measures considering the use of a pre-pandemic vaccine provided to all categories (I–IV).
Table 2. Effectiveness of combined control measures on the dynamics of an influenza pandemic with an R0 of 1·8 and an attack rate of 35%, with 70% vaccine effectiveness (VE)

* Value in parentheses represent the 5–95 percentile values of the attack rate estimates.
Table 3. Effectiveness of combined control measures on the dynamics of an influenza pandemic with an R0 of 1·8 and an attack rate of 35%, with 50% vaccine effectiveness (VE)

* Value in parentheses represent the 5–95 percentile values of the attack rate estimates.
Sensitivity analysis
The results of the sensitivity analysis are shown in Figure 3. For R 0=1·6, the epidemic could be mitigated with moderate efforts; all strategies would be successful independently of the timing of vaccination, of the duration of providing AVP, and of the timing of social distancing measures. For R 0=1·8, vaccinating the target categories with a pre-pandemic vaccine, providing AVP for 16 weeks, and implementing social distancing measures for 4 weeks would reduce the AR from 35% to10%. For R 0=2, this combination of control measures would result in a less marked decrease in the AR, from 42% to about 20%.

Fig. 3. Total attack rates for different values of R 0, with no control measures or selected control measures.
CONCLUSIONS
Our results, considering an R 0 value of 1·8, confirmed the need to combine different control measures [Reference Ferguson7–Reference Germann9]. In fact, none of the single measures was shown to be effective in containing the pandemic, with the AR decreasing at most from 35% to 24%. Combining measures would be more effective, especially if using the pre-pandemic vaccine (reaching VE at 4 months). In this case, the AR would be 4·2%, but this would require an extremely high number of AVP doses. Providing AVP for 16 weeks only would increase AR to 8·4%, which is similar to that observed during severe seasonal epidemics [Reference Bella21], with a considerable reduction in the number of doses provided. Moreover, if the time to reach adequate VE were 5 months, assuming a different VE (i.e. 70% or 50% in all categories) would not substantially affect the AR. However, if the time to reach adequate VE were 4 months, a VE of 70% would result in an AR of 4·2%, compared to 11·0% if assuming a VE of 50% (i.e. a 50% difference in the AR). In any case, using a less effective vaccine (i.e. with a VE of 50%) would nonetheless allow the pandemic to be contained, with an AR below 18% (range 11·0–18·1%).
Combining different measures markedly increased the probability of stochastic extinction during the early phases of the pandemic. To the best of our knowledge, most of the SEIR models used to simulate a pandemic do not consider the stochastic factors, which can strongly influence the dynamics of the pandemic in its early phases. However, we assumed that no other infectious individuals would enter the country after the few initial cases. If we were to assume that infectious individuals continued to enter the country, then stochastic extinction would be less important.
Another important finding is that the decrease in the AR would depend on which target groups were vaccinated. If a pandemic were to occur, vaccine supplies would be limited and the target groups would have to be prioritized (i.e. personnel of essential services, elderly persons and persons with chronic disease, children and young adults, and healthy adults) [19], requiring the vaccination of 26 million persons with two doses, that would be very difficult to put in practice if a pandemic did occur. However, as reported in other studies [Reference Germann9], our results showed that, independently of the VE, the vaccination of children and young adults would considerably reduce the incidence in other age groups (i.e. resulting in ‘herd immunity’), probably because of the important role of children and adolescents in the spread of influenza, as also observed in inter-pandemic periods [Reference Brownstein, Kleinman and Mandl22].
In interpreting our results, some limitations need to be considered. First, we assumed that AVP provided to household contacts would decrease transmission within households but not in other contexts, which could have resulted in an underestimate of the effect of this measure. Second, the parameters used in our model obviously influenced the time estimated for the pandemic to evolve, although our estimate is similar to those obtained in other studies based on deterministic SEIR models on a global [Reference Flahault13] or local [Reference Roberts23] scale or individual-based models [Reference Ferguson6–Reference Germann9]. We examined this issue by performing a sensitivity analysis; clearly, the success of control strategies would be strongly influenced by the R 0: for R 0=1·6, all strategies would be quite successful, whereas for R 0=2 only the combined strategy with a pre-pandemic vaccine would satisfactorily mitigate the pandemic. Although the absolute effect of control strategies is strongly influenced by the different values of R 0, the relative worth of strategies are independent from the different R 0 values.
Another important limitation is that mathematical models cannot take into account the fact that the past influenza pandemics in Europe and Italy occurred over two consecutive winters, with the highest AR in the second winter [Reference Viboud24–Reference Rizzo26]. This two-wave pattern is probably an effect of the closing of schools during the summer. Thus our model probably depicts a ‘worst case scenario’, which could be useful in evaluating control measures [Reference Germann9].
Our simulations show that appropriate and prompt measures, when combined, could be effective in containing an influenza pandemic. Timing is also essential, and measures that at first glance appear to be less important, such as increasing social distancing, could be extremely useful in delaying the epidemic peak and thus providing more time for vaccines to be produced. Implementing such measures, however, would entail organizing a variety of both medical and non-medical resources, and some measures, such as the closure of schools, would also have a social impact.
ACKNOWLEDGEMENTS
This work has been partially funded by the EPICO Project, of the Provincia Autonoma di Trento, Italy. The authors thank Mark Kanieff for revising the manuscript.
APPENDIX
The equations of the model are

where 1/η and 1/γ represent, respectively, the mean length of the latent and the infectious periods and βi,jp,q is the transmission rate between an individual of class i in region p and an individual of class j in region q.
DECLARATION OF INTEREST
None.


