Introduction
The stable water isotope signal in ice-core records is known to be a proxy for past climatic conditions. In mid-and high-latitude regions there is a clear seasonal cycle in the 1H16O2H and 1H18O1 H isotope concentration of precipitation water (Reference DansgaardDansgaard, 1954). In a cold enough environment the precipitation falls as snow and is stored in ice masses. However, the original isotope signal in the precipitation may not be fully preserved in the ice. The main process responsible for changes after deposition is diffusion in the firn. This was first discovered by Reference LangwayLangway (1967), and is mainly due to random movement of water vapour in the pores of the firn, leading to an overall smoothing of the original signal. Other processes that may alter the isotopic composition of the firn include ventilation of the top few metres of firn and sublimation at the surface of the firn. Recently, several laboratory experiments have been performed to study these processes (e.g. Reference Neumann and WaddingtonNeumann and Waddington, 2004; Reference Neumann, Albert, Lomonaco, Engel, Courville and PerronNeumann and others, 2008; Reference Ekaykin, Hondoh, Lipenkov and MiyamotoEkaykin and others, 2009; Reference Sokratov and GolubevSokratov and Golubev, 2009).
In our laboratory study we tried to minimize other post-depositional effects and focus on diffusion, a process for which theoretical descriptions were developed by Reference JohnsenJohnsen (1977), Reference Whillans and GrootesWhillans and Grootes (1985) and Reference Johnsen, Clausen, Cuffey, Hoffmann, Schwander, Creyts and HondohJohnsen and others (2000). These theories were developed to enable a correction, usually called back diffusion or deconvolution, to the measured ice-core signals to estimate the original precipitation signal, which can then be used as a proxy for past climatic parameters. Different strategies used for back-diffusing the isotope signals have been explored by Reference Bolzan and PohjolaBolzan and Pohjola (2000). Recently, the interest in water isotope diffusion in firn increased as diffusion not only deteriorates the isotope signal but also carries a climatic signal itself. This signal can be found by comparing the diffusion for different isotopes. Reference Johnsen, Clausen, Cuffey, Hoffmann, Schwander, Creyts and HondohJohnsen and others (2000) showed how the different fractionation factors for different water isotopes lead to different diffusion rates. As this difference in diffusion rate depends only on the temperature of the firn, it can be used as an independent proxy for past local temperatures. This differential-diffusion method relies on an accurate quantitative description of the isotope diffusion rates. Crucial data for the back-diffusion process, and even more so for the differential-diffusion process, are the isotopic fractionation factors for phase transitions between ice and vapour. Laboratory experiments to measure these were performed by Reference Merlivat and NiefMerlivat and Nief (1967) and Reference MajoubeMajoube (1970). Although these were carefully performed, the system under investigation was not firn and we found it worthwhile to check the fractionation factors in a medium that better resembled firn.
Previous attempts have been made to measure the full diffusion process in snow in controlled laboratory experiments. In these experiments two isotopically distinct portions of snow are placed together and the isotopic concentrations are followed in time. Reference Jean-Baptiste, Jouzel, Stievenard and CiaisJean-Baptiste and others (1998) used so-called diffusion couples, in which the different portions of snow were placed next to each other, to create a step function in the original isotope profile. Reference Pohjola, Meijer and SjöbergPohjola and others (2007) also studied the influence of the wavelength of the signal: instead of a single step function they sandwiched several layers with different thicknesses. In their experiment they found much higher diffusion rates for the thick layers, and much lower diffusion rates for the thin layers, than predicted by theoretical models. As wavelength is a mathematically trivial parameter in the process, these results were puzzling, and they concluded itwas due to some artefact in the set-up of the experiment. It was suspected that the parameterization of the tortuosity of the snow, which is a measure of the shape of the channels in the firn, was too simplistic as it was a function of density only. To investigate this further we performed similar experiments with slightly different experimental set-ups. In the studies of Reference Jean-Baptiste, Jouzel, Stievenard and CiaisJean-Baptiste and others (1998) and Reference Pohjola, Meijer and SjöbergPohjola and others (2007) the snow used was created by shaving or crushing blocks of ice to obtain grains similar in size to real polar snow. In our study we performed two experiments with snow that was produced with a snow gun in a cold room.
First, we discuss the diffusion process and the dependencies of the firn diffusivity on several parameters, such as density, temperature and structure of the firn. We also show how the difference in diffusion between different isotopes can be related to the temperature of the firn. We go on to discuss the set-up of the two experiments and the sampling procedure. We then present our results and compare the measured diffusivities with the theory. We then use the ratio of the firn diffusivities of deuterium and oxygen-18 to relate this to the temperature of the firn. This illustrates how our method can be used to measure the ice–vapour fractionation factors. Finally, we give an estimate of the uncertainties present in our experiment and suggest how it can be improved.
Theory
Considering only one spatial dimension, the effect of diffusion on the isotope concentration, C, is described by Fick’s second law as:
where Ω is the diffusion coefficient or diffusivity and t and z are the temporal and spatial coordinates, respectively. Variations in the absolute isotope concentrations are very small and difficult to measure with high precision. It is therefore common practice to express the concentration of a sample as the deviation from a reference material. The deviation is denoted by δ and is defined as:
where R is the abundance ratio of the rare isotope with respect to the abundant isotope (e.g. 2H/1H). As the difference between concentration and ratio is very small for the rare isotopes, to a good approximation the diffusion equation is also valid using the δ notation. Thus for the diffusion of water isotopes in firn we can write:
where the subscript i refers to one of the heavier isotopes (2 for deuterium and 18 for oxygen-18) and Ωfi is the firn diffusivity, for which an expression was derived by Reference Johnsen, Clausen, Cuffey, Hoffmann, Schwander, Creyts and HondohJohnsen and others (2000):

Here m is the molar mass of water, R the gas constant and T the temperature (K). ρ f and ρ ice are the firn and ice density, respectively. For the water vapour saturation pressure, p sat, (Pa) we use the parameterization given by Reference Murphy and KoopMurphy and Koop (2005):
Other temperature-dependent factors in the diffusivity Equation (4), are the ice–vapour fractionation factor, αi , and the diffusivity of water vapour in air, Ωai . These two parameters also depend on the isotope under consideration. For the most abundant water molecule, 1H2 16O, the diffusivity in air (m2 s−1) is

where T is temperature, T 0 = 273.15 K, p is the pressure and p 0 = 1 atm (Reference Hall and PruppacherHall and Pruppacher, 1976). Reference Cuffey and SteigCuffey and Steig (1998) use a slightly different expression for the temperature-dependent part of this equation, which (through Reference Whillans and GrootesWhillans and Grootes, 1985) dates back to Reference Geiger and PoirierGeiger and Poirier (1973). Their value for the diffusivity in air is higher by 2–4% in the range from 0 to −25°C.
For water molecules containing one of the heavy isotopes the diffusivity is lower (Reference MerlivatMerlivat, 1978):
The ice–vapour fractionation factors, i.e. the difference in ratio of rare and abundant isotopes in ice and vapour under equilibrium conditions, are functions of temperature and were measured by Reference Merlivat and NiefMerlivat and Nief (1967) for deuterium and by Reference MajoubeMajoube (1970) for oxygen-18:
The set-up they used established an isotopic equilibrium between the ice and vapour phases, but in a system quite different from firn. Finally, the tortuosity, τ, depends on the structure of the open channels in the firn. We adopt the parameterization as a function of the density of the firn given by Reference Johnsen, Clausen, Cuffey, Hoffmann, Schwander, Creyts and HondohJohnsen and others (2000):

The effect of diffusion is an overall smoothing of the original signal. The general solution to Equation (3) given an initial profile δ 0(z) is a convolution of this initial profile with a Gaussian distribution:

The amount of smoothing is determined by the width of the Gaussian curve, σ. The physical meaning of this width is the diffusion length, which is the average displacement of the water molecules. Its squared value is directly related to the isotopic diffusivity in firn and the elapsed time:

In our experiment we aim for constant firn diffusivities in time, which allows us to write this as:
Even when the diffusivities are not truly constant in time, as a result of small changes in temperature or density for example, Equation (12) can still be used to a good approximation using the time-averaged value for the diffusivities. We use Equation (10) to find the diffusion length from our measurements and then compare the diffusion lengths for the different isotopes, oxygen-18 and deuterium. This can be related to the temperature of the firn by taking the ratio of the diffusion lengths and using Equation (12):

Inserting Equation (4) and cancelling all common terms, this gives:
Combining this with Equations (6– 8), we obtain thefollowing expression for the ratio of the firn diffusivities:
Thus, by taking the ratio of the firn diffusivities, all the factors common for both isotopes (e.g. density and tortuosity) drop out of the analysis and we are left with a function of the temperature of the firn only. This illustrates how firn diffusion can be used to obtain a proxy for past local temperatures. An important requirement for this method is a good quantitative understanding of the diffusivity in air and the fractionation factors, given in Equations (7) and (8), respectively.
The experiments we describe here can be used to determine values for the firn diffusivities, Ωf2 and Ωf18, independently, since the temperature of the firn is measured throughout the experiment. From Equation (4) it is clear that these values depend on a number of parameters. The isotopic fractionation factors, α i, the air diffusivities, Ωai , and the tortuosity, τ, have been independently determined in laboratory experiments. Their parameterizations are subject to uncertainties, with the tortuosity likely to have the largest uncertainty. In the event of discrepancies between the theoretical values of the diffusivity and those calculated from our experiment, it will be impossible to conclusively attribute the source of such discrepancies, but tortuosity is the most likely source. The diffusion ratio (Equations (13) and (15)), however, does not depend on the tortuosity or density of the firn. Therefore, by comparing not only the firn diffusivities with literature values but also their ratio, our experimental results check both the tortuosity parameterization (Equation (9)) and the isotopic fractionation factors involved independently.
Experiment
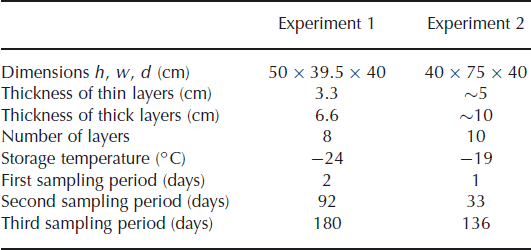
We measured the isotope diffusion rates in firn in two experiments, in a set-up similar to the experiment of Reference Pohjola, Meijer and SjöbergPohjola and others (2007). Snow made from isotopically enriched water was interlayered with snow made from natural water. The snow was made in a cold room (∼−30°C) using a snow gun. The very fine spray of water droplets produced by the snow gun precipitates as dry, fluffy snow. The isotopically different portions of snow were stored in a box in alternating layers of different thicknesses. The box was stored in a freezer in which the temperature was kept approximately constant throughout the experiment. To minimize any temperature variation of the snow due to the duty cycle of the freezer, the inside of the box was insulated with Styrofoam plates. In the second experiment the box was equipped with sensors, measuring the temperature at 30 min intervals. Two sensors were placed on the outside of the box, at either end. Another two sensors were attached inside the Styrofoam plates to measure the temperature inside the box. Details of the experimental set-up are summarized in Table 1.
Table 1. Details of the experimental set-up
In both set-ups we chose to layer the snow vertically (i.e. interfaces between layers are vertical planes), in contrast to the experiment described by Reference Pohjola, Meijer and SjöbergPohjola and others (2007), where the layers were horizontal. During the experiment the snow in the box compresses due to its own weight. The compression will be larger at the bottom of the snow stack than at the top, which for horizontal layers means that the thicknesses of the layers change. For vertical layers the compression does not affect the layer thickness, facilitating comparison with theory.
To ensure no mixing of the layers during construction of the firn stack, in the first experiment thin plates were placed in the box separating the different layers while the box was filled. This has the advantage that the thickness of each layer is known exactly. The plates were removed once the box was filled. This method has the disadvantage of leaving a small gap between the snow layers after removal of the plates, which slowly fills due to densification. This gap may have caused the difference observed (noted below) in the diffusion rate between the thick and thin layers. We therefore decided to fill the box with horizontal layers in the second experiment. The snow was added by placing a portion of the created snow in a sieve over the box. The sieve was shaken gently to let the snow fall into the box. After applying a layer of snow the bottom plate of the box was moved down to form the base of the next layer, and snow from the other isotopic phase was added. This ensured that the layers were completely in contact with each other, but had the disadvantage that the thickness of each layer was not exactly known. Also, when the bottom of the box was lowered after applying a layer of snow, small gaps between the snow and the box occurred at the edges. These gaps might then be filled with snow of the other isotopic composition, causing unwanted mixing of the layers in these areas. Once filled, the box was closed and rotated 90° so the layers were stored vertically to prevent further compression of the profile.
In the first experiment the snow was stored in four thick layers (6.6 cm) and four thin layers (3.3 cm). Diffusivity does not depend on the thickness of the layers but it does smooth the thinner layers more (Equation (1)), leading to a larger reduction of the amplitude of the concentration profile. The box was stored for 180 days in a freezer room, with the temperature controlled at −24°C. In the second experiment, thicker layers were made to reduce the influence of sampling errors. The set-up consisted of five layers of ∼10 cm and five layers of ∼5 cm. In this experiment the box was placed inside a freezer kept at −19°C.
The snow stacks were sampled at given time intervals (Table 1). In the first experiment, only the top of the diffusion box could be removed without disturbing the snow stack. Therefore, samples were only taken from the top of the box. However, due to densification of the snow a small air space formed at the top of the box, so transport of water molecules will have taken place not only in the pores of the snow but also in this air space. As the diffusivity of water vapour is larger in air than in firn, the isotope signal measured from samples taken at the top of the firn stack is likely to be influenced by this process. Only at the last sampling, when the firn stack was taken apart, was it possible to take samples from below the surface.
In the second experiment the box design was such that every side could be removed from the box separately, leaving the other sides undisturbed. This allowed sampling at multiple positions and addressed the problem of sampling in a region in which the isotope profile may be disturbed by diffusion of water molecules through air spaces. Only the initial sampling, immediately after construction of the snow stack, was done at the top. At this stage no diffusion had taken place. The second and third samplings were taken halfway down the left and right side of the box, respectively. For the fourth and final sampling it was planned to take samples from the centre when the snow stack was taken apart. Unfortunately, the snow stack was subject to a melt event after a power outage to the freezer before this last sampling period.
Measurements
In the first experiment the snow stack was sampled after 2 and 92 days and at the end of the experiment after 180 days. The ∼1 cm thick samples were measured at the Centre for Isotope Research, Groningen, using a custom-built CO2 equilibration system connected to a SIRA 10 IRMS (isotope ratio mass spectrometer) for the oxygen-18 isotope measurements, and a chromium furnace (Eurovector PyrOH) connected to a Micromass Isoprime continuous flow IRMS for the deuterium measurements. For the samples with a natural isotope abundance the uncertainty in the measurements is estimated to be 0.07‰ and 0.6‰ for oxygen-18 and deuterium, respectively. For the isotopically enriched samples the uncertainty increased to 0.2‰ and 2‰.
The measured isotope profiles for the first experiment are shown in Figure 1. During the final sampling, samples were taken from the top as well as from the bottom of the snow stack. A difference in the isotope profiles between these two locations can be expected as diffusion through the free air space at the top of the snow stack will enhance the diffusion rate. Also, due to compression of the firn, there may be a difference in the density of the snow between the top and the bottom. Comparison of the two profiles confirms that diffusion effects are much stronger at the top than at the bottom of the snow stack.
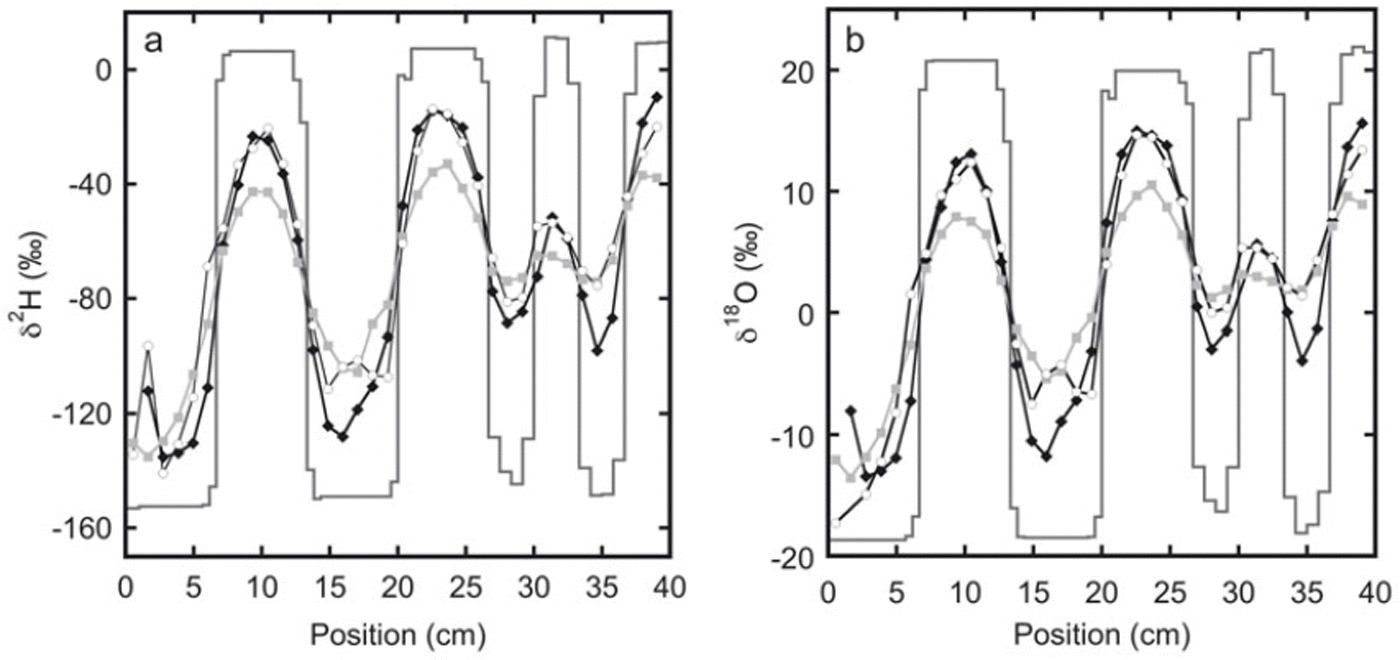
Fig. 1. The measured isotope profiles for experiment 1 as a function of horizontal position. Samples were taken soon after construction of the snow stack (solid lines) and after 92 days (black diamonds). At the end of the experiment, after 180 days, samples were taken from the top of the snow stack (grey squares) as well as from the bottom of the snow stack (white circles).
The measured isotope profiles for the second experiment are depicted in Figure 2. In spite of the somewhat higher temperature (−19°C compared with −24°C for the first experiment), due to the larger layer thicknesses in this experiment the relative reduction in amplitude is much smaller than in the first experiment. In an absolute sense the reduction is larger, as a result of the much higher isotopic gradient at the start of the experiment.
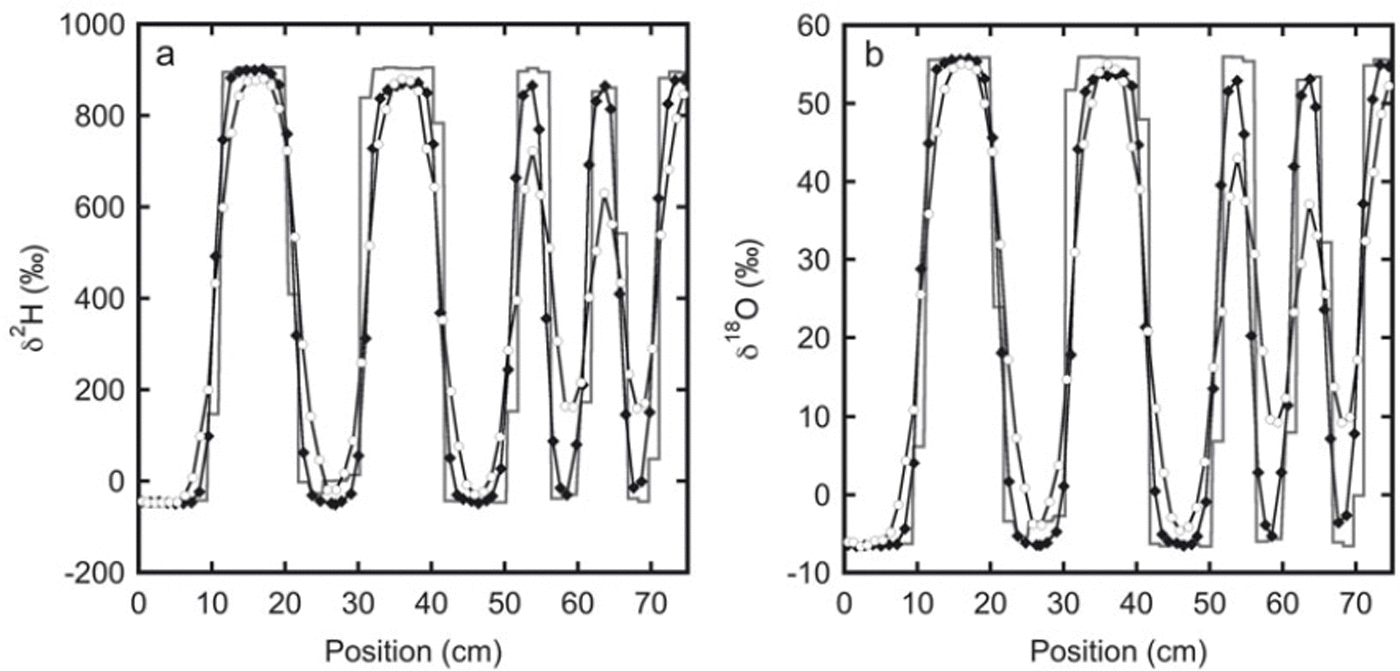
Fig. 2. The isotope profiles for experiment 2: (a) deuterium and (b) oxygen-18. The initial sampling is represented by the solid line. These samples were taken from the top of the snow stack. The black diamonds indicate samples taken after 33 days from one of the sides of the stack. The next sampling was done at the opposite side of the stack after 136 days (white circles). Between 20 and 30 cm the initial profile has a lower amplitude than the profile after 33 days. This is most likely caused by mixing of snow at the sides of the box during filling. Therefore, in the second and third sampling, samples were not taken directly at the surface, but a few centimetres below.
In the second experiment the temperature was measured at 30 min intervals over the whole storage period. The estimated accuracy of the temperature sensors is 1°C. The temperature measurements are given in Figure 3. In the first 10 days the temperature of the snow slowly rose as it was placed in the freezer kept at −19°C, which was warmer than the room in which the snow was produced. The temperature outside the box varied slightly due to the duty cycle of the freezer. The insulation in the box, however, dampened these oscillations, and the the temperature inside the box stayed constant at ∼−19°C for most of the experiment. During sampling of the firn the box was placed in a colder room (at ∼−35°C), which explains the lower temperature at 33 and 136 days (Fig. 3a). At the same time the temperature sensors on the outside of the box were temporarily removed from the box and stored outside the freezer, hence the higher temperatures recorded by these sensors at these times.
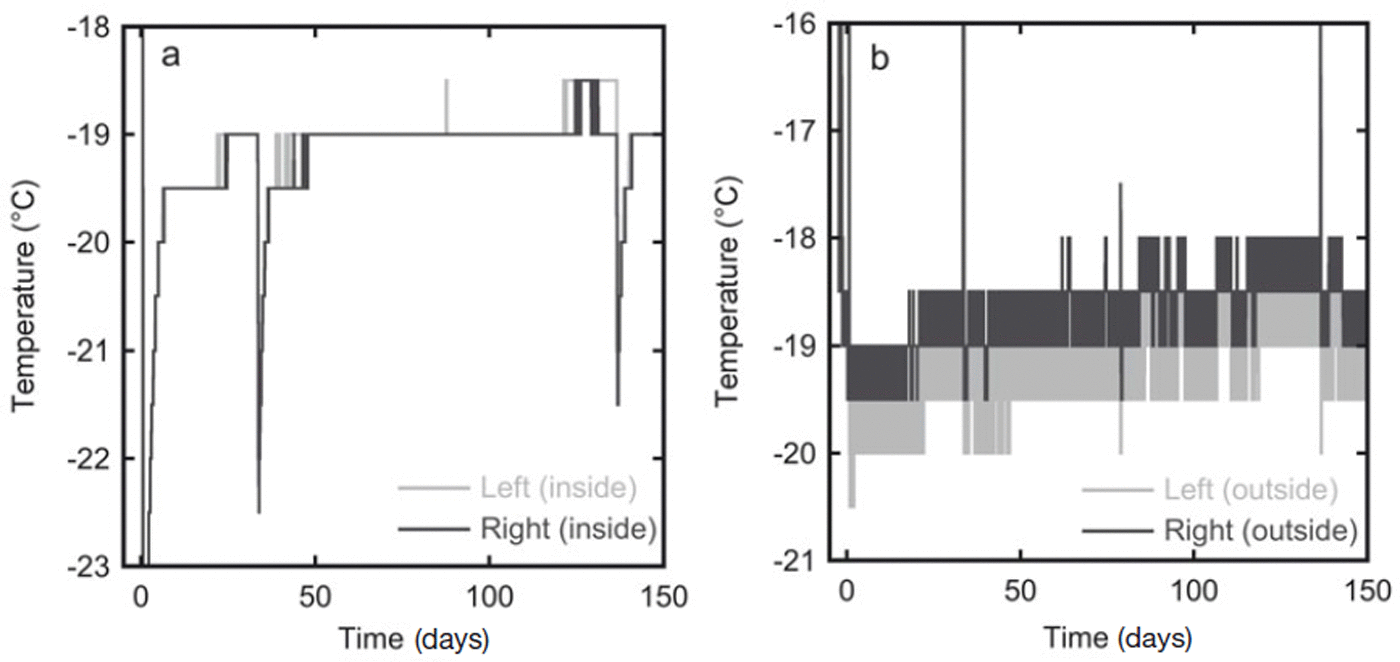
Fig. 3. In experiment 2 the temperature was recorded throughout the whole storage period at four locations. (a) The temperature records from the two sensors inside the diffusion box show an almost constant temperature of −19°C. (b) Temperature variations are stronger on the outside of the box, probably because of the duty cycle of the freezer in which the box is stored. The sensor on the right side of the box is expected to have the strongest variations as this side is closest to the fan of the freezer.
Results
Equation (10) relates the diffused isotope profile to the initial profile, where the amount of smoothing is governed by the diffusion length, σ. Given the initial profile measured at the start of the experiment and the diffused profiles at given time intervals, this equation can be used to determine the diffusion length through a data-fitting procedure.
The measured initial profile is subject to sampling errors, leading to some variability in the measured values of snow from the same isotopic phase. If samples are taken at a slight angle with respect to the surface, snow from one layer may mix with that of a different layer. In the second experiment it is also possible that snow from different layers mixed during creation of the snow stack. This is especially likely at the edges of the snow stack where the samples were taken and probably occurred for the layer between 20 and 30 cm, as can be seen in Figure 2. In the second and third sampling, this contamination was minimized by removing the first 1 cm of snow from the surface before samples were taken. To prevent these sampling errors from propagating into our calculation of the diffusion length we use an idealized block-shaped profile as our initial profile. The isotopic values for the maxima and minima in this idealized profile are based on the measured values.
In the second experiment the position of the boundaries between the different layers was not fixed by the experimental set-up. Therefore, it is possible that not all the thin or thick layers have exactly the same thickness. In addition, the layer thickness may not be homogeneous, i.e. it may be slightly larger on one side of the box than on the other. As sampling did not always take place at the same location, the thickness of certain layers may differ between the different sample locations. This may lead to a mismatch between the boundary positions of the diffused profile and the initial profile, which can significantly influence the obtained diffusion length. To minimize this mismatch an extra step is taken in the fit procedure. First, an initial profile is created using an estimate of the boundary positions. The measured diffused profile is then fitted to a Gaussian convolution of this initial profile using Equation (10) with the diffusion length, σ, as the free parameter. The fit minimizes the squared deviations between the measured values and the fitted values using a Nelder–Mead simplex method. Using the obtained value for the diffusion length the next fit is performed with the same equation, but now with the boundaries between the layers in the initial profile, δ 0, as free parameters. This fit is done for both isotope profiles (oxygen-18 and deuterium) simultaneously, as they have the same boundary positions. The last step is another fit with the diffusion length as the free parameter, using the new values for the boundaries in the initial profile. In the first experiment the boundaries were well defined by the construction of the snow stack, so these extra steps in the fit procedure were unnecessary, and in the first experiment only one fit was made, with fixed boundary positions.
Fits for the first experiment are shown in Figure 4. For the thick layers there is a good match between the data and the fit. For the thin layers, however, the fit is poor. This difference in diffusion rate between thick and thin layers was also observed by Reference Pohjola, Meijer and SjöbergPohjola and others (2007). A large difference in temperature or density of the snow between the thick and thin layers could account for this. However, we have no reason to assume such a gradient. A more likely explanation for these observations is that they are caused by the experimental set-up. The layers were separated from each other by plates during construction of the firn stack. Once the box was filled, these plates were removed, but the small gap left between the layers may not have filled up quickly enough by compression of the firn to ensure contact between the layers. Also, the removal of the plates may have caused a blockage of the air channels at the interface, so the description for the tortuosity (Equation (9)) is no longer valid at these locations. Reference Pohjola, Meijer and SjöbergPohjola and others (2007) also suggested that the description of the tortuosity as a function of density only is an oversimplification and that this was the main reason for the difference they observed between the different layers. At the end of our first experiment, the adjacent firn layers were easily separated from each other, confirming that they had not completely sintered together. Thanks to our composition of the snow stack, with several layers with different thicknesses, we were able to discover this flaw in the experimental setup. A similar effect may have influenced the earlier results of Reference Jean-Baptiste, Jouzel, Stievenard and CiaisJean-Baptiste and others (1998), but would have remained unnoticed, as they only used diffusion couples.

Fig. 4. Fit of the measured profiles of experiment 1 to a Gaussian convolution of the initial profile. The lower data show the oxygen-18 measurements and fit. The deuterium measurements and fit are given by the upper profile. The original layering is illustrated by grey shading in the background. (a) Samples taken from the top of the firn stack after 180 days. (b) Samples taken at the same time from the bottom of the firn stack. In both profiles the fit overestimates the diffusion in the thin layers.
In the second experiment the two snow phases were put directly in contact with each other during construction of the snow stack, and here we find much better agreement between the thick and thin layers (Fig. 5). In this experiment the layers were on average thicker, reducing the influence of sampling errors.
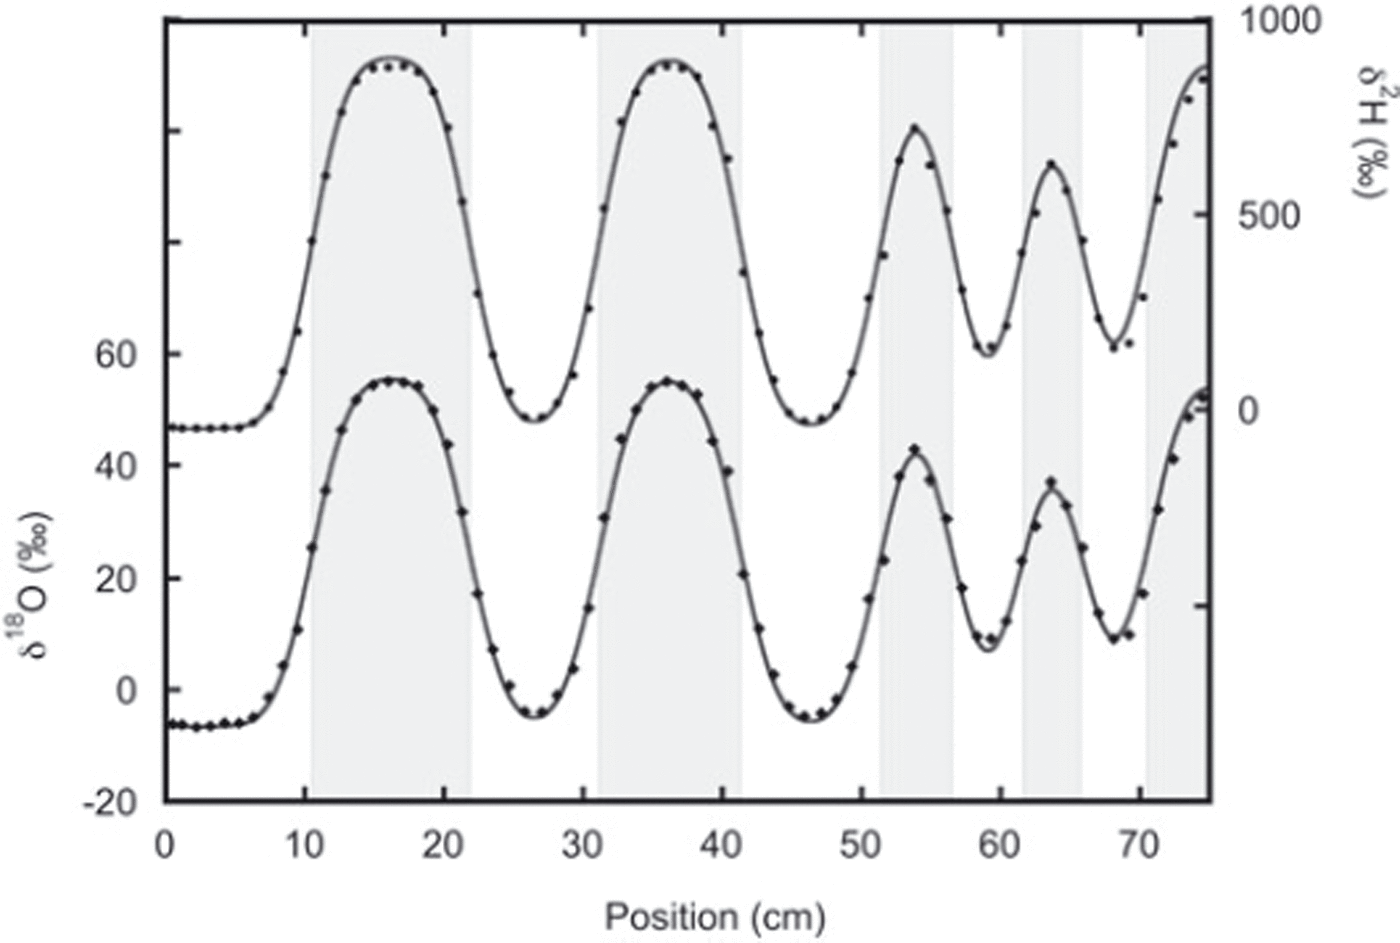
Fig. 5. Data from the second sampling of experiment 2 with the best fit to the diffused initial profile. The lower data are the oxygen-18 measurements and fit. The deuterium measurements and fit are given by the upper data. In this experiment, agreement between thin and thick layers is much better than in experiment 1. The fit is performed after optimizing the positions of the boundary between the different layers (indicated by the grey shading).
As the results of the second experiment are in much better agreement with theory, we use them to compare with the literature. Using the best fit for the diffusion length (1.99 ± 0.03 cm for deuterium and 2.10 ± 0.03 cm for oxygen-18) and Equation (12) with t = 136 days, we find:
These measured isotopic diffusivities can be compared with predicted values using Equation (4). For these theoretical values we assume a constant temperature of −19°C and a density of 415 kg m−3. The value for density is an average of values obtained by weighing samples of known volume during the second and third sampling. The estimated uncertainty in the density is ±15 kg m−3. We assume a pressure of 1 atm in calculating the diffusivities of water vapour in air (Equation (6)) as the experiment took place only a few metres above sea level. Using these values in Equation (4) we find isotopic diffusivities in firn of (1.44 ± 0.14) × 10−11 and (1.65 ± 0.16) × 10−11 m2 s−1 for deuterium and oxygen-18, respectively. The uncertainty in these values is based on the uncertainty in the measured density. The deviation of the calculated values from those obtained from the experiment is ∼15%, somewhat larger than the mutual error bars. This deviation is probably caused by the uncertainty in the parameterization for the tortuosity, τ, in Equation (9), which is used to calculate the firn diffusivity (Equation (4)). If we assume that the uncertainties in the other parameters are negligible compared to the uncertainty in the tortuosity, we can use the measured values for the firn diffusivities to estimate the tortuosity of the firn in our experiment. Rewriting Equation (4) gives the following expression for the tortuosity:

Using the values for diffusivity given in Equations (16) and (17), together with a temperature of −19°C and a density of 415 kg m−3, we obtain values of 1.16 ± 0.08 and 1.20 ± 0.08 for the tortuosity (for deuterium and oxygen-18, respectively), where the uncertainty in these values is based on the uncertainty in the density of the firn. Using the same value for the density in the parameterization for the tortuosity (Equation (9)) we obtain a value of 1.36 ± 0.04. This value is relatively close to those obtained with Equation (18), which is equivalent to the fact that our calculated firn diffusivities based on Equations (4– 9) are close to the measured firn diffusivities. Given that the snow used in our experiment was produced in a cold laboratory, and may therefore have a different structure to real snow, we can conclude that even in this case the parameterization of the tortuosity by Equation (9) works reasonably well.
Taking the ratio of the diffusivities of the different isotopes, we eliminate the relatively high uncertainties in the density and the tortuosity. Using Equation (13) and the values given in Equations (16) and (17) we obtain:

This value is directly comparable with the expression in Equation (15) based on the literature values of fractionation, αi and Ωai (Reference Merlivat and NiefMerlivat and Nief, 1967; Reference MajoubeMajoube, 1970; Reference MerlivatMerlivat, 1978). For a constant temperature of −19°C throughout the experiment, the literature value for the ratio of diffusivities is 0.873. This agrees within the measurement uncertainty with our findings. Our results can also, in principle, be used to check the temperature dependence of Equation (15), which is of crucial importance for the differential-diffusion method, in which the firn temperature is derived from the difference in diffusion between the different isotopes. Figure 6 depicts the relation between the firn diffusivity ratio and the firn temperature calculated with Equation (15). Clearly, the determination of the ratio of the diffusivities needs to be much more precise than our present result to be able to retrieve the temperature information from the ratio, or, the other way around, to check the temperature outcome of the differential-diffusion method in an independent way.
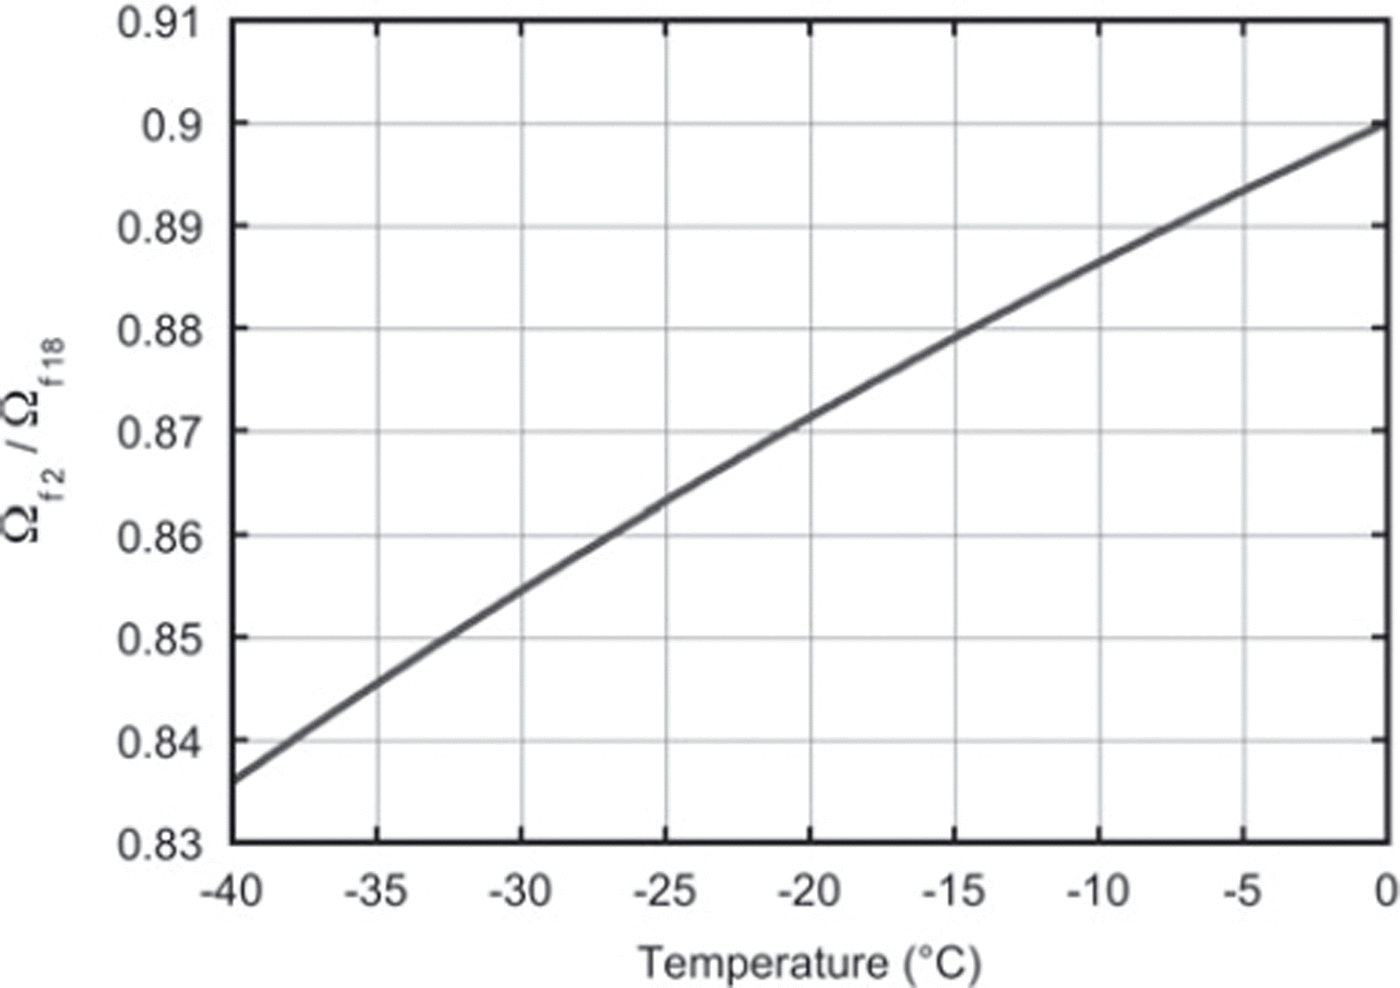
Fig. 6. The ratio of the firn diffusivities as a function of firn temperature only. These values are calculated using Equation (15).
Error Analysis
To achieve results precise enough to test Equation (15), the basis for the differential-diffusion method, it is necessary to minimize the uncertainty in the sampling and measurement procedure. To investigate the propagation of uncertainties we simulated the experiment by creating synthetic data. In the simulation an initial profile similar to that of the second experiment is created and diffused using a finite-difference numerical scheme. In this scheme the isotope ratio, δ, at every position, j, for the next time-step, k + 1, is given as:
The time and spatial steps, dt and dz, are set to 2 hours and 0.5 mm, respectively. At both ends of the grid (j = 0 and j = N) we need to impose a boundary condition. As we have a closed system, the appropriate boundary condition is to assume no flux at these points. This implies that the gradient of the isotope ratio is zero at the boundaries, and the isotope ratio at these points is given as:
The diffused profile is sampled by taking the average values for 1 cm intervals. Using this synthetic dataset the diffusion lengths are calculated in exactly the same way as was done for the measurement data. By adding uncertainties at different steps in the creation of the synthetic data, we investigate how the fit is influenced by the different sources of uncertainty. The first source of uncertainty investigated is the position of the boundaries between the layers. In the second experiment these boundaries were not completely fixed during the construction of the snow stack. Therefore, several simulation runs were done in which the boundaries were varied around their average position. The variation was created by adding random errors (drawn from a Gaussian distribution) to the initial position. In a similar way the errors introduced in sampling the snow stack were investigated. In the sampling we distinguish two uncertainties: (1) an uncertainty in the position of the sampling and (2) an uncertainty in the width of the sampling. The final source of uncertainty considered is the error in the isotopic measurement of the samples. Here, again, an error drawn from a Gaussian distribution is added.
The results of these simulations are summarized in Table 2. The attributed uncertainty is given in the second column of the table, as the one standard deviation value of the Gaussian distribution. The chosen values for these uncertainties are our estimates for the real uncertainties in the second experiment. The bottom row of the table gives the results of simulations when all uncertainties are included. The total uncertainty of these simulated data is ∼30% higher than the uncertainty we found in our actual experiments, indicating that our uncertainty estimates have been on the safe side. The error budget shows that the uncertainty in the final outcome of the experiment is mainly determined by the uncertainty in the sampling position. It should be noted, however, that in the creation of synthetic data it is assumed that the errors in the sampling positions are independent of each other. In the actual experiment it is more likely that neighbouring samples have similar errors, so this assumption probably leads to an overestimation of the uncertainty. The uncertainty in the isotopic measurements has negligible influence on the overall uncertainty. In the case where errors are only attributed to the deuterium measurements, one would expect to have no uncertainty in the determination of the oxygen-18 diffusion length. The uncertainty we observe here is caused by the 1 cm width of the samples taken. This averaging over 1 cm leads to an uncertainty which is reflected in the diffusion length. The precision could therefore be improved by taking smaller sample sizes, provided the same precision in the isotopic measurements is achieved for the smaller samples.
Table 2. The effect of sampling and measurement errors for the calculated diffusion lengths and ratio of diffusivities. The upper value in each pair is calculated without optimizing the boundary positions in the fit procedure. The lower value is obtained from a fit after optimizing the boundary positions in the same way as was done for the measured data. The theoretical values are given in the first row
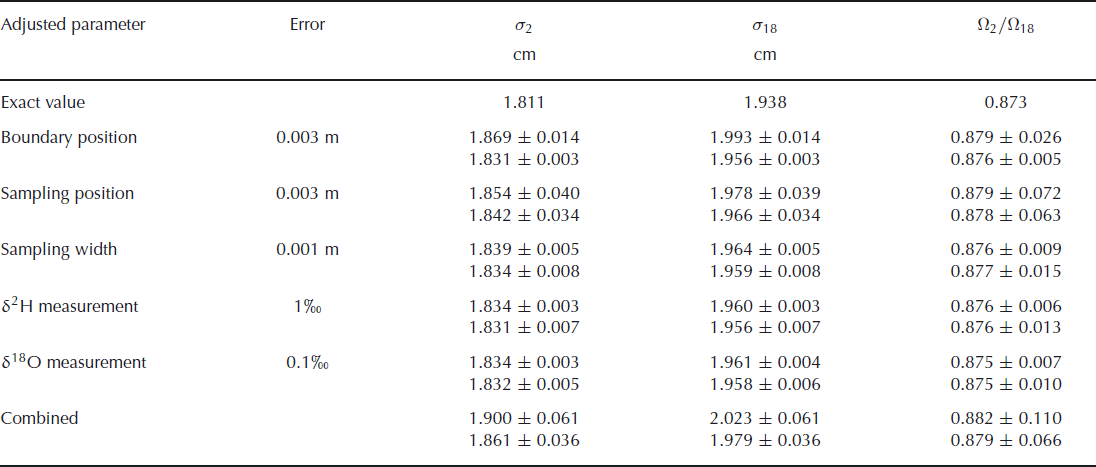
These results also show that optimizing the boundary positions in the fit procedure leads to a large improvement in the fit and therefore to a much lower uncertainty. This is, of course, only true in cases where an uncertainty is added to the boundary positions. If the positions are exactly known, the optimization of the boundary only adds uncertainty to the final result.
We also note that the values for the diffusion lengths are slightly larger than the exact value. This is not caused by the introduction of uncertainty in the parameters, but by the sampling of the synthetic data. This sampling is done by taking the average over 1 cm sections, which leads to a more smoothed profile. As a consequence, the diffusion lengths increase and also the ratio of diffusivities increases slightly. When the sampling is done at a higher resolution, or if the diffusion has progressed further, the deviation from the true value decreases.
A higher precision in the determination of the diffusion lengths and, therefore, of the ratio of diffusivities can be obtained from a more diffused profile in which the boundaries between the layers are exactly known. The error in the determination of the diffusion length will not increase as long as the amplitudes are well above the measurement uncertainty. A larger diffusion length will thus lead to a lower relative error. This also means that the relative error in the ratio of diffusivities decreases and since the actual value for the ratio will not change, the uncertainty in the ratio will become lower. However, the fit used to optimize the boundary positions in the initial profile will become worse when the amplitude of the diffused profile reduces. Therefore, when the boundary positions are not exactly known, a more diffused profile will lead to a larger uncertainty in the diffusion lengths. This was confirmed by simulation runs with a longer diffusion period. For a 6 month longer diffusion time, we obtain an uncertainty in the firn diffusivity ratio of ±0.055 (or ±0.073 when the boundary position is not optimized). However, if the simulation is extended for a further 6 months, the uncertainty increases again to ±0.068. In this situation the extra fit used to determine the boundary positions actually increases the uncertainty, as we obtain a value of ±0.059 when this extra fit is not performed. Finally, choosing thicker layers will also decrease the uncertainties as the relative error in the sampling position decreases, provided the diffusion length is increased by the same factor.
Summary and Conclusions
We have measured the diffusion of the stable water isotopes in snow in two laboratory experiments. In the first experiment the different layers of snow were not in proper contact with each other, causing a large difference in the diffusion rate between the thicker and thinner layers. In the second experiment, contact between the layers was ensured and agreement with theory was much improved. The parameterizations used for the diffusivities in air, the fractionation factors and the tortuosity (Equations (6), (8) and (9), respectively) are in reasonable agreement with our results. The deviation between the tortuosity calculated from the firn diffusivities (using Equation (18)) and the value obtained from the parameterization (Equation (9)) using measured density values is at most 13%. The second experiment also showed how such a set-up can be used to measure differential-diffusion effects. The differential-diffusion method, developed by Reference Johnsen, Clausen, Cuffey, Hoffmann, Schwander, Creyts and HondohJohnsen and others (2000), relies on the fact that the ice to vapour equilibrium fractionation factors are different for different isotopes. The ratio of these fractionation factors is a function of the temperature of the snow only. It should be noted that in differential-diffusion studies it is common to use the squared difference of the individual diffusion lengths as a proxy for temperature. However, this parameter depends on all other factors in the diffusivity, such as density and tortuosity (Equation (4)). Using the diffusivity ratio avoids the use of these factors, so this technique is potentially more suitable to recover palaeotemperatures from ice cores. This technique must be investigated further, however. The degree to which the crucial step in our technique, namely using the time average of the diffusivity (going from Equation (11) to Equation (12)) introduces (systematic) errors when applied to ice cores needs to be studied, since time-dependent temperature gradients in the firn exist. Also kinetic fractionation effects, due to ventilation of the firn, for example, should be considered. We intend to investigate this subject, both experimentally and through numerical simulations.
With the experimental method presented here it is possible to measure the relation between firn temperature and the ratio of firn diffusivities (Equation (15)), provided the uncertainty in the experimental outcome is reduced. A set-up in which the layers are twice as thick as those in the experiment described here will reduce the uncertainty in the ratio of diffusivities to ±0.02, provided the diffusion length is also increased by either allowing a longer diffusion time or a higher temperature. If, additionally, the construction and sampling of the snow stack is improved, the uncertainty in the final result can be further reduced. Such an experiment should be carried out on several snow blocks simultaneously, all stored at the same temperature, to improve the statistics of the experiment, and with several snow blocks stored at different temperatures. Such a set-up would be an independent check of the laboratory fractionation measurements by Reference Merlivat and NiefMerlivat and Nief (1967) and Reference MajoubeMajoube (1970), in a context better resembling the situation in firn.
Acknowledgements
This project was mainly funded by the Netherlands Organisation for Scientific Research (NWO) through a grant of the Netherlands Antarctic Programme. In the final stage of the work, L.G. van der Wel was funded by the European Research Council project, MATRICs.


