I. Introduction
For decades the European Union (EU) and its predecessors have had a Common Market Organization (CMO) for wine that has heavily regulated or influenced the quantity, quality, and price of wine grapes and wine produced in the EU (Gaeta and Corsinovi, Reference Gaeta and Corsinovi2014; Meloni and Swinnen, Reference Meloni and Swinnen2013; Spahni, Reference Spahni1988). Following a review in 2006 (European Commission, 2006), the policy went through a major reform in 2008, which included a 3-year grubbing-up program that paid growers to remove vines. Meanwhile, financial support for generic promotion of EU wines has been expanding considerably and is budgeted for further expansion during 2014–2018.
The Organization for Economic Cooperation and Development (OECD) has tracked support for farm industries in its member countries since 1986. In the case of the EU (but not other member countries) that has included support for the wine industry. However, using the OECD's generic methodology means that various support measures are not included in its producer support estimates (PSEs). It also means support is shown only for the EU as a whole, not for individual EU member countries. The omitted measures include subsidies for distillation of low-quality wine and any domestic price-raising effect of tariffs on imports of non-EU wines. The industry has also benefitted, along with other farm industries, from non-product-specific support to the rural sector of EU member countries. That support is treated as a generic rural benefit rather than supporting winegrowers or producers of any other particular agricultural product.
This article is not meant as a criticism of that generic OECD methodology. Rather, its purpose is to provide a set of more complete estimates of government support to EU wine producers because many other countries' wine producers are struggling and would like to compare the types and extent of EU support with that from their own government.
The focus is on the period 2007 to 2012, after which the OECD changed its generic methodology. We show how much the level and types of support have altered over that period and how unevenly they are spread across EU member countries. The article begins by describing the data sources. Results presented in tables and figures are then discussed, and the final section draws out implications and concludes.
II. Data
The OECD's PSE database has altered its methodology several times since it was first released more than two decades ago. The latest version, uploaded in July 2015 (OECD, 2015), not only has updated numbers to 2014 but also has altered past numbers back to 1986. The latest estimates are summarized in Table 1. They suggest EU wine producers benefitted from transfers from consumers and taxpayers to the extent of about 800 million euros per year in the latter 1980s and the 1990s, but that this fell to less than 500 million euros per year in the past 10 years. Most of that was market price support prior to the policy reforms that began in the early 1990s, but these estimates suggest that has now disappeared, with producer returns being raised by just 0.3% during 2007–2013 and zero in 2014 (see the nominal rate of protection [NRP] row in Table 1), down from approximately 7% in the latter 1980s and 1990s. This recent estimate, however, is not consistent with the fact that tariffs still apply on the EU's wine imports from all countries without a free-trade or association agreement with the EU-28. Those tariffs would have some positive impact on the domestic price of wine in EU countries, but the OECD chooses not to try to measure that because of the heterogeneous nature of wines.
Table 1 OECD Estimates of Direct Transfersa to Wine Producers and Their Nominal Rate of Direct Producer Protection,b European Union (EU-28), 1986–2014 (Annual Averages)

Notes: a The Organization for Economic Cooperation and Development's (OECD) single commodity transfers do not include such supports as subsidies to distill unwanted wine and to promote wine generically, grubbing-up premiums, price support from import tariffs, or any proportion of non-product-specific assistance to the agricultural sector and rural areas. b Based on OECD's estimate of nominal protection coefficient (NPC), where NRP = 100(NPC – 1). The NRP expresses the estimated direct transfer as a percentage of the gross value of wine production (net of assistance).
Source: OECD (2015).
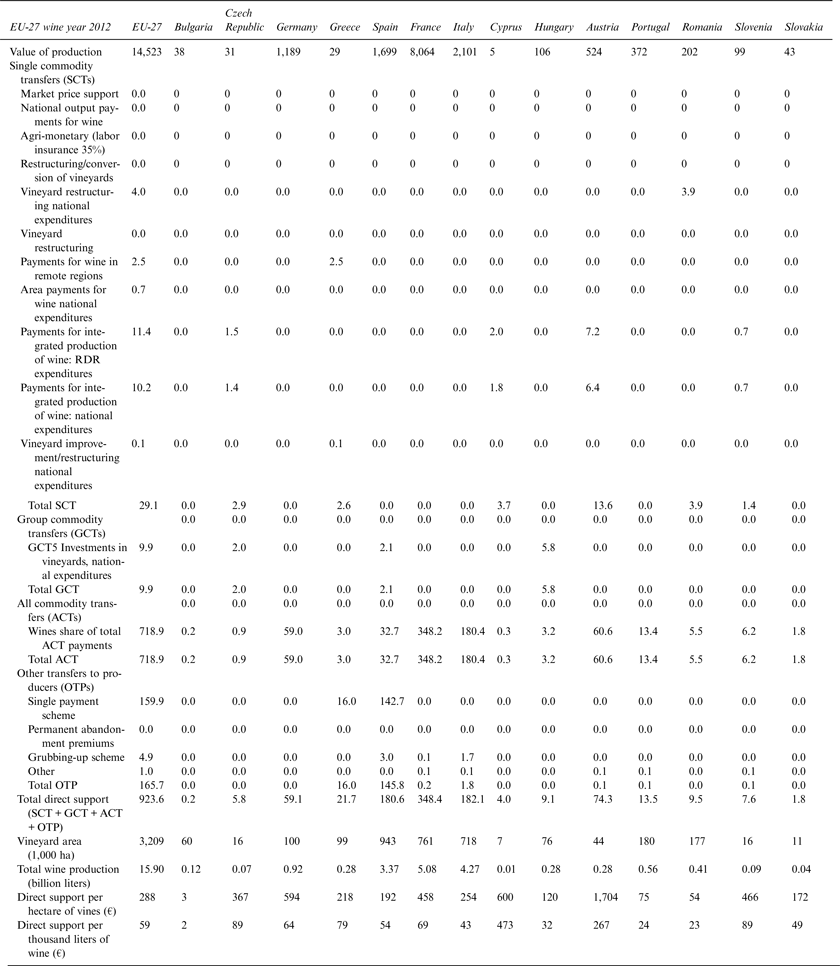
It is possible to amend the OECD's estimates using the data contained in its database plus data available from Eurostat. In the Appendix (Table A1), we focus on aggregated EU-27 wine production from 2007 to 2012 and domestic support given directly to the industry's producers. That table is built up following the OECD's PSE structure prior to its latest methodology revision, which categorizes payments as either “single commodity transfers” or group commodity transfers. To that we have added a pro rata fraction of “all commodity transfers,” based on wine's share of agriculture's gross value of production,Footnote 1 and “other transfers to producers” that are specific to grape and wine production. At the top of that table, the value of production (at the farm gate, inclusive of transfers) is taken directly from the PSE tables and originates from the Eurostat Dissemination Database, formerly New Cronos database, the official EU data portal. The single farm payment scheme data for wine are from the European Commission (2013) because the OECD no longer itemizes those payments by commodity.Footnote 2
The Appendix (Table A2) includes additional payments not specifically linked to the wine industry and specified by the OECD as “general services support estimates” (GSSEs), again for the EU-27 as a whole and for the period 2007 to 2012. These include some general payments from which the wine industry could benefit, so these are calculated as a pro rata fraction based on wine's share of agriculture's gross value of production within the EU-27 each year.
It might be argued that basing shares on gross production value in these two tables exaggerates the shares attributable to the wine industry because wine's share of total agricultural production exceeds considerably its share of total utilized agricultural land (4.2% compared with 1.8% in 2012, for example). For that reason we also calculated how much lower the total support would be had we used the land share instead of the production value share to calculate that nondirect assistance. It turns out to be about one-ninth lower (see Table 2 notes).
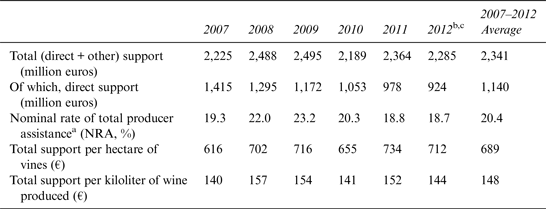
Table 2 Direct Plus Other Support to Wine Producers and Their Nominal Rate of Assistance,a European Union (EU-27), 2007–2012

Notes: a NRA is total support as a percentage of gross value of wine production (net of assistance). The NRA is broader than the Organization for Economic Cooperation and Development's nominal rate of direct protection in Table 1, the latter referring just to price-support measures, whereas the NRA also includes the other transfers to producers that may not alter the price they receive for their output but are part of the total support shown in row 1 of this table (see Anderson et al., Reference Anderson, Kurzweil, Martin, Sandri and Valenzuela2008). b An assumption in Tables A2 and A4 (see Appendix) is that wine's share of some general services supports is proportional to the gross value of total agricultural production. If instead it is proportional to the share of vines in the total area of land used for agriculture, the numbers in the 2012 column other than for direct support would be one-tenth lower. c The tariffs in EU wine imports had a weighted average in 2011 of 5.8% when expressed in ad valorem terms (estimated from the latest Global Trade Analysis Project Version 8 database; see http://www.gtap.org). Had they raised the domestic producer price in 2012 by a full 5.8% (an upper bound; or by just 1% as a possible lower bound), the market price support in 2012 would have been not zero but 788 million euros (or 136 million euros), thereby raising total producer support by the same amount. The 2012 NRA would then be not 18.7% but 26.4% (or 20.0%), the support per hectare of vines would rise from 712 to 946 (or 754) euros, and support per kiloliter of wine produced would rise from 144 to 191 (or 152) euros.
Source: Authors' calculations based on Tables A1 and A2 (see Appendix).
Tables A3 and A4 in the Appendix are structured the same as Tables A1 and A2, but they decompose the EU-27 data into the various receiving member countries, but just for 2012 in the interests of space. The GSSE payments in the OECD database that are not commodity specific are allocated in Table A4 to each member country using (1) official (but not publicly available) EU data taken from the Clearance Audit Trail System database that includes both EU-funded and national payments by member states and (2) wine CMO financial execution data on the national support program (European Commission, 2013).
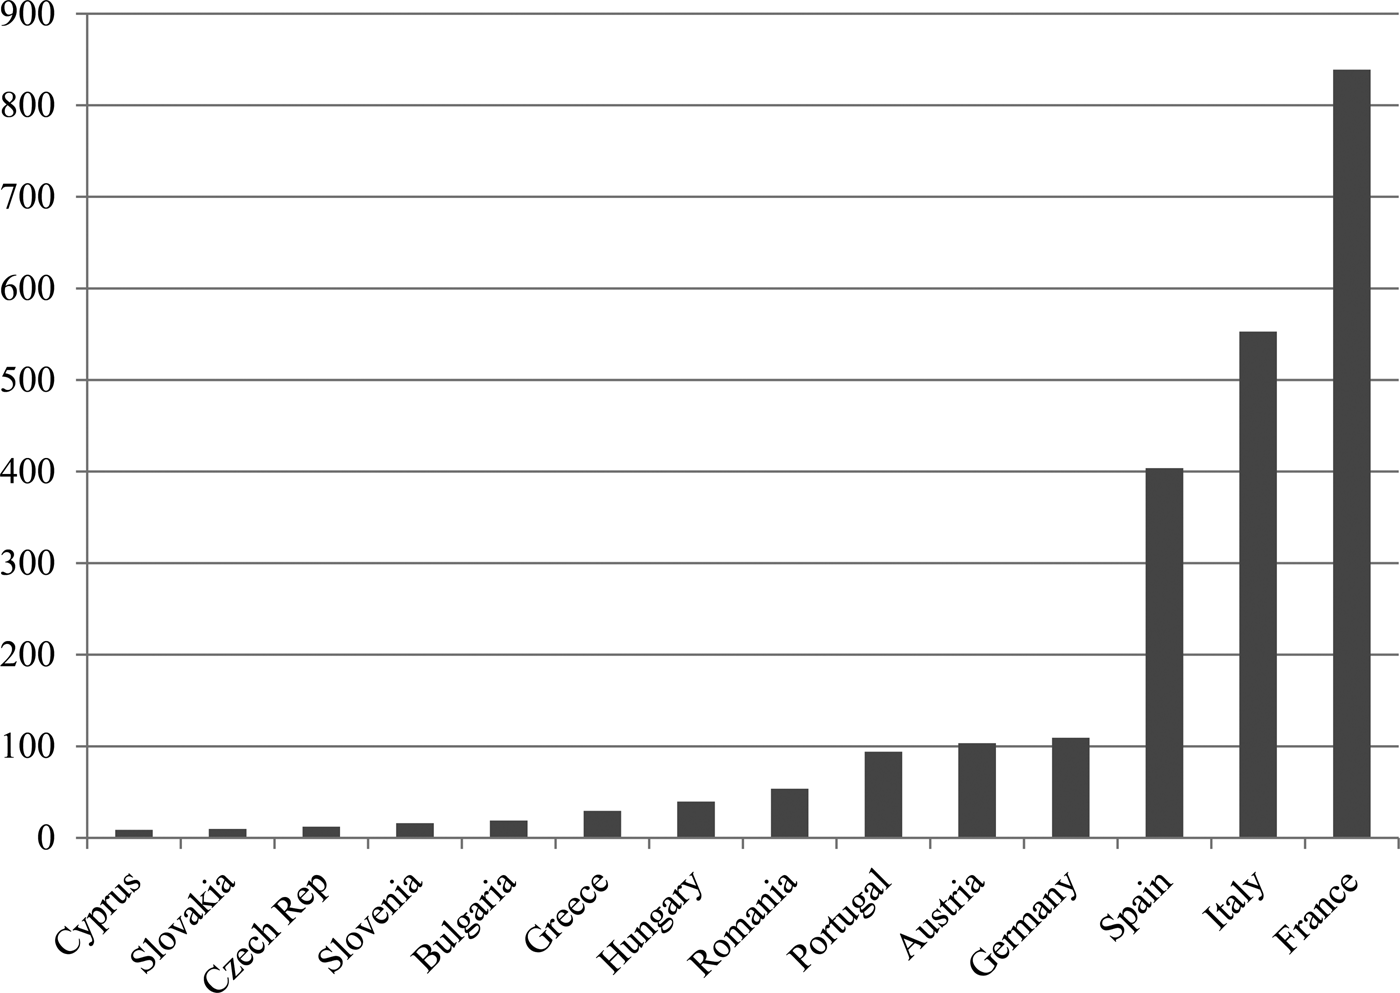
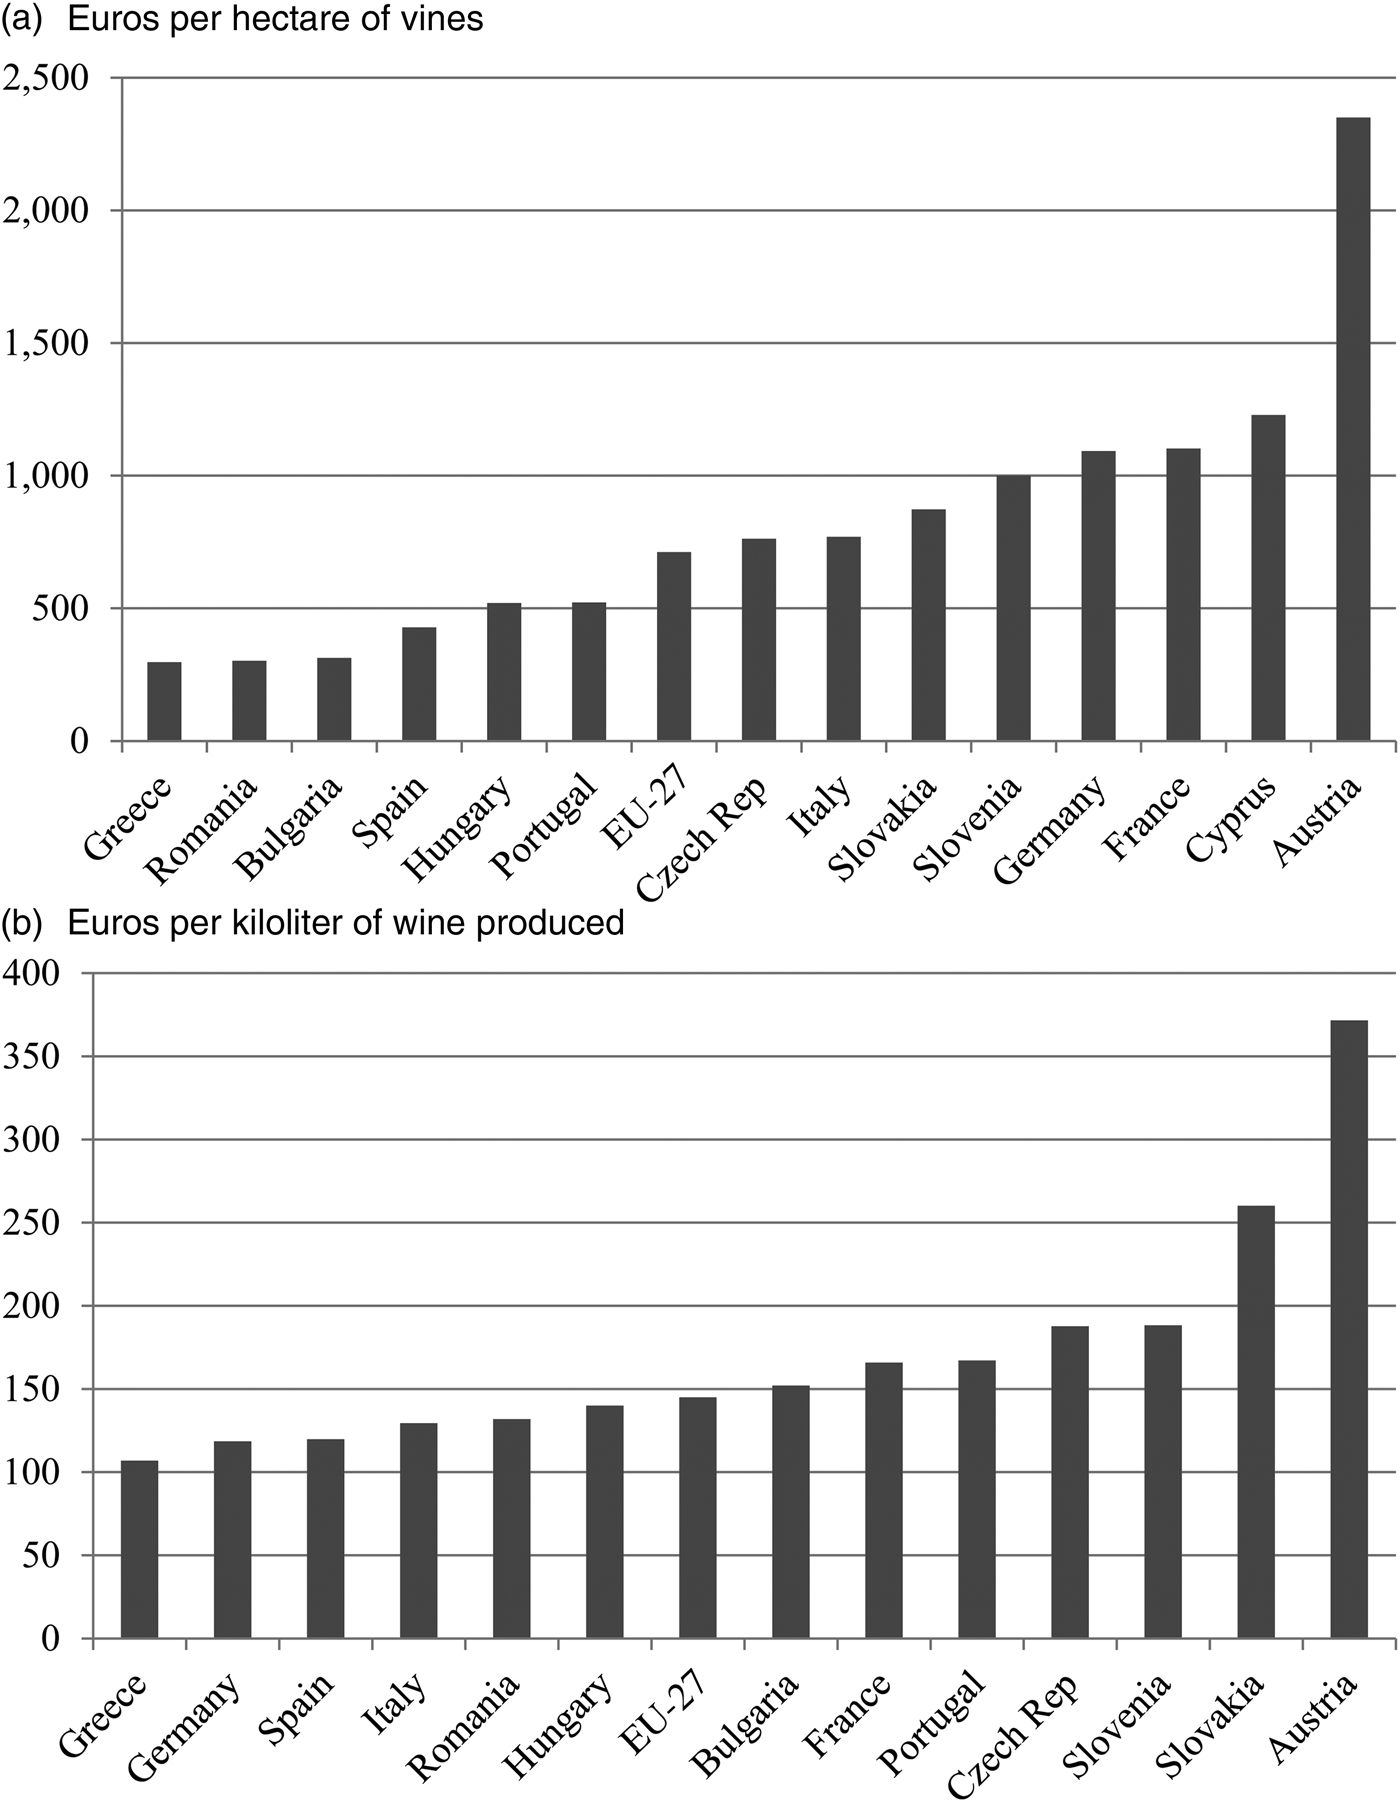
In all tables, support payments are expressed in millions of euros. The vine bearing area and wine production volumes are shown as well, allowing the calculation of support per hectare of vines and per liter of wine produced. Those summary estimates are depicted in Figures 1 and 2 just for 2012, and the key forms of support since 2007 are summarized in Figure 3.

Figure 1 Total Support to Wine Producers, Individual European Union Member Countries in Million Euros, 2012

Figure 2 Total Support to Wine Producers Per Hectare and Per Kiloliter of Wine, Individual European Union Member Countries, 2012

Figure 3 Shares of European Union Wine Producer Supports by Measure, 2007–2012 (%)
Table 2 aggregates the data at the bottom of Tables A1 and A2 for the years 2007 to 2012. These can now be compared with the OECD's estimates of transfers to producers, as summarized in Table 1. In Table 2 we report also what our estimates imply in terms of a nominal rate of assistance (NRA). The NRA is broader than the OECD's NRP in Table 1, the latter referring just to price-support measures, whereas the NRA also includes the other identified transfers to producers that may not alter the price they receive for their output (see Anderson et al., Reference Anderson, Kurzweil, Martin, Sandri and Valenzuela2008).
III. Results
The comparison of Tables 1 and 2 suggests that the OECD estimates, at least since 2007, understate considerably the full extent of government support to the EU wine industry. In contrast to the OECD's estimate of an average transfer of less than 500 million euros per year during 2007–2012, our Table 2 suggests the number is more than 2,300 million euros per year—and it has not been declining (see also Figure 3a). This implies that gross returns are about one-fifth above what they would be without those supports (an average NRA for the 2007–2012 period of 20.4%). That annual assistance amounts to approximately 700 euros per hectare of vines, or 0.15 euros per liter of wine produced in the EU as measured at the winery gate (Table 2 and Figure 2).
Even these new estimates probably understate the transfers to producers. One reason the numbers in Table 2 are likely to be understated is because the effect of tariffs on imports of non-EU wine in raising producer prices is not included. An upper bound on the extent to which tariffs raised the domestic producer price in 2012 is 5.8%, which is the import-weighted average tariff that year when converted to ad valorem terms. A lower bound might be one-sixth of that (bearing in mind that the EU accounts for a large share of the global wine market and thus is hardly a price taker). As reported in Table 2 notes, the 2012 NRA would then be not 18.7% but 26.4% (or 20.0%), the estimated support per hectare of vines would rise from 712 to 946 (or 754) euros, and the support per kiloliter of wine produced would rise from 144 to 191 (or 152) euros.
However, the numbers in Table 2 assume wine's shares of general services supports are proportional to the gross value of total agricultural production. Had we assumed they are proportional to the share of vines in the total area of land used for agriculture, the numbers in the 2012 column of that table, apart from direct support, would be one-tenth lower. This may more or less than offset the effect of omitting tariff protection.
It might also be argued that payments for grubbing up vines should be omitted because they are unrelated to current production and are reducing the future EU (and hence global) supply of wine. However, because this article is trying to estimate not price distortions but financial support to the industry, their inclusion is appropriate.
In addition to an overview estimate of the size of payments given to the wine sector in the EU-27 as a whole, there is also an interest in the allocation of payments between EU member countries. In the Appendix (Tables A3 and A4), estimates of the individual payments by country are given for the year 2012 for all of the EU-27's wine-producing countries. These are summarized in Figures 1 and 2. Of course, France, Italy, and Spain get the lion's share of total payments, being by far the largest wine producers (Figure 1). However, per hectare support ranges from 300 euros in Greece to 2,350 euros in Austria (Figure 2a), and support per liter of wine produced ranges from 0.11 euros in Greece to 0.37 euros in Austria (Figure 2b).
By far the largest—and still growing—category of support is for marketing and generic promotion of EU wines. It accounts for about two-fifths of the estimated total in aggregate (Figure 3a). Direct price supports were most important in 2007, but since then they have been eclipsed by other direct supports and support for marketing and promotion. Although grubbing-up support was nontrivial during the 2008–2010 reform period, those payments are no longer being made. In 2012, direct supports were relatively more important to the Czech Republic, Germany, Slovenia, and Spain, whereas marketing and promotion supports were relatively more important to Bulgaria and Romania (Figure 3b).
IV. Implications and Conclusion
According to our new estimates, government support for European wine producers continued unabated between 2007 and 2012, albeit in changing forms. The support per hectare of vineyard in 2011 and 2012 exceeded 700 euros in the EU in aggregate and more than 1,000 euros in Austria, Cyprus, France, and Germany. That almost certainly exceeds the support provided by governments in any other major wine-producing country. It is equivalent to an average of 0.15 euros per liter of wine produced and more than 0.25 euros in Cyprus (at 1.02 euros, not shown in Figure 2b), Austria, and Slovakia.
Generic promotion accounted for a growing share of total EU support, amounting in 2012 to 0.009 euros per liter of wine produced. By contrast, Australia's expenditure per liter on generic promotion that year was half that amount (Anderson and Aryal, Reference Anderson and Aryal2015). The EU provided a total of 522 million euros for wine promotion during 2008/2009 to 2012/2013 (Table A2), and, despite the uncovering of many misappropriations, that expenditure is to be more than doubled to 1,156 million euros for the period 2013/2014 to 2017/2018 (European Court of Auditors, 2014). Given that this promotion item (an average annual 231 million euros) is but one-tenth of the total support to the EU industry in 2012, it is little wonder that other wine-producing countries worry about their ability to compete in international markets against supported EU producers. True, vineyard planting restrictions may have reduced the extent to which the previously mentioned financial supports add to EU wine output and exports (Deconinck and Swinnen, Reference Deconinck and Swinnen2015), but they are being relaxed. The empirical impact of past area restrictions and their recent relaxation is a topic worthy of further research.
Appendix
Table A1 Direct Supports for Wine Producers, European Union (EU-27), 2007–2012 (Million Euros)

Table A2 Other Supports for Wine Producers, European Union (EU-27), 2007–2012 (Million Euros)

Table A3 Direct Supports for Wine Producers, European Union (EU-27), by Country, 2012 (Million Euros)

Table A4 Other Supports for Wine Producers, European Union 27 (EU-27), by Country, 2012 (Million Euros)


