Child malnutrition is a public health problem in developing countries. Globally, it is estimated that approximately 5·9 million children under 5 years of age die each year( 1 , Reference You, Hug and Ejdemyr 2 ), mainly due to prematurity (15·4 % of deaths) and pneumonia (14·9 % of deaths)( Reference Bhutta and Black 3 , Reference Liu, Shefali and Hogan 4 ); it is estimated that malnutrition contributes up to 45 % in all-cause mortality in low-income and middle-income countries( Reference Black, Victora and Walker 5 ). In Peru, chronic malnutrition in children under 5 years old has dropped significantly in the last decade, from a national average of 23·8 % in 2009 to 14·6 % in 2014, by WHO standards( 6 , 7 ). However, significant levels of malnutrition remain, especially in rural areas of the Andes and the jungle, where child chronic malnutrition is 28·8 %( 6 , 7 ).
Stunting is now identified as a major global health priority and the focus of several high-profile initiatives like Scaling Up Nutrition, the Zero Hunger Challenge and the Nutrition for Growth Summit( Reference Onis and Branca 8 ). To reduce childhood malnutrition rates, the Peruvian government, like other countries in the region, has implemented multiple supplementary food programmes. However, meaningful improvement in nutrition not only requires more energy, but also adequate animal protein intake and vital micronutrients such as Fe, Zn, vitamin B12 and folate( Reference de Pee and Bloem 9 ). Protein and micronutrients are important for the growth and development of the body, to maintain and repair tissues, and in the production of enzymes and hormones necessary for many physiological processes. The standard diet of food supplement programmes includes between 12 and 15 % protein, with 20 % of the protein content of animal origin( Reference Michaelsen, Hoppe and Roos 10 ); the acceptable range of protein intake for children aged 1–3 years is between 5 and 20 % of total energy( 11 ).
Seafood is an important part of a healthy diet; the American Heart Association recommends two servings of fatty fish weekly( Reference Gidding, Dennison and Birch 12 ). Examples of fatty fish include salmon, herring, mackerel, anchovy and sardine( Reference Parian and Mullin 13 ). Similarly, the Peruvian National Institute of Health recommends consuming two to three weekly portions of fish for a healthy diet( 14 ). The Codex Alimentarius allows the use of fish protein in food for young children. In the 1970s and 1980s several efforts were made to supplement the food of children with concentrated fish or fish powder; however, due to the strong taste, these supplements were unsuccessful. Research over the past 10 years has demonstrated the nutritional benefits of including peptides and nucleotides in human diets. Isoelectric solubilization/precipitation allows efficient recovery of fish proteins and oil which retain the functionality and nutritional value of food products( Reference Gehring, Gigliotti and Moritz 15 ). Fish protein isolate (FPi) is easily digestible and has a high biological value; it contains all ten essential amino acids. These purified proteins and peptides are theoretically safe for use in paediatrics; they have less than the permissible amount of histamine and heavy metals; however, there remains a need to demonstrate the safety of this diet in a systematic way in a paediatric population.
The overall goal of our programme is to increase the amount of animal protein in the diet of young Peruvian children. To accomplish this goal, we proposed to use an FPi with high biological value and low cost. Before recommending the use of this fish protein in the national nutritional programmes, we needed to determine the acceptability and safety of the fish protein with proper growth outcomes. Therefore, we conducted a community-based cluster-randomized trial in Lima. The primary aim of the study was to determine the effect of the FPi, administered over 6 months, on the growth of children aged 6–36 months in Lima, measured by Z-scores of height-for-age (HAZ) and weight-for-height (WHZ), in comparison to the standard meal without FPi. The secondary aims were to determine the acceptability, defined as ≥70 % of daily consumption measured by weighing the servings before and after consumption, and safety of FPi consumption, determined by daily evaluation of the children.
Methods
Design and sample
This was a Phase II, cluster-randomized, community-based, single-blinded, controlled clinical trial. We enrolled children, between 6 and 36 months of age, who participated regularly (>4 times/week) in either day care centres or community nutritional centres in northern Lima and who received at least 2 meals/d in the centre. All nine centres were from peri-urban communities with similar socio-economic characteristics. The centres were randomized to the study intervention based on the size of the centre (number of children) and similar characteristics (type of centre). Randomization was made by an external statistician. The study team submitted a list of centres with the number of children in each and the type of centre to an external statistician, who randomly assigned the treatment intervention.
We excluded children with underlying conditions that affected their growth (severe chronic diseases), with a family history of severe food allergies or fish allergy, children with no chance of completing the 6-month follow-up study (children who are temporarily in the community nutrition centre and may move to another district or travel to other provinces), and children whose parents did not agree to participate.
Assuming the mean HAZ in children in Lima between 6 and 36 months is −0·5 with sd of 1·0, it was calculated that 210 children in each group would be needed to detect a difference of 0·30 in HAZ on a two-tailed test with a type I (α) error of 0·05 and power of 0·80, assuming that 15 % are lost to follow-up at 6 months. Thus, the calculated sample size was 420 children in total.
All children in the community day care and community nutritional centres who met the inclusion/exclusion criteria were invited to participate. Study nurses conducted the first group meetings with parents to explain the study, in coordination with the manager of each centre. Subsequently, they met personally with each parent to obtain informed consent from both parents.
Dietary intake
Based on the nutritional requirements for children aged 6–36 months, the study nutritionist in coordination with the nutritionist from the community nutritional centres of INABIF (Peruvian National Family Program) reviewed and designed seventy-three menus for all centres with age-appropriate nutrient composition (proteins, carbohydrates and fats) and amounts. The study nutritionist coordinator prepared a menu list for the following week and submitted it to each of the centres to purchase the food supplies. The menus included the amounts in grams of each food component based on the number of children in each centre. Every day, children from all centres received the same menu, with the same nutritional content. Cooking methods and storage facilities (refrigerators) were similar in all centres. All meals were given during the lunch period. A nutritionist in each centre supervised the daily preparation and distribution of all meals based on the centralized menu. All centres received the same total amount of energy per meal and the same percentage of protein (between 12 and 15 %). Fieldworkers present in each centre were responsible for administering and recording daily food consumption for each child, measured by weighting the serving before and after consumption.
In the intervention group, 50 % of the animal protein was replaced with FPi instead of the standard protein in the lunch meal, 5 times/week, for 6 months. The control group received the same standard diet with animal protein from beef, chicken, pork, beef liver or egg, without the fish protein.
The FPi, produced by Bluewave Marine Ingredients from sardines, is a protein isolate consisting of fish peptides from fresh raw material purified by membranes. The peptides contain a mixture of mono-, di- and tripeptides. The product is a light brown powder with a slight odour of proteins and peptides, containing >80 % proteins. Before use, the product was subjected to biochemical and microbiological analysis; histamine and heavy metal levels were also determined for each lot.
The site staff were not blinded to the intervention; however, the investigators in charge of nutritional assessment, weight and height and monthly check-ups and the biostatistician were blinded to the type of protein received by each child.
Data collection
Demographic and epidemiological data were collected for each child, including prenatal history, birth and postnatal medical history, as well as risk factors for malnutrition. The children were assessed by a paediatrician on admission and each month until the end of the study at 6-month follow-up. During the medical visits, as well as the weekly evaluation by the study nurse, data on recent infections and on signs and symptoms that could suggest a possible protein allergy (eczema, rhinitis, wheezing) were collected. At the beginning and end of the study, a blood sample (finger stick) was taken to determine Hb level using HemoCue, and a stool examination for ova and parasites was performed at baseline. If the child was found to have Fe-deficiency anaemia at baseline, ferrous sulfate was given and monitored throughout the study, based on the Peruvian national guidelines for the management of anaemia in young children. No additional tests were performed to confirm Fe deficiency.
Effect on child growth
To determine the effect of purified fish protein on growth, HAZ and WHZ based on the 2006 WHO child growth charts( 16 ) were determined during the 6 months of the intervention. Children were weighed naked every month using a calibrated infant scale. Length was determined using a measuring board in a supine position for children aged <2 years and standing up for children aged 2–3 years. The growth measurements were performed by a trained and standardized nutritionist in each centre, part of our research team.
Acceptability
To determine the acceptability of the intervention, the proportion of food consumed from that offered was determined, and the percentage of children who consumed 70 % or more of the offering was determined in accordance with current national guidelines (CENAN and ISO standards). Each serving was weighed before and after consumption.
Safety
To determine the tolerability and safety of the FPi, participants were observed for any health indications of a direct health risk (e.g. nausea, vomiting, abdominal pain, skin allergy, rhinitis, bronchospasm, etc.). Adverse events were monitored daily during the administration of food and monthly during check-ups. Children had a complete history and physical examination monthly, performed by a paediatrician.
Statistical analysis
We performed an intention-to-treat analysis. To analyse the main outcomes, we used anthropometric measures (HAZ and WHZ), amount consumed and acceptability as dependent variables. Linear mixed models were applied where candidate factors were use of FPi, follow-up time from admission and the interaction between the two. We added random terms of centre and children in the centre (which are the terms reflecting the cluster design). For models with normally distributed error (all dependent variables except acceptability), the CI and the significance level of the fixed and random terms were calculated using Monte Carlo simulation with Markov chain and credible intervals for highest posterior probability density.
Ethics review
The protocol was reviewed and approved by the Institutional Ethics Committee of Cayetano Heredia University (UPCH) and Cayetano Heredia National Hospital, the Ministry of Health (MOH), the Executive Director of the National Institute of Integral Family Welfare (INABIF) of the Ministry of Women (MINDES) and the Peruvian National Institute of Health (INS). Authorization of parents for their children’s participation in the study was given by signing the informed consent.
Results
Four centres with 220 children were randomized to receive the intervention diet with FPi, while five centres, with 221 children, were randomized to the standard control diet (see online supplementary material, Supplemental Fig. 1). The age of the children was similar in both groups, as was the prevalence of mild medical illness and enteric parasites at the initial medical evaluation. Baseline anthropometric measurements were similar in both groups. The mean HAZ was −0·7 (sd 1·0) and −0·6 (sd 1·1) in the intervention and control groups, respectively. The percentage of moderate to severe chronic malnutrition (HAZ <−2) was 9·6 % in the intervention group v. 9·0 % in the control group. The prevalence of moderate acute malnutrition (WHZ <−2) was less than 1 % in both groups. However, the baseline anaemia prevalence was higher in the FPi group (35·9 v. 22·2 %, P<0·05). No differences were noted in other baseline characteristics (Table 1).
Table 1 Baseline demographic and anthropometric characteristics of participating children (n 441) aged 6–36 months from northern Lima, Peru, January–December 2012

FPi, fish protein isolate; HAZ, height-for-age Z-score; WHZ, weight-for-height Z-score.
HAZ and WHZ based on 2006 WHO child growth charts( 16 ).
We designed seventy-three lunch menus (rice, beans, meat, noodles, vegetables, etc., as in dinner). The recipes were used in all study sites. We determined that children aged 6–36 months should receive approximately 3350 to 4600 kJ/d (800 to 1100 kcal/d); and 40–45 % of the daily energy intake during their lunch meal, 13 % as protein, 22 % as fat and 65 % as carbohydrate (1380 kJ (330 kcal) on average). In the intervention diets, FPi replaced 50 % of animal protein, with a mean of 5·5 g (range 2·7–7·7 g) per serving. Over the course of the study 36917 meals were prepared and administered in a supervised manner.
All children in the study had positive weight and size gain. Two children were lost to follow-up (one in each group), because they moved to another district and stopped going to the day care or nutritional centre. The percentage of moderate to severe chronic malnutrition (HAZ<−2) at study end was 8·3 % in the intervention group v. 9·5 % the control group, although this was not a significant difference (Table 2). To determine the effectiveness of the protein in the growth of children, changes in HAZ and WHZ over the 6-month follow-up were compared (Figs 1 and 2). No statistically significant differences in HAZ and WHZ were found using the FPi diet compared with the control diet. Slightly better growth was observed with FPi; however, given the CI, the advantage that FPi could have is less than 0·34 for HAZ and 0·25 for WHZ semi-annually (see online supplementary material, Supplemental Tables 1 and 2).
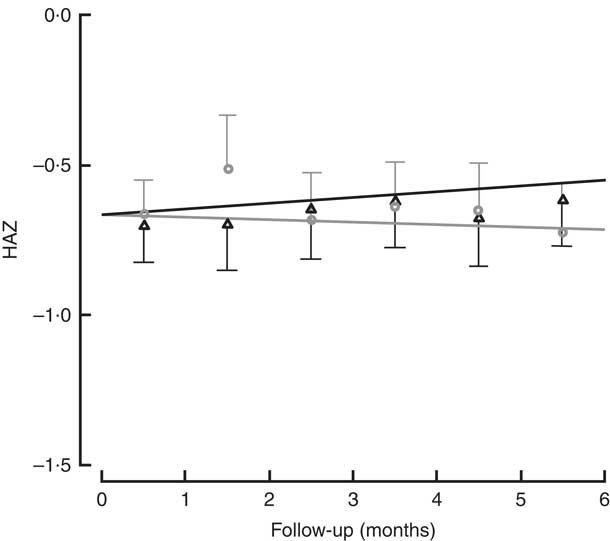
Fig. 1 Height-for-age Z-score (HAZ) among children (n 441) aged 6–36 months from northern Lima, Peru, January–December 2012, who received daily lunch meals with and without fish protein isolate for 6 months. Data are means with standard deviation represented by vertical lines; ![]() , FPi+, intervention children receiving the fish protein isolate daily at lunch;
, FPi+, intervention children receiving the fish protein isolate daily at lunch; ![]() , FPi–, control children with no fish protein isolate, but receiving a similar diet (same amount of protein and energy)
, FPi–, control children with no fish protein isolate, but receiving a similar diet (same amount of protein and energy)
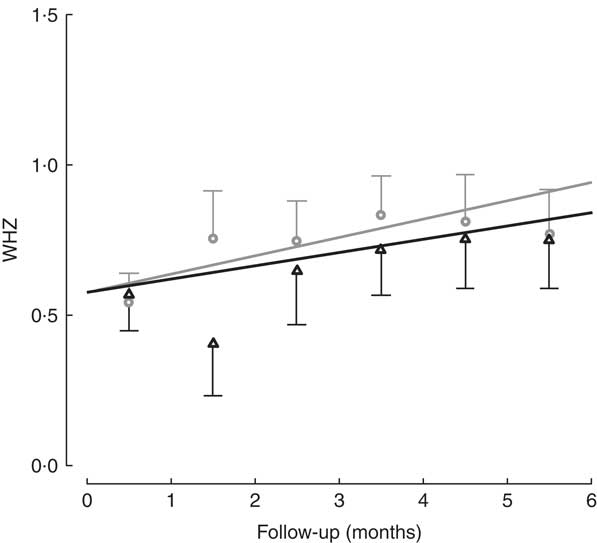
Fig. 2 Weight-for-height Z-score (WHZ) among children (n 441) aged 6–36 months from northern Lima, Peru, January–December 2012, who received daily lunch meals with and without fish protein isolate for 6 months. Data are means with standard deviation represented by vertical lines; ![]() , FPi+, intervention children receiving the fish protein isolate daily at lunch;
, FPi+, intervention children receiving the fish protein isolate daily at lunch; ![]() , FPi–, control children with no fish protein isolate, but receiving a similar diet (same amount of protein and energy)
, FPi–, control children with no fish protein isolate, but receiving a similar diet (same amount of protein and energy)
Table 2 Nutritional characteristics at the end of the study, by treatment group, among children (n 441) aged 6–36 months from northern Lima, Peru, January–December 2012
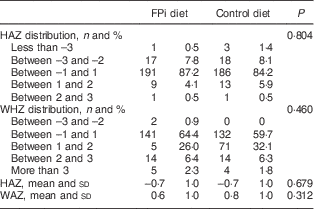
FPi, fish protein isolate; HAZ, height-for-age Z-score; WHZ, weight-for-height Z-score.
HAZ and WHZ based on 2006 WHO child growth charts( 16 ).
The amounts of nutrients offered (energy and protein) were similar in both groups. This was determined based on the exact weight of food that went into preparing lunch. On average, each serving of lunch offered 1391 (sd 77) kJ (332·5 (sd 18·5) kcal), 5·3 (sd 1·5) g of animal protein and 6·8 (sd 1·2) g of vegetable protein (Table 3). While the difference in consumption was determined to be different over time, the amounts of nutrients offered were similar. Children in the control diet consumed 203·0 (sd 78·8) g, while those assigned to the intervention diet consumed 183·7 (sd 83·9) g (Table 3). These averages were established based on a sample of approximately 5000 randomly selected portions. By comparing the fractions consumed in relation to that offered, this was slightly lower in the group with FPi, 70 %, v. 80 % in the control group. Considering the total number of servings, the amount offered was similar in both groups (Fig. 3(a)), the intake was similar (Fig. 3(b)) and the acceptability, as measured by the rate of intake (consumption/offered), was slightly lower with the FPi diet (Fig. 3(c)).
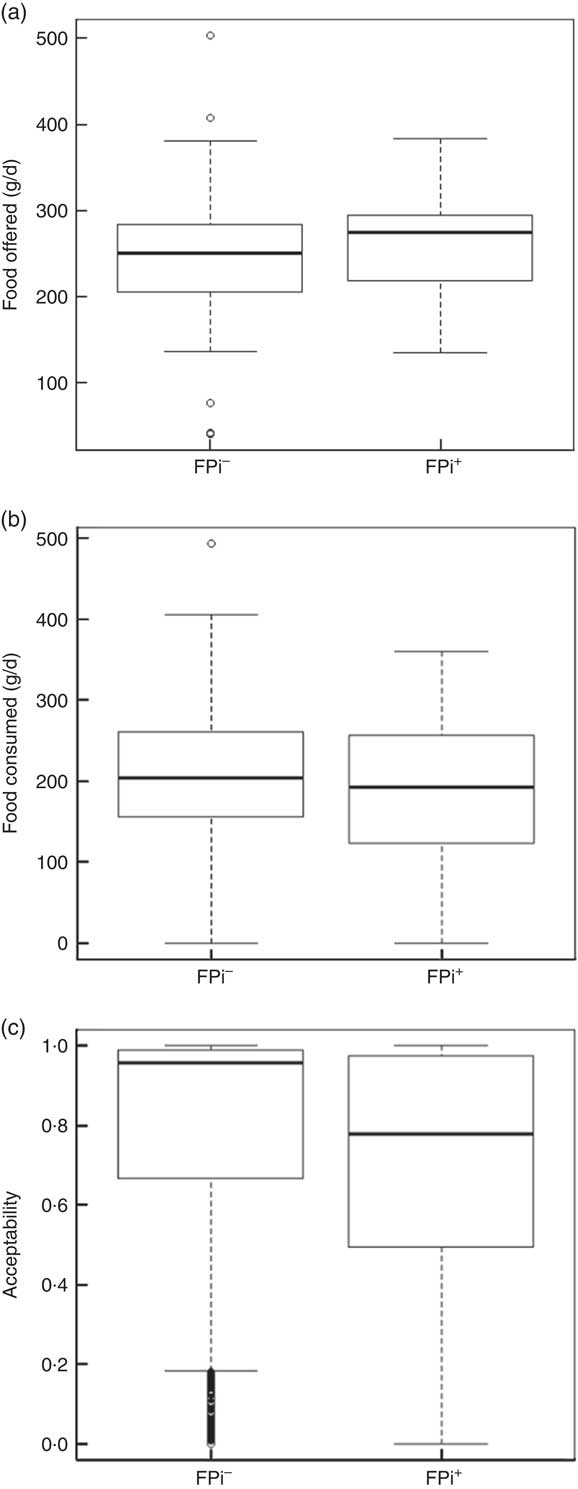
Fig. 3 Box-and-whisker plots comparing (a) amount of food offered daily, (b) amount of food consumed daily and (c) acceptability (defined as amount consumed/amount offered) among children (n 441) aged 6–36 months from northern Lima, Peru, January–December 2012, who received daily lunch meals with and without fish protein isolate for 6 months (FPi+, intervention children receiving the fish protein isolate daily at lunch; FPi–, control children with no fish protein isolate, but receiving a similar diet (same amount of protein and energy)). The bottom and top edge of the box represent the first and third quartiles (interquartile range); the line within the box represents the median; the ends of the bottom and top whiskers represent the minimum and maximum values; and the dots represent outliers
Table 3 Composition of the diet and average quantity of food consumed, overall and by treatment group, among children (n 441) aged 6–36 months from northern Lima, Peru, January–December 2012
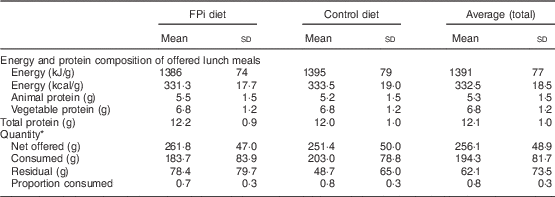
* Sample of approximately 13 % of administered menus: 5545 menus served (3065 control menus and 2480 FPi menus).
The percentage of children who consumed at least 70 % of the meal offered was used to determine the level of acceptability. Based on the sample of lunches, 73·1 % of lunches (2721 servings) were acceptable in the control diet group, v. 56·7 % (1853 servings) in the FPI diet group. In assessing the acceptability over time (consumption equal to or greater than 70 % of the offering), a significant difference was found, with the FPi diet at a disadvantage. The difference increased over time through the study, which appears to be related to an increase in the acceptability of the diet without FPi over time (Fig. 4).
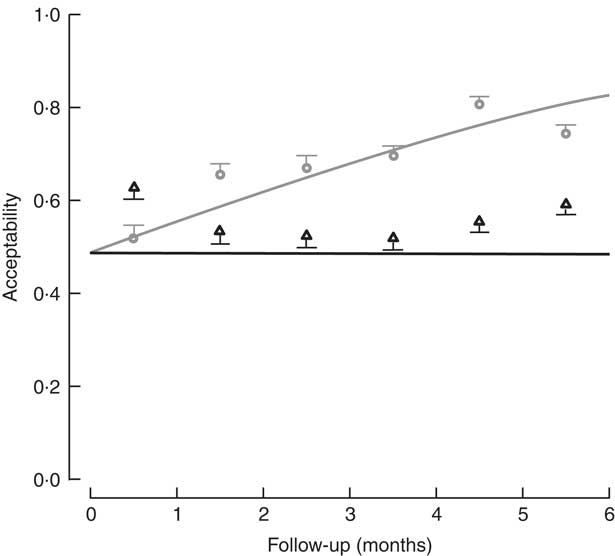
Fig. 4 Acceptability (defined as amount consumed/amount offered ≥70 %) among children (n 441) aged 6–36 months from northern Lima, Peru, January–December 2012, who received daily lunch meals with and without fish protein isolate for 6 months. Data are means with standard deviation represented by vertical lines; ![]() , FPi+, intervention children receiving the fish protein isolate daily at lunch;
, FPi+, intervention children receiving the fish protein isolate daily at lunch; ![]() , FPi–, control children with no fish protein isolate, but receiving a similar diet (same amount of protein and energy)
, FPi–, control children with no fish protein isolate, but receiving a similar diet (same amount of protein and energy)
The measurement of Hb at the end of the study was similar in both groups: 9·5 (sd 4·8) mg/dl in the FPi group v. 8·9 (sd 5·2) mg/dl in the control group. Children who had anaemia at baseline received Fe supplementation in both groups.
No adverse events were associated with the use of FPi. All children were monitored daily by the team of nutritionists and fieldworkers at each study site. Additionally, the children were assessed monthly by a physician, with no health problems attributed to the intervention.
Discussion
No significant difference was found in the efficacy of the FPi diet compared with the control diet in terms of child growth: HAZ and WHZ values of the two groups over the 6-month follow-up were similar. Acceptability, measured as consumption equal to or greater than 70 % of the offering, suggested a significant difference increasing throughout the study, indicating a lower acceptability of the FPi and an increasing acceptability over time of the control diet. Consumption of the FPi was safe; no adverse events were reported.
Children under 36 months of age require protein, essential fatty acids and micronutrients. These elements are difficult to obtain in the absence of animal protein; however, milk, meat and eggs, the conventional sources of animal protein, can be prohibitively expensive for low-income households. The fish protein in addition to the low cost has other potential benefits related to the nutrients in fish (n-3 fatty acids including DHA, minerals, etc.).
In Peru, fish and fish derivatives are an important source of animal protein and micronutrients. Sardines, one of the most important clupeids commercially caught, are available on the Peruvian coast, showing large shifts of distribution with El Niño events( Reference Lluch-Belda, Crawford and Kawasaki 17 ). Protein isolate from sardines provides an easily digestible protein of high biological value at a low cost. Prior efforts to employ supplements such as fish meal have been surpassed by technological improvements that have allowed the development of a purer product, with greater appeal to consumers. While fish products are noted to be of high biological value, no recent controlled studies evaluating their effectiveness and acceptability exist. The challenge in designing diets is to develop a balanced approach that meets the nutritional requirements and is both affordable and palatable.
In the current community trial, we evaluated the efficacy and acceptability of FPi in the diets of children under 3 years old. The growth of children who received the intervention diet was similar to that of children who received the standard diet. Both groups received the same amount of energy and the same total amount of protein. In general, both groups demonstrated an increase in HAZ and WHZ during the 6-month intervention; however, the average HAZ (stunting) did not change significantly. Regarding WHZ, there was a slight increase during the intervention, above +0·5. In a previous study Nesse et al. demonstrated that daily consumption of 3 or 6 g of fish protein hydrolysate (Amizate) was safe and suitable for supplementing the diets of malnourished children (randomized, placebo-controlled, double-blind and parallel study) and that growth was not negatively impacted by administration of Amizate( Reference Nesse, Nagalakshmi and Marimuthu 18 ). However, that study is different from ours, since we have not studied malnourished children. Brinkman et al. evaluated the acceptability and tolerance of fish protein concentrate (Viobin) in pre-school children (randomized trial), concluding no difference in weight gain between groups( Reference Brinkman, Sharadambal and Madhave 19 ). Tavill and Gonik also evaluated fish protein concentrate in weanling infants in Morocco over a period of 6 months. Infants receiving fish protein concentrate thrived equally as the control group (no significant differences in weight and length increments over time)( Reference Tavill and Gonik 20 ). Our results are compatible with these studies, showing no significant differences in the anthropometric measures throughout the study.
No adverse events were reported. The protein was safe and well tolerated. Children were monitored daily by the nutritionist at each study site and were evaluated monthly by a physician. No health problems associated with the intervention were found. There were no events suggesting an allergenic effect of the intervention diet. Similarly, no differences in the rates of anaemia in the intervention and control groups were found at the end of the trial.
The acceptability of the intervention diet was adequate, as determined by the measurements of daily food consumption, but was noted to be less than that of the control diet. It should be noted that there was virtually no increase in consumption of the intervention diet over time, while there was an increase in consumption of the control diet.
The analysis used was limited to the main hypothesis of the study, the interaction or difference of linear slopes over time between the intervention groups. The differences may be amplified and/or explained by additional hypotheses that involve, for example, saturation or non-linear additional covariates such as age or characteristics of the model preparation. Part of the trend over time could be attributed to withdrawals, which may not necessarily be independent of the intervention.
In relation to the cost-effectiveness analysis, the cost of the intervention was lower with the use of fish protein, representing a saving of between 20 and 40 % of the cost of the diet with the use of other animal protein (beef, chicken, eggs, beef liver). Rising food prices are associated with an increased risk of malnutrition among children. In India, each $US 0·17 increase in the price of rice per kilogram was associated with a drop in rice consumption (73 g/d), resulting in lower WHZ by 0·005 (95 % CI 0·001, 0·008)( Reference Vellakkal, Fledderjohann and Basu 21 ). The cost per kilogram of FPi is similar to the cost per kilogram of meat pulp (the most expensive protein, approximately $US 6/kg). The savings derived from the use of the FPi are greater as the content of protein per gram of food is proportionately greater with the FPi, specifically, 80 g protein/100 g FPi, while other sources have a maximum protein concentration of 20 g protein/100 g. It should be reiterated that these results correspond to the replacement of only 50 % of the animal protein diet with FPi. Therefore, the cost savings can be even greater, and greater effect could be seen in the growth of children, if a greater percentage of protein in the diet is replaced with FPi and if the intervention occurs over a greater duration.
In summary, children assigned to the FPi diet demonstrated equivalent growth to the control group, adequate acceptability of the FPi was found, and the FPi was safe and well tolerated. As part of the present study, we have developed a systematic methodology to implement the use of FPi in nutritional assistance programmes and food supplements in middle- and low-income countries. Additional studies with larger proportions of FPi replacement are recommended. Further work is required to adapt the recipes and menus of this project to the rural areas of Peru to include both local food resources and FPi. Planning a larger-scale intervention specifically targeting rural areas of the Andes and jungle areas of Peru, where accessibility to animal protein is lower and where child malnutrition rates are higher, is necessary.
Acknowledgements
Acknowledgements: The authors thank all study participants and their families and the staff at all centres for their support and cooperation with the project. The authors thank all participating institutions: Centros de Desarrollo Integral de la Familia (CEDIF) del Instituto Nacional de Bienestar Integral de la Familia (INABIF); Instituciones Educativas del Nivel Inicial (IEI) y las redes de Salas de Estimulación Temprana (SET) de la Unidad de Gestión Educativa Local 2 (UGEL-2); and el Comedor Infantil del Centro de Salud del Ermitaño Alto del Ministerio de Salud, for allowing them to carry out the project in their institutions and for providing all facilities. Special thanks go to the project nutritionists, nurses and fieldworkers for their hard work and dedication to all aspects of the project. And finally, the authors wish to thank Dr Mirtha Gayoso for her assistance in the final editing of the manuscript. Financial support: This study was funded by Fondo de las Americas (FONDAM), Lima, Peru (grant: ‘Reducción de la desnutrición infantil con Proteína Purificada de Pescado en Polvo’. Eje de Desarrollo: Supervivencia Infantil); and by Blue Wave and Proteicos Concentrados SAC, Lima, Peru. The funders had no role in the design, analysis or writing of this article. Conflict of interest: None. Authorship: T.J.O. contributed by formulating the research question, designing the study, carrying it out, analysing the data and writing the article. N.B. contributed by designing the study, carrying it out, analysing the data and reviewing the final version of the manuscript. G.V. contributed by carrying out the study, analysing the data and reviewing the final version of the manuscript. V.B. contributed by carrying out the study, analysing the data and reviewing the final version of the manuscript. M.C. contributed by designing the study, analysing the data and reviewing the final version of the manuscript. A.L.-C. contributed by formulating the research question, designing the study, analysing the data and reviewing the final version of the manuscript. Ethics of human subject participation: This study was conducted according to the guidelines laid down in the Declaration of Helsinki and all procedures involving human subjects were approved by the Institutional Ethics Committees of Universidad Peruana Cayetano Heredia (UPCH) and Hospital Cayetano Heredia (HCH). Written informed consent was obtained from all parents of participating children. The study was reviewed and approved by the Peruvian National Institute of Health (INS).
Supplementary material
To view supplementary material for this article, please visit https://doi.org/10.1017/S136898001700163X


