Modern Homo sapiens, having existed for approximately 200,000 to 300,000 years, developed foundational cognitive abilities well before 12,000 years ago. The transition from hunter-gatherer societies to agricultural and subsequently industrial societies introduced changes that likely had significant impacts on cognitive capacities and personality traits. The key mechanisms driving these evolutionary changes include:
-
Neolithic Revolution. The shift to agriculture led to increased population density and greater social complexity, which necessitated more advanced planning and organizational skills. This increase in socio-ecological complexity, paralleling observations in nonhuman primates, likely catalyzed human cognitive evolution (Shultz & Dunbar, Reference Shultz and Dunbar2022).
-
Specialization in labor. With the rise of more complex societies, there emerged a division of labor and role specialization. This development drove the evolution of a diverse range of cognitive skills (Vásárhelyi & Scheuring, Reference Vásárhelyi and Scheuring2018).
-
Knowledge transmission. The adoption of a sedentary lifestyle facilitated enhanced knowledge transfer across generations. This dynamic favored individuals with superior cognitive skills, particularly in innovation and learning (Henrich, Reference Henrich2015; Tomasello, Reference Tomasello2019).
-
Social complexity. Denser societies necessitated advanced social interaction skills. According to the ‘Machiavellian Intelligence’ hypothesis, the social challenges inherent in complex societies may have played a role in enhancing cognitive abilities (Byrne & Whiten, Reference Byrne and Whiten1988).
-
Language development. The formation of complex societies was also conducive to the development of sophisticated languages, which are closely intertwined with cognitive development (Wray & Grace, Reference Wray and Grace2007).
-
Disease and settlement. Permanent settlements increased exposure to infectious diseases. This may have favored cognitive adaptations that were crucial for survival in these new environments (Diamond, Reference Diamond1997).
-
Education and written language. The accumulation of knowledge, coupled with the development of written language, likely reinforced cognitive abilities. This supported more structured learning and formal education.
Collectively, these factors suggest a feedback loop wherein cultural and societal advancements exerted a significant influence on human cognitive evolution.
Woodley et al. (Reference Woodley, Younuskunju, Balan and Piffer2017) presented direct empirical evidence supporting this theory, revealing significantly higher PGSs in contemporary Europeans compared to ancient individuals from 4.56 to 1.21 kyr BP. However, the study had limitations due to its small sample size (N = 99). Kuijpers et al. (Reference Kuijpers, Domínguez-Andrés, Bakker, Gupta, Grasshoff, Xu, Joosten, Bertranpetit, Netea and Li2022), with a larger sample of ancient genomes, confirmed these findings and observed an evolutionary acceleration post-Neolithic. Notably, their research depended on what was then an older PGS for education from Okbay et al. (Reference Okbay, Beauchamp, Fontana, Lee, Pers, Rietveld, Turley, Chen, Emilsson, Meddens, Oskarsson, Pickrell, Thom, Timshel, de Vlaming, Abdellaoui, Ahluwalia, Bacelis and Baumbach2016).
Our study explores temporal variations in PGSs through an enlarged dataset of ancient genomes. We utilize PGSs derived from GWAS for traits like educational attainment (EA), cognitive ability and IQ, implementing the cutting-edge imputation tool, GLIMPSE2 (Rubinacci et al., Reference Rubinacci, Hofmeister, Sousa da Mota and Delaneau2023). This tool is at the forefront for imputing low coverage genomes, offering low error rates and consistent accuracy across both ancient and modern DNA samples (Sousa da Mota et al., Reference Sousa da Mota, Rubinacci, Cruz Dávalos, Amorim, C. E., Sikora, Johannsen, Szmyt, Włodarczak, Szczepanek, Przybyła, Schroeder, Allentoft, Willerslev, Malaspinas and Delaneau2023).
Our analysis includes adjustments for ancestral background and geographic location. This study expands upon Kuijpers et al. (Reference Kuijpers, Domínguez-Andrés, Bakker, Gupta, Grasshoff, Xu, Joosten, Bertranpetit, Netea and Li2022) by using a GWAS based on a much larger sample (3 million individuals compared to 293,000) and focusing on different genetic traits. Unlike Kuijpers et al., we exclude medical phenotypes like lipoprotein levels and cardiovascular disease, instead incorporating mental health traits such as neuroticism, autism and schizophrenia. These were not examined in Kuijpers et al.’s study. Additionally, our substantial collection of (post-)medieval genomes enables us to explore more recent time trends. With a much larger sample size (2625 compared to 827 genomes), our study offers a finer spatio-temporal analysis of the genetic landscape.
The phenotypic level shows a negative correlation between cognitive ability and risk for schizophrenia (Keefe, Reference Keefe2008). Cognitive impairments in schizophrenia patients are distinct from their clinical condition (Bilder et al., Reference Bilder, Goldman, Robinson, Reiter, Bell, Bates, Pappadopulos, Willson, Alvir, Woerner, Geisler, Kane and Lieberman2000; Glahn et al., Reference Glahn, Almasy, Blangero, Burk, Estrada, Peralta, Meyenberg, Castro, Barrett, Nicolini, Raventós and Escamilla2007; Goldberg et al., Reference Goldberg, Burdick, McCormack, Napolitano, Patel, Sevy, Goldman, Lencz, Malhotra, Kane and Robinson2009; Gottesman & Gould, Reference Gottesman and Gould2003; Lencz et al., Reference Lencz, Smith, McLaughlin, Auther, Nakayama, Hovey and Cornblatt2006). These impairments start in early childhood and persist before illness onset, affecting educational achievement (Reichenberg et al., Reference Reichenberg, Caspi, Harrington, Houts, Keefe, Murray, Poulton and Moffitt2010; Snitz et al., Reference Snitz, Macdonald and Carter2006). The molecular genetic level also shows an inverse relationship with cognitive ability (Comes et al., Reference Comes, Senner, Budde, Adorjan, Anderson-Schmidt, Andlauer, Gade, Hake, Heilbronner, Kalman, Reich-Erkelenz, Klöhn-Saghatolislam, Schaupp, Schulte, Juckel, Dannlowski, Schmauß, Zimmermann and Reimer2019; Hill et al., Reference Hill, Davies, Liewald, McIntosh and Deary2016; Lam et al., Reference Lam, Trampush, Yu, Knowles, Davies, Liewald, Starr, Djurovic, Melle, Sundet, Christoforou, Reinvang, DeRosse, Lundervold, Steen, Espeseth, Räikkönen, Widen and Palotie2017; Lencz et al., Reference Lencz, Knowles, Davies, Guha, Liewald, Starr, Djurovic, Melle, Sundet, Christoforou, Reinvang, Mukherjee, DeRosse, Lundervold, Steen, John, Espeseth, Räikkönen and Widen2014; Smeland et al., Reference Smeland, Frei, Kauppi, Hill, Li, Wang, Krull, Bettella, Eriksen, Witoelar, Davies, Fan, Thompson, Lam, Lencz, Chen, Ueland, Jönsson and Djurovic2017).
We hypothesize an opposite temporal trend to cognitive ability, with PGSs decreasing over time, supported by recent studies (González-Peñas et al., Reference González-Peñas, de Hoyos, Díaz-Caneja, Andreu-Bernabeu, Stella, Gurriarán, Fañanás, Bobes, González-Pinto, Crespo-Facorro, Martorell, Vilella, Muntané, Molto, Gonzalez-Piqueras, Parellada, Arango and Costas2023). A similar trend is hypothesized for depression, negatively correlated to complex cognition (Cullen et al., Reference Cullen, Nicholl, Mackay, Martin, Ul-Haq, McIntosh, Gallacher, Deary, Pell, Evans and Smith2015; Lim et al., Reference Lim, Oh, Han, Huh, Jung, Patkar, Steffens and Jang2013; Snyder, Reference Snyder2013). Autism, especially high-functioning autism or Asperger’s syndrome, is predicted to follow a similar trend as IQ and EA (Grove et al., Reference Grove, Ripke, Als, Mattheisen, Walters, Won, Pallesen, Agerbo, Andreassen, Anney, Awashti, Belliveau, Bettella, Buxbaum, Bybjerg-Grauholm, Bækvad-Hansen, Cerrato, Chambert, Christensen, Churchhouse and Børglum2019). Urban societies may have influenced the selection for autism-related traits while presenting challenges for individuals with schizophrenia (Lederbogen et al., Reference Lederbogen, Kirsch, Haddad, Streit, Tost, Schuch and Meyer-Lindenberg2011; Marcelis et al., Reference Marcelis, Takei and van Os1999; van Os et al., Reference van Os, Kenis and Rutten2010). Modern societies may select against traits associated with conditions like schizophrenia, contrasting with the value placed on such traits in traditional societies.
Our access to medieval genomes from Northwest Europe allows us to evaluate Gregory Clark’s theory (Clark, Reference Clark2017). Clark suggests that the traits of the upper echelons in medieval England played a role in the Industrial Revolution. We dissect this into two hypotheses: a ‘strong’ hypothesis specific to England and a ‘weak’ hypothesis applicable across Europe. We will use a PGS of occupational status from a recent GWAS (Akimova et al., Reference Akimova, Wolfram, Ding, Tropf and Mills2023) as our primary measure, along with IQ and educational achievement as secondary measures, to examine the Cold Winters theory of intelligence (Lynn, Reference Lynn1991, Reference Lynn2006).
Materials and Methods
PGSs were calculated using GWAS data drawn from various studies. A recent large-scale genomewide association study (GWAS) on height, involving a diverse sample of 4 million individuals from multiple ancestries, identified 7209 loci linked to height across 12,111 genomewide significant regions. To refine these findings, we employed linkage disequilibrium (LD) clumping with a threshold of LD < 0.1 and a significance level of p < 5e-8 on the complete summary statistics from the multi-ancestry sample. This process yielded a set of 13,645 single nucleotide polymorphisms (SNPs; Yengo et al., Reference Yengo, Vedantam, Marouli, Sidorenko, Bartell, Sakaue, Graff, Eliasen, Jiang, Raghavan, Miao, Arias, Graham, Mukamel, Spracklen, Yin, Chen, Ferreira and Highland2022). The GWAS summary statistics for EA came from two distinct studies. One was a study by Lee et al. (Reference Lee, Wedow, Okbay, Kong, Maghzian, Zacher, Nguyen-Viet, Bowers, Sidorenko, Karlsson Linnér, Fontana, Kundu, Lee, Li, Li, Royer, Timshel, Walters, Willoughby, Yengo and Cesarini2018), which utilized a multitrait analysis of GWAS (MTAG) comprising four phenotypes (years of education, cognitive performance, self-reported math ability, highest math class taken). This GWAS is commonly referred to as EA3 (Merz et al., Reference Merz, Strack, Hurtado, Vainik, Thomas, Evans and Khundrakpam2022), because it was preceded by two GWAS of EA (Okbay et al., Reference Okbay, Beauchamp, Fontana, Lee, Pers, Rietveld, Turley, Chen, Emilsson, Meddens, Oskarsson, Pickrell, Thom, Timshel, de Vlaming, Abdellaoui, Ahluwalia, Bacelis and Baumbach2016; Rietveld et al., Reference Rietveld, Medland, Derringer, Yang, Esko, Martin, Westra, Shakhbazov, Abdellaoui, Agrawal, Albrecht, Alizadeh, Amin, Barnard, Baumeister, Benke, Bielak, Boatman, Boyle and Koellinger2013).
The other was a recent GWAS on EA that relied on a sample of approximately 3 million participants, employed for EA4 PGS computations (Okbay et al., Reference Okbay, Wu, Wang, Jayashankar, Bennett, Nehzati, Sidorenko, Kweon, Goldman, Gjorgjieva, Jiang, Hicks, Tian, Hinds, Ahlskog, Magnusson, Oskarsson, Hayward, Campbell, Porteous and Young2022). Only the lead SNPs with a p value < 5 × 10^-8 were utilized in the analysis.
A recent schizophrenia (SCZ) GWAS by Trubetskoy et al. (Reference Trubetskoy, Pardiñas, Qi, Panagiotaropoulou, Awasthi, Bigdeli, Bryois, Chen, Dennison, Hall, Lam, Watanabe, Frei, Ge, Harwood, Koopmans, Magnusson, Richards and Sidorenko2022) identified 313 independent SNPs in the ‘primary’ GWAS that were significant at a genomewide level (p < 5 × 10^-8) with a LD of r^2 < 0.1. The ‘combined’ GWAS results, which meta-analyzed primary GWAS results with summary statistics from deCODE genetics, identified 342 LD-independent significant SNPs. This study, selected for its extensive, transracial GWAS that embraced European, East Asian, African and Amerindian ancestries, was used to calculate PGSs using both SNP sets (‘primary’ and ‘combined’). The PGS derived from the combined ancestry GWAS yielded a more profound explanatory insight than its matched ancestry counterpart for non-European groups, likely due to the latter’s reduced sample size, thus avoiding the use of ancestry-specific GWAS summary statistics.
For autism, the largest GWAS of ASD was employed (Grove et al., Reference Grove, Ripke, Als, Mattheisen, Walters, Won, Pallesen, Agerbo, Andreassen, Anney, Awashti, Belliveau, Bettella, Buxbaum, Bybjerg-Grauholm, Bækvad-Hansen, Cerrato, Chambert, Christensen, Churchhouse and Børglum2019), which identified 88 top loci, 69 of which had p < 5 × 10^−8. For depression, the most recent and extensive meta-analysis was used (Als et al., Reference Als, Kurki, Grove, Voloudakis, Therrien, Tasanko, Nielsen, Naamanka, Veerapen, Levey, Bendl, Bybjerg-Grauholm, Zeng, Demontis, Rosengren, Athanasiadis, Bækved-Hansen, Qvist, Bragi Walters, Thorgeirsson and Børglum2023). After executing clumping (r^2= 0.1 within a 250 KB window and p < 5 × 10^−8), 305 SNPs remained.
For neuroticism, we employed the most recent GWAS of a general factor of neuroticism (Kim et al., Reference Kim, Saunders, Giannelis, Willoughby, DeYoung and Lee2023). The authors identified the lead SNPs using a threshold that was less stringent than the standard one (p < 10^−5 vs 5 × 10^−8) since their analysis was powered with biological annotation. We chose to adhere to this threshold because the number of SNPs below the conventional one would have been insufficient (N = 19).
Concerning occupational status (SES), 106 genomewide significant SNPs from the GWAS conducted on the UK Biobank were used (Akimova et al., Reference Akimova, Wolfram, Ding, Tropf and Mills2023). The analysis employing the Cambridge Social Interaction and Stratification Scale (CAMSIS) was preferred as it exhibited 50% higher heritability and more significant SNPs (Akimova et al., Reference Akimova, Wolfram, Ding, Tropf and Mills2023).
Metadata for ancient samples, including date, latitude, longitude, and coverage, were amalgamated from 11 disparate datasets; ENA numbers: PRJEB23635 (Olalde et al., Reference Olalde, Brace, Allentoft, Armit, Kristiansen, Booth, Rohland, Mallick, Szécsényi-Nagy, Mittnik, Altena, Lipson, Lazaridis, Harper, Patterson, Broomandkhoshbacht, Diekmann, Faltyskova, Fernandes, Ferry and Reich2018), PRJEB50940 (Fischer et al., Reference Fischer, Pemonge, Ducoussau, Arzelier, Rivollat, Santos, Barrand Emam, Bertaud, Beylier, Ciesielski, Dedet, Desenne, Duday, Chenal, Gailledrat, Goepfert, Gorgé, Gorgues and Kuhnle2022), PRJEB51862 (Posth et al., Reference Posth, Yu, Ghalichi, Rougier, Crevecoeur, Huang, Ringbauer, Rohrlach, Nägele, Villalba-Mouco, Radzeviciute, Ferraz, Stoessel, Tukhbatova, Drucker, Lari, Modi, Vai, Saupe, Scheib and Krause2023), PRJEB56216 (Skourtanioti et al., Reference Skourtanioti, Ringbauer, Gnecchi Ruscone, Bianco, Burri, Freund, Furtwängler, Gomes Martins, Knolle, Neumann, Tiliakou, Agelarakis, Andreadaki-Vlazaki, Betancourt, Hallager, Jones, Kakavogianni, Kanta, Karkanas, Kataki and Stockhammer2023), PRJEB31249 (Brace et al., Reference Brace, Diekmann, Booth, van Dorp, Faltyskova, Rohland, Mallick, Olalde, Ferry, Michel, Oppenheimer, Broomandkhoshbacht, Stewardson, Martiniano, Walsh, Kayser, Charlton, Hellenthal and Armit2019), PRJEB42866 (Posth et al., Reference Posth, Zaro, Spyrou, Vai, Gnecchi-Ruscone, Modi, Peltzer, Mötsch, Nägele, Vågene, Nelson, Radzevičiūtė, Freund, Bondioli, Cappuccini, Frenzel, Pacciani, Boschin, Capecchi, Martini and Krause2021), PRJEB54831 (Lazaridis et al., Reference Lazaridis, Alpaslan-Roodenberg, Acar, Açıkkol, Agelarakis, Aghikyan, Akyüz, Andreeva, Andrijašević, Antonović, Armit, Atmaca, Avetisyan, Aytek, Bacvarov, Badalyan, Bakardzhiev, Balen, Bejko, Bernardos and Davtyan2022), PRJEB32566 (Antonio et al., Reference Antonio, Gao, Moots, Lucci, Candilio, Sawyer, Oberreiter, Calderon, Devitofranceschi, Aikens, Aneli, Bartoli, Bedini, Cheronet, Cotter, Fernandes, Gasperetti, Grifoni, Guidi, La Pastina and Pritchard2019), PRJEB54899 (Gretzinger et al., Reference Gretzinger, Sayer, Justeau, Altena, Pala, Dulias, Edwards, Jodoin, Lacher, Sabin, Vågene, Haak, Ebenesersdóttir, Moore, Radzeviciute, Schmidt, Brace, Bager, Patterson, Papac and Schiffels2022), PRJEB61818 (Rivollat et al., Reference Rivollat, Rohrlach, Ringbauer, Childebayeva, Mendisco, Barquera, Szolek, Le Roy, Colleran, Tuke, Aron, Pemonge, Späth, Télouk, Rey, Goude, Balter, Krause, Rottier, Deguilloux and Haak2023), PRJEB37976 (Margaryan et al., Reference Margaryan, Lawson, Sikora, Racimo, Rasmussen, Moltke, Cassidy, Jørsboe, Ingason, Pedersen, Korneliussen, Wilhelmson, Buś, de Barros Damgaard, Martiniano, Renaud, Bhérer, Moreno-Mayar and Fotakis2020), available at the European Nucleotide Archive. These datasets were individually loaded, row-bound, and compiled into a comprehensive file. In summary, the datasets encompassed 2625 genomes, with dates extending from 32.6 K to 246 years BP (before present).
The allele frequencies were computed using Plink 2.0 (Chang et al., Reference Chang, Chow, Tellier, Vattikuti, Purcell and Lee2015; Purcell & Chang, Reference Purcell and Chang2023), while R 4.1.2 (R Core Team, 2021) was employed for calculating PGSs and conducting subsequent statistical analyses.
Incorporation of Contemporary Genomes
Contemporary genomes belonging to the EUR super-population (N = 503) were incorporated from the 1000 Genomes (The 1000 Genomes Project Consortium, 2015) dataset to facilitate a comparative analysis between ancient and present-day genetic architectures.
Genome Imputation
The ancient genomes were imputed using GLIMPSE2, using 1000 Genomes Project phase3 as reference panel (http://ftp.1000genomes.ebi.ac.uk/vol1/ftp/release/20130502/). For this, raw sequence data in .bam format were processed to generate imputed genotypes. The imputation process aimed to infer missing genotypic information and provide a more comprehensive set of genetic variants for each individual.
Data Transformation
In our analysis, we combined GWAS summary statistics with allele frequency information based on SNP identifiers (chr:pos). SNPs that did not overlap between datasets were excluded. We then compared the GWAS effect allele (A1) with the allele data to ascertain whether it corresponded with the reference (REF) or alternative (ALT) allele in the 1000 Genomes Project (1KG). We computed a weighted PGS, which we refer to as the Genetic Value Score (GVS), for each SNP, taking into account its allele frequency and effect size (beta). Following this, a merged dataset was constructed containing one PGS value for each individual by taking the average GVS across all SNPs. The individual’s data were then augmented with additional attributes, including their dataset source and other relevant metadata, extracted using a custom string parsing function.
Admixture Analysis
Admixture components for the samples were computed using ADMIXTURE software (Alexander et al., Reference Alexander, Novembre and Lange2009), a powerful tool for estimating individual ancestries from multilocus SNP genotype datasets. The ADMIXTURE analysis works by decomposing genotype data of each individual into fractions representing potential ancestral populations.
The analysis explored various models, and the one with the lowest cross-validation (CV) error incorporated five components. The selection of five ancestral populations (K) was based on rigorous cross-validation. The model with five components emerged as having the lowest CV, indicating that it best captures the underlying structure of our dataset without overfitting. Thus, in the analysis that follows, we rely on this five-component model to interpret our population’s genetic ancestry.
Admixture data was merged with the PGS dataset in R by organizing individuals based on their FAM identifiers.
Statistical Analysis
The association between PGS and different population groups was evaluated using an analysis of variance (ANOVA). Additionally, a correlation analysis was conducted to examine the relationship between the PGS values and their corresponding dates, expressed as Years BP.
Regression analyses were carried out to investigate the effects of various predictors on PGS values. The first regression model included Date and Population, the second added Coverage as a covariate, the third introduced geographic variables (Latitude and Longitude) to the predictors, and the fourth introduced ancestry components estimated with ADMIXTURE.
In our regression analysis, we aimed to include the five ancestry components estimated by ADMIXTURE as predictors. However, since the ancestry proportions output by ADMIXTURE sum to 1 for each individual, including all five components introduces a situation of perfect multicollinearity. This means that the value of one component can be perfectly predicted from the values of the others, leading to computational difficulties and unstable coefficient estimates in the regression model. To circumvent this issue, and based on standard analytical practices in such situations, we opted to include only four of the five components in the model. By doing this, the effect of the dropped component is effectively absorbed into the intercept of the regression, and the coefficients of the included components are interpreted relative to it. This adjustment ensures a more stable and interpretable model without compromising the integrity of our analysis.
The analysis centers on the Holocene epoch, spanning the last 12,000 years, which is believed to have driven significant evolutionary shifts in humans. Dietary shifts, lifestyle alterations, selection pressures, and migrations during this time are evidenced to have profoundly transformed the genetic and physical traits of West Eurasians (Irving-Pease et al., Reference Irving-Pease, Refoyo-Martínez, Barrie, Ingason, Pearson, Fischer, Sjögren, Halgren, Macleod, Demeter, Henriksen, Vimala, McColl, Vaughn, Speidel, Stern, Scorrano, Ramsøe and Schork2024). Sparse genomic data available for prior periods also contributes to the emphasis on this timeframe.
Results
General Results
After utilizing the conventional GWAS significance threshold as the p value cut-off (5*10^-8), the GWAS summaries for EA3, EA4, SCZ, IQ, height and autism exhibited SNP counts of 3269, 3951, 342, 241, 3779 and 69 respectively. After merging with the allele frequency file, the SNPs matches and matching rates were 3269 (100% for EA3), 3936 (99.6% for EA4), 333 (97.4% for SCZ), 239 (99.2% for IQ), 3775 (99.9% for height), and 56 (81.15% for autism). For neuroticism and depression, match rates were 100% (139/139 and 305/305 respectively), and 99% for SES (105/106).
The ADMIXTURE plot (Figure 1a) shows each individual’s ancestry proportions. Each individual is represented by a vertical bar, divided into colored segments. The length of each segment shows the proportion of the individual’s genome that comes from each ancestral population. By analyzing the plot, we can discern patterns of population structure and admixture. The ancestry components can also be visualized by group (Figure 1b).

Figure 1a. Admixture plot (K = 5).
The ancestry components can also be visualized by group (1b).

Figure 1b. Ancestry components by group.
Recent consensus identifies three major sources of ancestry for European populations: (a) Mesolithic European hunter-gatherer (HG) ancestry, (b) Anatolian farmer ancestry from Neolithic Near East farmers, and (c) Steppe pastoralist ancestry from Yamnaya pastoralists of Russia and Ukraine (Allentoft et al., Reference Allentoft, Sikora, Sjögren, Rasmussen, Rasmussen, Stenderup, Damgaard, Schroeder, Ahlström, Vinner, Malaspinas, Margaryan, Higham, Chivall, Lynnerup, Harvig, Baron, Della Casa, Dąbrowski, Duffy and Willerslev2015; Haak et al., Reference Haak, Balanovsky, Sanchez, Koshel, Zaporozhchenko, Adler, Der Sarkissian, Brandt, Schwarz, Nicklisch, Dresely, Fritsch, Balanovska, Villems, Meller, Alt and Cooper2010; Mathieson et al., Reference Mathieson, Alpaslan-Roodenberg, Posth, Szécsényi-Nagy, Rohland, Mallick, Olalde, Broomandkhoshbacht, Candilio, Cheronet, Fernandes, Ferry, Gamarra, Fortes, Haak, Harney, Jones, Keating, Krause-Kyora, Kucukkalipci and Reich2018; Skoglund et al., Reference Skoglund, Malmström, Omrak, Raghavan, Valdiosera, Günther, Hall, Tambets, Parik, Sjögren, Apel, Willerslev, Storå, Götherström and Jakobsson2014).
Further analyses differentiate HG ancestry into Eastern and Western HG, which reveal Caucasus hunter-gatherers (CHG) from Georgia linked to Iran’s first farmers, and identify a cluster (GoyetQ2) tied to Spain and Portugal’s Magdalenian culture (Chintalapati et al., Reference Chintalapati, Patterson and Moorjani2022).
The five ADMIXTURE components potentially represent: V1 — West Asian/Iranian ancestry, V2 — Western European Hunter-Gatherer (WHG), V3 — Eastern European Hunter-Gatherer (EHG), V4 — Near Eastern Ancestry, V5 — Anatolian/European Neolithic farmer.
EHG is often considered a proxy for Yamnaya ancestry, with these terms frequently used interchangeably in literature (Racimo et al., Reference Racimo, Woodbridge, Fyfe, Sikora, Sjögren, Kristiansen and Vander Linden2020).
EA3 and EA4
Both EA3 and EA4 showed strong negative correlations with chronological age, indicating a significant shift in EA over time. For EA3, the correlation was r = −0.286 for all samples (p < 2.2 × 10⁻¹⁶, N = 2431 post-outlier removal), and for samples aged under 12,000 years with N = 2393, r = −0.305. ANOVA tests yielded highly significant differences in EA3 and EA4 across population groups (p = 5.76e-60, Ω2 = 0.152 and p = 2.18e-108, Ω² = 0.235).
EA4 displayed a correlation with age of −0.338 (p < 2.2e-16), and for samples aged under 12,000 years, r = −0.313.
Regression models showed a significant effect of Years BP on EA3 and EA4 (p < 0.001). Specifically, the models that included Coverage had coefficients of -0.301 for EA3 and −0.359 for EA4. When Latitude and Longitude were added, these coefficients changed to −0.289 for EA3 and −0.324 for EA4. In the models that incorporated ancestry information, the coefficients further adjusted to −0.127 for EA3 and −0.141 for EA4, as detailed in Supplementary Tables S1 and S2.
Analysis by historical or archaeological periods and comparison with contemporary Europeans
Historical analysis showed a pronounced rise in EA3 from the Upper Paleolithic to the Neolithic with other minor increases (Supplementary Figure S1) Cohen’s d between the Neolithic and Upper Paleolithic was 1.176 (p < .001), indicating a large effect size, between Iron Age and Bronze Age was 0.478 (p < .001), and between contemporary and medieval was 0.396 (p < .001).
EA4’s historical trend was similar to EA3 but included a decrease from the Neolithic to the Bronze Age (Supplementary Figure S2). Cohen’s d for EA4 between the Neolithic and Upper Paleolithic was 1.616 (p < .001), between Copper Age and Neolithic was −0.410 (p = 0.035), between Iron Age and Bronze Age was 0.825 (p < .001), and between contemporary and medieval was 0.534 (p < .001).
IQ PGS
Correlation analysis showed that IQ PGSs negatively correlated with Years BP (r = −.19, p < 2.2 × 10⁻¹⁶ overall; r = −.178 for samples under 12,000 years, p < 2.2 × 10⁻¹⁶). Regression models, as detailed in Supplementary Table S3, support these findings.
Regression analyses indicated a significant effect of Years BP on IQ (p < .001). Specifically, the models that included Coverage had coefficients of −.209. When Latitude and Longitude were added, the coefficient changed to −.199. In the model that incorporated ancestry information, the coefficient further adjusted to −0.111 (Supplementary Table 3S).
Analysis by historical or archaeological periods and comparison with contemporary Europeans
The most pronounced rise in IQ PGS occurred from the Upper Paleolithic to the Neolithic, complemented by minor surges from the Bronze Age to the Iron Age, and from the Middle Ages to modern-day Europeans (Suppementary Figure S3).Tukey’s post-hoc test indicated significant differences between adjacent time periods. Notably, Cohen’s d between the Neolithic and Upper Paleolithic was 1.09 (p < .001), and between the contemporary and medieval periods was 0.313 (p < .001). No significant differences were observed in other comparisons.
These Cohen’s d values suggest a substantial increase in IQ from the Upper Paleolithic to the Neolithic, with a smaller but still significant rise from the Middle Ages to the present.
Similar trends for EA and IQ
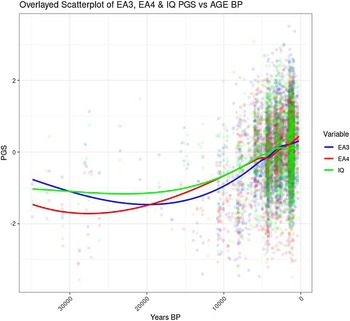
The correlation between Years BP and PGSs can be visualized in a scatterplot (Figure 2). Similar evolutionary trajectories were observed for EA3, EA4 and IQ. Since the data become much less dense before 12 Kya, the data older than that date are omitted.

Figure 2. Temporal trends for EA3, EA4 and IQ PGS.
Figure 3 shows the correlation between Years BP and the cognitive variable in the full sample (including the oldest genomes).

Figure 3. Temporal trend for EA and IQ PGS including samples >12K BP.
Fitting a nonlinear model
Second-degree polynomial models, fitted to explore the relationship between EA3 and EA4 PGSs and Years BP, showed a superior fit and high significance compared to linear models.
In the polynomial models, both first-degree (EA3 = −14.07 and EA4 = −15.08, p < 2 × 10⁻¹⁶) and second-degree (EA3 = −2.95, p = .007; EA4 = −3.41, p < .001) terms were highly significant for EA3 and EA4.
Comparison with linear models demonstrated that the quadratic models provided a significantly better fit for both EA3 (p = .007) and EA4 (p < .001).For IQ, the quadratic model showed a better yet marginally significant fit (p < .001), suggesting a potential nonlinear relationship warranting further investigation.
These results indicate a complex relationship between Years BP and PGSs for EA, which could not be adequately captured by linear models. The significantly better fit of the quadratic models suggests that the effect of Years BP on EA PGSs has both linear and quadratic components.
Increase in SDs per 1K years
The average rate of change in standardized PGS (Z) per century, correlated with Years BP, was calculated using the slope formula from a simple linear regression (b = r × s_Y/s_X), adjusted to a per-millennium scale. Here, r is the correlation coefficient between PGS and age in years BP, s_Y is the standard deviation of the z scores, and s_X is the standard deviation of age. To adapt this to a per-century scale, b was multiplied by 1000. The resulting value, ‘b per millenium’, quantifies the average change in the standardized variable z per 1000 years, providing a robust metric to understand long-term trends in the data. The values were 0.14 for EA3 and EA4 and 0.084 for IQ. This translates to an increase of approximately 0.12 SDs per millennium, suggesting that cognitive ability PGSs were around 1.2 SDs lower 10,000 years ago than today.
Autism and Schizophrenia
Analysis of PGS values for ASD and SCZ revealed contrasting trends over chronological age. ASD exhibited a negative correlation with Years BP (r = −.082, p = 8.995e-05 overall; r = −.068, p = .001 for samples under 12,000 years; see Figure 4).

Figure 4. Temporal trend of ASD PGS.
Conversely, SCZ showed a positive correlation with age (r = .151, p = 8.828e-14 overall; r = .165, p < 3.709e-16 for samples under 12,000 years; see Figure 5).

Figure 5. Temporal trend of Schizophrenia PGS.
For ASD, the models that included Coverage had coefficients of −0.097. When Latitude and Longitude were added, the coefficient changed to -0.084. In the model that incorporated ancestry information, Years BP had no significant effect (β = −0.014, p = .551). (Supplementary Table S4).
The effect of Years BP on SCZ was significant (p < .001) in regression models with Coverage (β = 0.144), with Latitude + Longitude (β = 0.131) but not with ancestry (β = 0.025, p = .243; Supplementary Table S5).
Analysis by historical/archaeological periods and comparison with contemporary Europeans
ASD PGS significantly increased from the medieval to the contemporary period (d = 0.29, p < .001; Supplementary Figure S4).
SCZ had a notable decrease in PGS from the Bronze to the Iron Age. Significant Cohen’s d values were observed: −0.448 (p < .001) between the Bronze and Iron Age, and −0.337 (p < 0.001) from the medieval to contemporary periods (Supplementary Figure S5).
Depression and Neuroticism
For both depression and neuroticism PGS, positive correlations were observed with chronological age. Depression PGS correlated positively with age (r = .128, p = 2.572e-10 overall; r = .160, p = 2.842e-15 for samples under 12,000 years; see Figure 6).

Figure 6. Temporal trend of Depression PGS.
Neuroticism PGS also positively correlated with age (r = .109, p = 9.404e-08 overall; r = .115, p = 1.557e-08 for samples under 12,000 years; see Figure 7). Regression models showed that Years BP significantly affected depression PGS, with beta values of 0.133 in the model including Coverage and 0.153 in the models with Latitude and Longitude. After controlling for ancestry, however, the effect was reduced (β = 0.062, p = .011, Supplementary Table S6).

Figure 7. Temporal trend of Neuroticism PGS.
For neuroticism, Years BP had a significant effect in models with Coverage (β = 0.116) and Latitude + Longitude (β = 0.100), but it was reduced in the model with Ancestry (β = 0.053, p =.477; Table S7).
Analysis by historical/archaeological periods and comparison with contemporary Europeans
Depression PGS generally decreased across historical period. Tukey’s post-hoc test showed a significant difference between contemporary and medieval periods (Cohen’s d = −0.191, p = .018, Supplementary Figure S6).
Neuroticism PGS showed significant differences observed in the Iron Age to Bronze Age (Cohen’s d = −0.346; p = 0.041) and contemporary to medieval periods (Cohen’s d = −0.95, p = .009; Supplementary Figure S7).
Occupational Status
Correlation analysis of SES PGS with age yielded a correlation coefficient of r = −.136 for all samples (p = 1.523e-11) and r = −.125 for samples younger than 12,000 years (p = 8.094e-10). These findings are further supported by regression models detailed in Supplementary Table S8, and the temporal trends in SES PGS can be visualized in Figure 8.

Figure 8. Temporal trend of SES PGS.
The effect of Years BP on SES was significant (p < .001) in regression models with Coverage (β= −0.146), with Latitude + Longitude (β = −0.148) and with ancestry (β = −0.087) (Supplementary Table S8).
Analysis by historical or archaeological periods and comparison with contemporary Europeans
Tukey’s post-hoc test revealed significant differences between Upper Paleolithic and Neolithic (Cohen’s d = 0.843, p < .001) and between contemporary and medieval (Cohen’s d = 0.202, p = .005) (Supplementary Figure S8).
Anthropometric Traits (Height and Intracranial Volume)
Height
Height PGS negatively correlated with age (r = −.296, p < 2.2 × 10⁻¹⁶ for all samples; r = −.416, p < 2.2 × 10⁻¹⁶ for samples under 12,000 years, N = 2393 post-outlier exclusion). Figure 9 illustrates the relationship between Height PGS and Years BP.

Figure 9. Temporal trend of height PGS.
Regression models indicated a significant impact of Years BP on Height PGS, with coefficients of −.31 in the model including coverage, −.22 in the model with Latitude and Longitude, and −.095 in the model including Ancestry (p = .002 for Ancestry; Supplementary Table S9).
Analysis by historical/archaeological periods and comparison with contemporary Europeans
The most pronounced decrease in Height PGS occurred from the Paleolithic to the Neolithic (Supplementary Figure S9). This fits the archaeological record of a reduction in stature in the bones of Neolithic farmers compared to Paleolithic foragers (Mummert et al., Reference Mummert, Esche, Robinson and Armelagos2011).
Tukey’s post-hoc test revealed significant differences. Reporting only the adjacent time periods, the standardized effect size (Cohen’s d) between the Neolithic and the Paleolithic was −1.21 (p < .001), between Copper Age and Neolithic = 0.851 (p < .001), between medieval and Imperial = 1.353 (p < .001), between contemporary and medieval = −0.774 (p < .001). The other differences were not significant.
Intracranial volume
The correlation analysis between ICV PGS and Years BP showed a coefficient of r = −.077 for all samples (p < 8.63 × 10⁻⁶). For samples younger than 12,000 years with a sample size of N = 2394 after outlier exclusion, the coefficient was r = −.078 (p < 9.62 × 10⁻⁵). The relationship between ICV PGS and Years BP can be visualized in Figure 10.

Figure 10. Temporal trend of intracranial volume PGS.
The effect of Years BP on ICV was significant (p < .001) in regression models with Coverage (β = -0.080), and with Latitude + Longitude (β = −0.063), but not with ancestry (β = −0.013, p = .580) (Supplementary Table S10).
Analysis by historical/archaeological periods and comparison with contemporary Europeans
Overall, there were no sharp shifts in the ICV PGS. In stark contrast to EA and IQ, there was a small decrease from the Upper Paleolithic to the Neolithic period (Fig. S9). This fits the archaeological record of a reduction in cranial capacity during the transition from the Pleistocene to the Holocene (Stibel, Reference Stibel2021).
Tukey’s post-hoc test revealed a significant difference between Upper Paleolithic and Neolithic (−0.417, p = .014) and between contemporary and medieval = −0.169 (p = .048). This recent decrease in ICV PGS is in line with the brain size reduction over the last 3000 years reconstructed from fossil data (DeSilva et al., Reference DeSilva, Traniello, Claxton and Fannin2021).
Testing Clark’s Model
Our data supports Clark’s model’s weak hypothesis, suggesting a widespread increase across Europe in genetic predispositions for intelligence and EA traits. Comparing contemporary and medieval Europeans, we observed increases in EA3 (Cohen’s d = 0.389, p < .001), EA4 (Cohen’s d = 0.537, p < .001), IQ PGS (Cohen’s d = 0.31, p < .001), and SES (Cohen’s d = 0.201). This trend is notable, considering no significant increases in these traits since the Iron Age, as delineated by historical period analysis (Figures 2, 4, 6).
Our analysis included a sizable dataset of 467 genomes from five Northwestern European populations, spanning Late Antiquity to the Middle Ages (277 to 1175 CE). A one-way ANOVA showed no significant differences between groups for EA3, IQ, and SES, with the exception of EA4 showing significant variation (EA4: Omega2 = 0.072, p = 7.49e-08).
In a focused analysis on Great Britain, comparing medieval English to contemporary British genomes revealed effect sizes for EA3, EA4, IQ, and SES as follows: 0.195, 0.494, 0.389, and 0.140, respectively (Figure 11). These magnitudes are similar or smaller than those observed in the broader sample, not supporting Clark’s strong hypothesis.

Figure 11. Polygenic scores in medieval and contemporary England.
Temporal trends in South-East Europe
Our dataset comprised a large sample (N = 767) from Southeastern Europe and Anatolia (Lazaridis et al., Reference Lazaridis, Alpaslan-Roodenberg, Acar, Açıkkol, Agelarakis, Aghikyan, Akyüz, Andreeva, Andrijašević, Antonović, Armit, Atmaca, Avetisyan, Aytek, Bacvarov, Badalyan, Bakardzhiev, Balen, Bejko, Bernardos and Davtyan2022). This allowed us to run a separate analysis for this region for the two main cognitive phenotypes (EA3, EA4). We found a significant negative correlation between EA3 and Years BP (r = −.185, p = 2.644e-07) (Figure S11). Regression results supported the effect of Years BP (β = −0.11) after accounting for the first 10 principal components (PCs) and coverage’s effect was not significant (β = −0.04, p = .41). A similar correlation with Years BP was found for EA4 (r = −.22) (Supplementary Figure S12). The effect was reduced but still significant (β = −0.11) in the regression model with the first 10 PCs and coverage had no significant effect (β = −0.04, p = .19).
Height PGS in NW Europeans
Height PGS computed for five Northwestern European populations showed significant differences (Omega2 = 0.004, p = 7.96e-05) via one-way ANOVA.
Cohen’s d for height differences between medieval England and contemporary Britain was −0.477, with a range of −0.703 to −0.251.
Height PGS was calculated for all cultural groups, excluding groups with fewer than 10 individuals (N < 10). To address small sample sizes, neighboring populations were merged (e.g., Etruscans and Republican Rome into Iron Age Italy; BA Scotland, BA England, and BA Wales into BA Britain).
This analysis indicated medieval Northwestern Europeans, particularly the Dutch, exhibited the highest height PGS, followed by English and Viking samples (Supplementary Figure S13). Conversely, European Neolithic farmers recorded the lowest height PGS.
EA3, EA4 and IQ by historical culture
An analysis of average PGS by historical culture was carried out for the three main cognitive PGSs (EA3, EA4, IQ). The overall rankings were quite similar, with lowest scores for hunter-gatherers, Neolithic Middle Easterners and Copper Age Iberians and highest for Iron Age and medieval Italy (Supplementary Figures S14, S15, S16). The same analysis was repeated for the other polygenic scores and the results are visualized in Supplementary Figures S17−S22.
Correlations between PGSs at the individual and group level (historical culture)
We computed the intercorrelations between all the PGSs at the individual level (Supplementary Figure S23).
The mean PGS for the traits were computed for each historical culture group and the group-level correlations were computed. These tended to have similar direction, but larger magnitude (Figure 12), than the individual-level correlations.

Figure 12. Correlation matrix showing genetic intercorrelations at the level of historical cultures.
Discussion
This study’s examination of PGSs across cognitive, psychiatric and physical traits reveals distinct temporal and ancestral influences.
In cognitive variables, a robust negative correlation with age was noted for EA3, IQ and SES, suggesting an evolutionary trend in these traits (Figure 3). The effect size for EA3 and EA4 was reduced by approximately 50% after accounting for ancestry but continued to be significant (β = −0.127 and −0.141, p < .001). The impact of genome age on IQ and SES was slightly less (−0.111) compared to EA after ancestry control, yet remained noteworthy.
The increase in cognitive PGSs was about 0.12 SDs per 1000 years, implying that 10,000 years ago the PGSs for cognitive abilities were about 1.2 SDs lower than they are today.
The scatterplot shows that the increase in EA and IQ PGS started around 20 Kya, whereas between 20 and 33 Kya there was no clear trend (Figure 4). The period between 20 and 33 Kya witnessed a decrease in human population density in Europe due to the expansion of the ice sheets, which reached the maximum extension about 20 Kya during the Last Glacial Maximum (LGM; Tallavaara et al, Reference Tallavaara, Luoto, Korhonen, Järvinen and Seppä2015). Subsequently, population density started increasing, and this would have initiated a cycle of gene-culture coevolution due to increased intergroup conflict and social complexity. Indeed, intergroup conflict in Europe during the Holocene has been shown to be density dependent, and to be the main cause of population booms and busts (Kondor et al., Reference Kondor, Bennett, Gronenborn, Antunes, Hoyer and Turchin2023).
This is reflected by the sharp increase in EA3, EA4 and IQ PGSs between the Upper Paleolithic and the Neolithic (Supplementary Figures S1, S2, S3). Hunter-gatherer ancestry (particularly V2 or WHG) was negatively associated with EA3, EA4 and IQ in the regression models (Supplementary Tables S1−S3) even after accounting for Years BP (β = -0.314, -0.4, -0.249), suggesting that the increase in cognitive capacity was not solely driven by the Neolithic revolution but was partly mediated by admixture with the immigrants that accompanied it. Anatolian Neolithic farmers who intermixed with native HGs contributed between approximately 40% and 98% of Neolithic European ancestry (Chintalapati et al., Reference Chintalapati, Patterson and Moorjani2022). Near-Eastern ancestry (V4) had a similar negative effect on the three phenotypes (−0.31, −0.88 and −0.313).
In the regression model (Supplementary Tables S1−S3), Anatolian/European farmer ancestry (V5) positively predicted EA3, EA4 and IQ PGS. As V5 was omitted from the regression to deal with multicollinearity, its effect was absorbed into the intercept, and all the other components had negative beta. The positive effect on EA and IQ was confirmed by re-running the regression analysis by including V5 and omitting each of the other four components in turn.
Psychiatric phenotypes displayed complex relationships with time, heavily influenced by ancestry. For example, the temporal changes in ASD and SCZ were not solely attributable to time but were significantly mediated by ancestral components. This implies that the temporal alterations in these PGSs are significantly influenced by authentic ancestry transitions or by the uneven representation of ancestries and geographical diversity in our sample. For instance, there was a higher representation of Northern European samples during the Middle Ages and Southern European samples during the Neolithic period.
Shifts in ancestry can underlie authentic alterations in phenotype risk if the new genetic variants introduced into a population alter the inherent risk or manifestation of certain traits or conditions. For example, populations from regions with varying sunlight exposure (e.g., closer to the equator vs. farther away) have different skin pigmentation due to the differential selective pressures of UV light exposure. If these populations mix, the resulting generations might exhibit a wider range of skin pigmentation due to the blending of genes influencing this trait and a different average skin darkness.
Conversely, if the GWAS did not fully account for potential population stratification (especially that mediated by environmental factors), the observed associations between certain genetic markers and traits or disease might be misleading or confounded. This is because the genetic differences might be coincidentally associated with the trait or disease due to the unaccounted-for environmental factors rather than having a direct biological connection.
Theoretically, if a PGS for a trait increases over time, and the ancestry is related to the trait independently of environmental biases in the GWAS, this indicates a genuine change in genetic predisposition even if the association with time is entirely mediated by ancestry. However, selection still cannot be ruled out, because ancestry shifts might indicate that individuals belonging to a particular ancestry were favored in certain environments because of different genetic predisposition to some advantageous trait.
Middle Eastern ancestry (V4) positively predicted the schizophrenia and neuroticism PGS (Supplementary Tables S5 and S7) in the regression models but negatively predicted autism PGS (Supplementary Table S4).
Intriguingly, schizophrenia and autism demonstrated divergent temporal trends, aligning with the theory that these disorders embody opposite ends of the psychological spectrum (Crespi et al., Reference Crespi, Stead and Elliot2010). Furthermore, their correlation with Years BP aligned with pleiotropic impacts on cognitive abilities, given that schizophrenia and autism present reciprocal genetic correlations to IQ.
Lastly, inclinations towards psychotic tendencies may have been advantageous in traditional societies where mystical beliefs and hallucinations were often considered normative, in contrast to contemporary societies that demand heightened concentration and specialization, thereby prioritizing autistic traits.
The presence of contrasting selection pressures on schizophrenia and autism is also hinted at by the inverse effects of latitude (β = −0.187 and 0.05 respectively). This suggests that a colder climate might have favored a higher genetic predisposition towards autism while simultaneously selecting against a risk for schizophrenia.
Both neuroticism and depression PGSs have demonstrated a decline over time, consistent with their substantial genetic and phenotypic correlation. The observed trend may also be attributed to pleiotropic effects on intelligence, which bears a weak, yet negative, relationship with both neuroticism and depression.
The correlations observed at individual (Supplementary Figure S1) and temporal levels aligned with expectations from existing literature. Group-level correlations for PGSs had a similar direction but were more pronounced (Figure 12). This perspective sheds light on the potential shared or contrasting selective pressures on various phenotypes.
Autism exhibited a significant positive correlation with EA3 and EA4 (.59 and .68 respectively), contrasting with a substantial negative correlation with schizophrenia (−.83). This supports the hypothesis that schizophrenia and autism are at different extremes of the psychological spectrum (Crespi & Badcock, Reference Crespi and Badcock2008; Crespi et al., Reference Crespi, Stead and Elliot2010), possibly representing divergent cognitive-behavioral adaptation strategies in socio-cultural environments. The positive link between autism and cognition corroborates previous findings of a genetic correlation at the individual level (Grove et al., Reference Grove, Ripke, Als, Mattheisen, Walters, Won, Pallesen, Agerbo, Andreassen, Anney, Awashti, Belliveau, Bettella, Buxbaum, Bybjerg-Grauholm, Bækvad-Hansen, Cerrato, Chambert, Christensen, Churchhouse and Børglum2019)].
In contrast, depression was negatively correlated with EA3, EA4 and height, but showed a positive correlation with schizophrenia (r = .42). This is consistent with the commonly observed negative genetic and phenotypic correlation between depression and cognition (Xu et al., Reference Xu, Sun, Ji, Tian, Duan, Zhai, Wang, Pang, Zhang, Zhao, Li, Hjelmborg, Christensen and Tan2015). EA3 and EA4 not only had a strong correlation with each other (r = .86) but also with IQ (r ∼ .8) and SES (r ∼ .75), while showing negative correlations with neuroticism (r ∼ −.65) and schizophrenia (r = −.55 and −.77 respectively). These findings reflect the positive association within populations between SES and intelligence (Trzaskowski et al., Reference Trzaskowski, Harlaar, Arden, Krapohl, Rimfeld, McMillan, Dale and Plomin2014) but the negative genetic correlations of cognition with neuroticism (Anglim et al., Reference Anglim, Dunlop, Wee, Horwood, Wood and Marty2022) and schizophrenia (Ohi et al., Reference Ohi, Sumiyoshi, Fujino, Yasuda, Yamamori, Fujimoto, Shiino, Sumiyoshi and Hashimoto2018). Interestingly, although EA shows a slight positive correlation with schizophrenia within populations, it negatively correlates with intelligence. This discrepancy indicates that EA3 and EA4 are more indicative of selective pressures on intelligence rather than on noncognitive skills related to EA.
An unexpected finding was the strong positive correlation between height and intracranial volume (.7), yet no significant correlation with IQ. However, this correlation between height and intracranial volume was anticipated, considering the established positive relationship between brain and body size across and within species (Grabowski, Reference Grabowski2016).
In general, we identified the most substantial discrepancies across phenotypes between the Upper Paleolithic and Neolithic periods, likely attributable to the profound cultural and lifestyle shifts occurring between these two epochs. According to the model outlined in the introduction, the Neolithic Revolution, marking the transition from hunter-gatherer ways of life to agriculture-centered settlements, initiated a surge in population density, escalated social complexity, and necessitated enhanced planning and organization. Consequently, cognition underwent selection to navigate the intricacies of labor division, specialization, and the hurdles of social competition and collaboration. A significant ‘leap’ in the PGSs for EA and IQ was also observed between the Bronze Age and the Iron Age, hinting at a period of selection favoring sophisticated cognitive abilities.
The research findings support the weak hypothesis of Clark’s model, highlighting a distinct rise in the genetic predispositions for traits associated with intelligence and EA across Europe after the Middle Ages. When PGSs for cognitive phenotypes were analyzed within the context of Great Britain — by contrasting English medieval genomes with their modern British counterparts — the effect sizes (denoted through Cohen’s d) were either comparable or slightly reduced relative to the overall sample, ranging from d = 0.15 to 0.5 (Figure 11). Hence, Clark’s strong hypothesis — that the increase was more pronounced in Britain than elsewhere — is not supported by the analyzed dataset.
Our study included an analysis of a subsample consisting of 767 individuals from Southeastern Europe and Anatolia, specifically concentrating on two primary cognitive PGSs: EA3 and EA4. We observed a significant negative correlation between EA3 and Years BP, with a correlation coefficient of −.185 (p = 2.644e-07), as illustrated in Supplementary Figure S11. This suggests an increase in EA3 over time. Regression analysis, considering the first 10 PCs and sequence coverage, revealed a consistent effect of Years BP (β = −0.11), although the impact of sequence coverage alone was not significant (β = −0.04, p = .41).
Similarly, for EA4, a negative correlation with Years BP was noted (r = −.22), as depicted in Supplementary Figure S12. The regression analysis, adjusted for the first 10 PCs and sequence coverage, demonstrated a diminished yet significant effect (β = −0.11). This finding adds further support to the notion that polygenic selection influencing cognitive abilities extended beyond Northwestern Europe, encompassing regions of Western Asia and Southeastern Europe, thereby challenging the more stringent interpretation of Clark’s theory. While the impact of Years BP was slightly diminished in comparison to the total sample, a more robust inference about the differential in selection strength between these two regions would necessitate a larger sample size.
Our examination of key cognitive phenotypes (EA3, EA4, IQ) across historical cultures aligns with the patterns observed in ancestry and time-based analyses. The earliest samples, consisting of hunter-gatherers and those from the Middle East, had the lowest scores (Supplementary Figures S14, S15, S16). In contrast, samples from Iron Age and Medieval Italy showed the highest scores. This reinforces the conclusions of our recent study (Piffer et al., Reference Piffer, Dutton and Kirkegaard2023), which indicated that Europe’s PGSs reached their zenith in central Italy during the Republican era. Additionally, incorporating a new Etruscan sample (N = 48), genetically akin to the Republican Romans as per Posth et al. (Reference Posth, Zaro, Spyrou, Vai, Gnecchi-Ruscone, Modi, Peltzer, Mötsch, Nägele, Vågene, Nelson, Radzevičiūtė, Freund, Bondioli, Cappuccini, Frenzel, Pacciani, Boschin, Capecchi, Martini and Krause2021), into our Iron Age Italian dataset, further corroborates these results.
A significant divergence was noted in the sample of ancient Greeks from the Bronze Age in the comparison between IQ and EA. The Bronze Age Greeks, while displaying average scores on EA, manifested the highest scores in IQ PGS. This result was predicted based on their renowned cultural accomplishments and is in agreement with the historical estimates by Galton (Galton, Reference Galton1869). The marked disparity between the EA and IQ PGS among ancient Greeks merits additional research for a deeper understanding.
The analysis of physical traits, such as height, highlighted the influence of environmental factors, as shown by the positive effect of latitude on the height PGS (β = 0.5) in the regression model (Supplementary Table S9). This aligns with Bergmann’s rule, suggesting adaptations to varying climatic conditions. However, as shown in Supplementary Table S9, the impact of Years BP was reduced when controlling for ancestry (from β = −0.306 to −0.095).
Notably, a decline in height PGS was observed from the Paleolithic to the Neolithic periods, implying that the post-agricultural revolution reduction in body size could be attributed not only to dietary limitations and heightened prevalence of diseases (Mummert et al., Reference Mummert, Esche, Robinson and Armelagos2011), but also to genetic factors. We found a positive impact of EHG ancestry on the height PGS (β = 0.93). This result replicates the finding that differences in height between contemporary northern and southern Europeans are due to different amounts of Steppe ancestry (which is used as a proxy for EHG) rather than selection (Irving-Pease et al., Reference Irving-Pease, Refoyo-Martínez, Barrie, Ingason, Pearson, Fischer, Sjögren, Halgren, Macleod, Demeter, Henriksen, Vimala, McColl, Vaughn, Speidel, Stern, Scorrano, Ramsøe and Schork2024).
Indeed, polygenic height scores achieved their highest levels in medieval Dutch, English and Viking populations (Supplementary Figure S13). In contrast, contemporary British samples exhibited lower polygenic height scores compared to their medieval English counterparts. This observation raises two plausible interpretations: either there has been negative selection against height since the Middle Ages, or the ancestral composition of the medieval sample leaned more towards continental ancestry, resembling the Dutch and Scandinavian populations.
The latter scenario gains further support from the context in which the samples were collected — a research initiative primarily centered around Anglo-Saxon cemeteries aimed at investigating the extent of continental migration to England, as detailed in the study by Gretzinger et al. (Reference Gretzinger, Sayer, Justeau, Altena, Pala, Dulias, Edwards, Jodoin, Lacher, Sabin, Vågene, Haak, Ebenesersdóttir, Moore, Radzeviciute, Schmidt, Brace, Bager, Patterson, Papac and Schiffels2022). Their findings indicate that continental (‘Anglo-Saxon’) ancestry started spreading during the early Middle Ages but later blended with the pre-existing ‘Celtic’ or native genetic pool, resulting in a dilution of its genetic influence (Gretzinger et al., Reference Gretzinger, Sayer, Justeau, Altena, Pala, Dulias, Edwards, Jodoin, Lacher, Sabin, Vågene, Haak, Ebenesersdóttir, Moore, Radzeviciute, Schmidt, Brace, Bager, Patterson, Papac and Schiffels2022). Hence, the decrease in continental ancestry inferred by the study is likely due to a mix of genuine change in ancestry within England and the oversampling of cemeteries with continental ancestry. In turn, the decrease in continental ancestry is likely the cause of the observed decline in the height PGS for England.
Notably, in contemporary times, the Dutch population holds the distinction of being the tallest globally, and at the very least, within Europe. This observation lends credence to the notion that their genetic inclination towards greater height was already pronounced during medieval periods. As an intriguing historical anecdote, Dante, in the Divina Commedia (canto XXXI), poetically illustrates this height differential by noting that even when stacked three Friesians (‘frisoni’, from a region in the northern Netherlands) on top of one another, they could not reach the towering stature of the giant Nembrot.
Consequently, the significant increase (around 20 cm) in height among the Dutch over the last 200 years is likely attributable to environmental factors rather than natural selection, as outlined by Stulp et al. in their Reference Stulp, Bonnell and Barrett2023 study.
Intriguingly, we observed a reduction in the intracranial volume PGS from the Middle Ages to the contemporary period.
There was also a decrease (Cohen’s d = −0.42) from the Upper Paleolithic to the Neolithic period (Supplementary Figure S10). This fits the archaeological record of a reduction in cranial capacity during the transition from the Pleistocene to the Holocene (Stibel, Reference Stibel2021). This effect is likely driven by the decrease in body size during the Holocene transition, as Height and ICV were strongly correlated at the group level (Figure 12).
A significant decrease in ICV PGS was observed between the medieval and the contemporary sample (Cohen’s d = −0.17). This is in line with the brain size reduction over the last 3000 years reconstructed from fossil data (Stibel, Reference Stibel2021). Importantly, these findings show that the reduction in cranial capacity was not due to a reduction in the genotypic intelligence, as the IQ and EA PGS had the largest increases at the Pleistocene-Holocene and Medieval-Contemporary transitions. Regression models showed that the trajectory of ICV was largely determined by pleiotropic effects, primarily from EA4 and Height (see Supplementary information).
Consequently, these findings underscore the limitations of using cranial size in archaeological studies as a sole measure for tracking changes in complex cognition throughout recent evolutionary history.
Indeed, the temporal changes observed in several traits appear to be influenced more by pleiotropic effects resulting from selection on other traits than from direct selection effects (Suppl. info). Specifically, changes in ASD over time were shaped by common selective pressures on EA4 and SCZ. Evolutionary changes in Neuroticism are also best explained by pleiotropic effects from multiple traits, such as Depression, EA4 and SCZ. The changes in SCZ over time are attributed to pleiotropic effects from traits like ASD, Depression, EA3, EA4, Height and Neuroticism. Conversely, traits like EA3, EA4 and Height showed evidence of direct selection over time.
Admittedly, the persistence of an effect after accounting for the other traits depends on the amount of signal of each PGS. In fact, EA3, EA4 and Height were based on the largest GWAS and likely contain more signal than the other traits.
Collectively, these findings emphasize the intricate nature of evolutionary patterns, suggesting that trait changes over time can be shaped not just by direct selection effects but also by pleiotropic effects.
However, the data do not support the cold winters theory of intelligence (Lynn, Reference Lynn1991, Reference Lynn2006), as the effect of latitude on EA3 and IQ in the regression models (Supplementary Tables S1 and S3) tended to be slightly negative (β = −0.055 and −0.097, p = .022 and p < .001 respectively), contrary to the theory’s prediction. This implies that, at least within the temperate zone from which our samples were derived (30.64 to 69.65°), and within the last 12,000 years, climate did not exert a discernible selective pressure. Indeed, Eastern Hunter Gatherer ancestry, which derived up to 70% of ancestry from Ancient North Eurasians living in the extremely cold climates of Siberia (Posth et al., Reference Posth, Yu, Ghalichi, Rougier, Crevecoeur, Huang, Ringbauer, Rohrlach, Nägele, Villalba-Mouco, Radzeviciute, Ferraz, Stoessel, Tukhbatova, Drucker, Lari, Modi, Vai, Saupe, Scheib and Krause2023), was a negative predictor of EA or IQ in the regressions. It is possible that any selective pressure on intelligence from challenging natural environments was offset by the difficulties in forming complex, highly populated societies in ancient times, thereby disabling the gene-culture coevolutionary mechanism that appears to have accompanied humans over the last 12,000 years.
Our results underscore the complex interplay between genetic predispositions and environmental factors. For instance, the shift in height PGS from the Paleolithic to the Neolithic period suggests genetic adaptations alongside dietary and lifestyle changes.
The observed shifts in PGSs during key historical periods, such as the Neolithic Revolution and before the Industrial Revolution, align with major cultural and societal transformations. These findings provide empirical support for theories of gene-culture coevolution, particularly in cognitive traits.
While our study provides significant insights, it has limitations, such as potential biases in sample representation. Future research could focus on more diverse populations to further elucidate the genetic underpinnings of these traits.
Ascertainment bias, especially regarding traits tied to social status or intelligence, stems from the nonrandom selection of samples available for analysis. This bias can significantly distort our understanding of ancient populations and the prevalence or distribution of certain genetic traits, such as height, EA and IQ.
Burial practices often varied significantly across different cultures and historical periods, with certain individuals more likely to be preserved and discovered, based on their social status, wealth or other societal factors. High-status individuals might have been buried in ways that better preserve their remains (e.g., in tombs or with goods that deter grave robbers), making their genomes more accessible to researchers. This can lead to an overrepresentation of the genetics of the elite in ancient DNA studies.
There is also a tendency for research to focus on sites and samples that are more accessible or better preserved, which might not be representative of the broader ancient population. This can lead to a form of ascertainment bias where the conclusions drawn from such studies disproportionately reflect the genetics of specific subgroups.
Another potential source of significant biases is the practice of cremation. In cultures where cremation was preferred, the high temperatures effectively destroy organic material, including DNA, making it impossible to recover genetic information from cremated remains. This practice contrasts with burial, where DNA can be preserved for thousands of years under the right conditions.
This variation can lead to a form of bias in ancient DNA studies, as the genetic information accessible to researchers may disproportionately represent cultures or subpopulations that favored burial. Moreover, if cremation practices varied by social status or religion within each society, this would represent another source of bias.
Among ancient Greeks, lavish cremations and ceremonies were common, with famous examples like Achilles and Hector from the Iliad illustrating the elaborate nature of these rites. Following the Greeks, the Romans adopted cremation, especially for their military heroes. Cremation became a status symbol in Rome, where urns containing ashes were placed in columbaria (Borbonus, Reference Borbonus2019; Hope, Reference Hope2007; Pearce et al., Reference Pearce, Millett and Struck2000).
However, around 100 CE, cremation practices declined, partly due to the spread of Christianity. Cremation could have introduced bias also in the representativeness of our large Viking sample, as this practice was particularly common, especially during the early Viking age.
Furthermore, although our total sample size was relatively large (N = 2625), the sample size for some historical periods (e.g., Paleolithic, Imperial) lacked the power to detect significant effects.
Additionally, our analysis did not incorporate gene-environment interactions. Notably, allele effects on traits may vary temporally, such that certain alleles contributing to a trait’s risk in ancestral environments may not have the same impact in contemporary contexts. While this phenomenon is well documented in Mendelian diseases (e.g., the interaction of PKU with diet, the MAOA gene with childhood maltreatment, and sickle cell anemia with malaria exposure), detecting similar effects in polygenic traits is more challenging due to the involvement of numerous genetic loci, each exerting minor influences. A reviewer hypothesized that such gene-environment interactions might falsely appear as an increase in the PGS for EA over time, resulting from the loss of alleles that were advantageous in historical environments but are no longer beneficial. It is also important to consider that alleles associated with enhanced cognitive abilities in ancient times may still be advantageous in modern environments. This is because the underlying structure of general intelligence has been shown to predict success in a wide range of activities, from physical fitness to academic achievement (Gil-Espinosa et al., Reference Gil-Espinosa, Chillón, Fernández-García and Cadenas-Sanchez2020; Plomin & Deary, Reference Plomin and Deary2015).
Furthermore, extending this hypothesis to other traits we analyzed, one might expect a uniform rise in PGS across all traits. However, our results indicated a decrease in PGS for traits such as neuroticism, depression and schizophrenia, pointing to a more complex evolutionary narrative than the one suggested. For instance, assuming the GWAS identified schizophrenia risk alleles relevant predominantly in contemporary settings, one would predict lower schizophrenia PGS in ancient samples, reflecting the loss of these risk alleles in modern populations. Contrary to this expectation, we observed an elevated schizophrenia PGS in ancient samples, a trend paralleled in neuroticism and depression.
It is crucial to recognize that GWAS identify both positive and negative genetic correlations with traits. These findings are integrated into the calculation of PGS, which aggregates the varied impacts of genetic variants, both augmenting and diminishing the trait, weighted by their respective effect sizes. If alleles that increase a trait’s likelihood diminish in influence in ancient populations, the same principle should apply to alleles that decrease the trait’s likelihood. Ideally, these contrasting effects should neutralize each other, maintaining a balance in the PGS across different time periods.
In conclusion, our study highlights the intricate nature of genetic evolution, influenced by cultural, societal, and environmental factors. It affirms the weak hypothesis of Clark’s model, showing a notable increase in genetic predispositions for intelligence and EA across Europe post-Middle Ages. These insights contribute to our understanding of human evolutionary dynamics over the last several millennia
Supplementary materials
The following supporting information can be downloaded at: https://doi.org/10.1017/thg.2024.8
Data availability statement
Genomes utilized in this study in .BAM or .FASTQ format were downloaded from the ENA using the following accession numbers: PRJEB23635, PRJEB50940, PRJEB51862, PRJEB56216, PRJEB37976, PRJEB31249, PRJEB42866, PRJEB54831, PRJEB32566, PRJEB54899, PRJEB61818.
Author contributions
Conceptualization, D.P.; methodology, D.P.; software, D.P.; validation, D.P., E.K. ; formal analysis, D.P.; investigation, D.P.; resources, D.P.; data curation, D.P.; writing—original draft preparation, D.P.; writing—review and editing, D.P., E.K.; visualization, D.P.; supervision, E.K.; project administration, E.K. All authors have read and agreed to the published version of the manuscript.
Funding
This research received no external funding.
Competing interests
The authors declare no conflict of interest.
Institutional Review Board Statement
Not applicable.
Informed consent statement
Not applicable.