Nutritional intake is considered to play a decisive role in the development of a number of major chronic diseases, such as adiposity, diabetes mellitus, CVD and cancer. Recently, interest in nutritional intake during childhood as a determinant of these diseases has increased. Valid assessment of nutritional intake in periods potentially critical for later diseases, i.e. in early childhood, mid-childhood and puberty, is thus a major challenge. Methods proven to be valid for assessing nutritional intake in adults may not, however, necessarily be valid for use in children and adolescents, since their food choice could be particularly prone to fluctuation. Furthermore, the validity of these assessment tools may vary by age and sex or change over the course of time(Reference Mensink and Burger1–Reference Sichert-Hellert, Kersting and Schoch4). Adolescents are assumed to provide less accurate reports of their nutritional intake and/or may not be fully aware of their dietary intake, whereas parental reports of nutritional intake in younger children may be more valid. Furthermore, it has been suggested that girls are more prone to under-reporting their food intake than boys(Reference Bandini, Must and Cyr5). Also, recent trends among adolescents to increase fast-food consumption and eat out may no longer be adequately reflected by commonly used assessment tools(Reference Mensink and Burger1). Finally, the increasing variation in foods offered may not be validly considered(Reference Mensink and Burger1). Thus, even weighed dietary records – commonly regarded a quasi gold standard in nutrition assessment – require validation for their use in children and adolescents.
In the absence of an assessment tool capable of estimating ‘true’ intake, biomarkers are increasingly recognised as best practice to assess absolute validity(Reference Bingham6). Until now, particularly urinary-N excretion as a recovery biomarker for protein intake has rarely been used among children and adolescents in nutritional studies. Some have applied the method of doubly labelled water in order to examine the validity of energy intake(Reference Bandini, Must and Cyr5). The use of the biomarker urinary-N excretion, however, may yield additional information about the validity of dietary records beyond absolute dietary intake. In the contemporary Dortmund Nutritional and Longitudinally Designed (DONALD) Study, 24 h urine samples are routinely collected on the third day of a 3 d weighed dietary record. Thus, the study offers the potential to validate nutritional intake against a urinary biomarker in a large population of boys and girls with a wide age range.
The present study assessed the validity of dietary protein intake recorded on the third day of a 3 d weighed dietary record against the protein intake estimated from simultaneously collected 24 h urine samples. Among the DONALD participants, 439 males and females from four different age groups, representing early childhood, mid-childhood and puberty as well as young adulthood (for comparative purposes), were selected to examine whether the validity was related to age or sex.
Subjects and methods
Study population
The DONALD Study is an ongoing, open cohort study that was started in 1985 in the area of Dortmund, Germany. Details of the study design have been published previously(Reference Kroke, Manz and Kersting7). In brief, on average forty to fifty healthy infants are newly recruited each year and are first examined at the age of 3–6 months. Detailed data on nutrition, growth, metabolism and health status are collected at regular intervals between infancy and young adulthood. The study was approved by the Ethics Committee of the University of Bonn, and all assessments are performed with parental consent.
Eligible were all children, adolescents and young adults who had provided both a 3 d weighed dietary record and a 24 h urine collection on the third day of recording. Their urine collections had to be complete and a measurement of urinary-N had to be available. Micturitions with time of collection <20 h were rejected. Completeness was verified by excretion of creatinine in urine(Reference Remer, Neubert and Maser-Gluth8). For the purpose of the current analysis children and adolescents were selected who had these data available at ages 3–4, 7–8, 11–13 or 18–23 years. From the final data set comprising 439 participants, one set of records and urine was selected for each person. Distribution of the participants across the age groups is given in Table 1.
Table 1 General characteristics of the DONALD study sample (n 439)
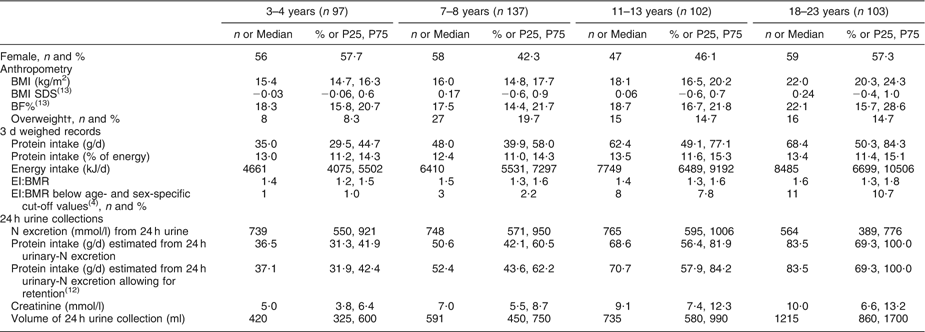
DONALD, Dortmund Nutritional and Longitudinally Designed; P25, 25th percentile; P75, 75th percentile; SDS, standard deviation score; BF%, percentage of body fat; EI, energy intake.
Values are presented as n and % as indicated; or median and P25, P75.
†According to the International Obesity Taskforce.
Nutritional assessment
In the DONALD Study, dietary intake is assessed by 3 d weighed dietary records. Parents are asked to weigh all foods and beverages consumed by their children, including leftovers, to the nearest 1 g over three consecutive days with the help of regularly calibrated electronic food scales (initially Soehnle Digita 8000, Leifheit SG, Nassau, Germany; now WEDO digi 2000, Werner Dorsch GmbH, Muenster/Dieburg, Germany). Parents are instructed by trained dietitians and semi-quantitative recording using household measures (e.g. number of spoons, scoops) is allowed when exact weighing is not possible. Information on recipes or the types and brands of food items is also requested. The dietary records are analysed using the continuously updated in-house nutrient database LEBTAB(Reference Sichert-Hellert, Kersting and Chada9), which is based on information from standard nutrient tables, product labels or recipe simulations based on the labelled ingredients and nutrients.
Urine sampling and urine analysis
Starting at the children’s age of 3 years, annual 24 h urine collections are routinely performed on the third day of the 3 d weighed dietary record. Parents and children are instructed personally and in written form on how to collect complete 24 h urine samples. The first micturition in the morning on the third day of recording is discarded. Parents and children register the time of micturition, thereby defining the start of the 24 h collection which ends with the first micturition of the following morning. All micturitions are stored immediately in Extran-cleaned, preservative-free (Extran MA 03; Merck, Darmstadt, Germany) 1-litre plastic containers at ≤−12°C before being transported to the Research Institute. A dietitian picks up the urine sample, asks parents and children about the completeness of the urine samples and possible influences on urine collection, and records this information on the protocol sheet. At the institute, the containers are stored at ≤−20°C before being analysed. All urine samples undergo routine check using a commercial test strip after thawing and stirring. Volume, pH, osmolarity and creatinine are determined. Completeness of urine is ascertained via values of creatinine, based on sex- and age-specific body-weight-related reference values of creatinine for the age groups of 3, 4–5, 6–8, 9–13 and 14–18 years. Hence collection-related errors are identified(Reference Remer, Neubert and Maser-Gluth8).
For the present study, N in urine was measured by the method of Kjeldahl (model 430 Digestor and model B-324 Distillation Unit; Buechi, Flawil, Switzerland) and concentration was obtained by relating N levels to the volume of the 24 h collections (Table 1: N excretion mmol/l from 24 h urine). To obtain protein intake estimated from the urine, the assumption was made that excreted N accounts for 80 % of the ingested protein due to extra-renal N losses(Reference Bingham6). Thus, excreted N (mmol/l) was converted to g protein/d (protein g/d = (N g/d × 6·25 × 14)/1000) and then divided by 0·8 (Table 1: protein intake estimated from 24 h urinary-N excretion)(Reference Bingham6, Reference Gibson10). In a further step, an age- and sex-specific reference value for protein requirements for growth was added to allow for protein retention during growth in the paediatric age groups (Table 1: protein intake estimated from 24 h urinary-N excretion allowing for retention)(Reference Garlick11).
Anthropometry and parental data
Body weight is assessed to the nearest 100 g with an electronic scale, height to the nearest 0·1 cm and skinfold thickness to the nearest 0·1 mm. For each child, age- and sex-independent standard deviation scores (SDS) of weight, height and BMI were calculated using the German reference curves(Reference Kromeyer-Hauschild, Wabitsch and Kunze12). Percentage of body fat was calculated using Deurenberg’s equations(Reference Deurenberg, Pieters and Hautvast13). The proportion of overweight children was assessed according to the definitions of the International Obesity Taskforce, which correspond to a cut-off of 25 kg/m2 in adults(Reference Cole, Bellizzi and Flegal14). On a child’s entry to the study, parents are asked to provide information about family characteristics, their educational status and employment, and their weight and height are measured by the same trained nurses who assess the anthropometrics of the participating children.
Statistical analysis
For the present analyses, we used only dietary data recorded on the day when the urine sample was collected, since we expect the protein in the 24 h urine (comprising all excretions until the following morning) to reflect mainly the protein ingested during this day. For comparative purposes, agreement was also assessed by relating protein estimated from the urine to the mean protein intakes derived from all three days of recording.
Descriptive statistics of the study sample are presented as medians with the 25th and 75th percentile, since some variables were not normally distributed. To test for any interaction with age or sex we used linear regression models with protein intake estimated from 24 h urine as the dependent variable and dietary protein intake, age group and sex as independent variables. Analyses indicated a significant interaction with age group only (P values for interactions: 0·02), hence all analyses were performed for the total sample as well as for the four age groups.
Mean differences and standard deviations were calculated to allow conclusions on a group level about the absolute extent of over- or underestimation of protein intake by the weighed diet records. Relative median differences (ratio of mean difference and protein intake estimated from 24 h urine × 100) permitted a direct comparison of the degree of over- or underestimation across the age groups. Pearson correlation coefficients were calculated using both crude and energy-adjusted data(Reference Willett and Stampfer15) from dietary records. By means of cross-classification, we computed the percentage of persons who were classified into either the same or the adjacent quartile of protein intake by both methods or misclassified into the opposite quartile(Reference Gibson10). Again, cross-classification was performed using both crude and energy-adjusted values(Reference Willett and Stampfer15) from weighed dietary records. Bland–Altman plots were used to illustrate the difference between the two methods against the mean of the two methods. The horizontal dashed line indicates the mean of the differences. The upper and lower dotted lines represent the upper and lower 95 % limits of agreement, which should comprise 95 % of the values in the range of the twofold standard deviation (1·96 × sd) of the mean differences (d ± 1.96 × sd). Ideally, mean difference between the methods would be zero with no discernable bias, i.e. the mean differences would cluster on the horizontal continuous line of equality (y = 0). Any deviation of the mean difference line from the line of equality indicates a bias. Moreover, any systematic variation of the differences in protein intake across the range of protein intakes suggests the presence of an additional systematic in the bias, which would provide further evidence of a limited agreement between the methods(Reference Bland and Altman16–Reference Grouven, Bender and Ziegler18). As proposed by Bland and Altman, log-transformation of the data for the whole study group was performed to control for such systematic increases or decreases in the variation(Reference Bland and Altman17).
Energy adjustment was carried out using the residual method(Reference Willett and Stampfer15). We further calculated the ratio of energy intake to BMR and applied age- and sex-specific cut-off-points in order to assess potential under-reporting of energy intake(Reference Sichert-Hellert, Kersting and Schoch4).
All statistical analyses were carried out using the SAS statistical software package version 8·2 (SAS Institute Inc., Cary, NC, USA), and a P value of <0·05 was considered statistically significant.
Results
Table 1 gives the general characteristics of the study sample. Protein intakes recorded from the weighed dietary records were generally lower than protein intakes estimated from 24 h urines, regardless of whether protein retention was accounted for. The percentage of under-reported energy intake, based on age- and sex-specific cut-off-values(Reference Sichert-Hellert, Kersting and Schoch4), ranged from 1 % in children aged 3–4 years to 11 % in young adults aged 18–23 years. The BMI SDS close to zero indicates that the BMI of the present sample was comparable to that of the German reference population(Reference Kromeyer-Hauschild, Wabitsch and Kunze12). Overweight prevalence ranged from 8 to 20 % in the study participants, while 23–36 % had an overweight mother. The sample was characterised by a high parental educational level.
Table 2 gives the results of the validity analyses. Protein intake according to weighed dietary records was underestimated by −6·4 (95 % CI −8·2, −4·7) g/d, which corresponded to a relative median difference of −10·5 %. Mean differences increased across age groups, both absolutely and relatively. Pearson correlation coefficients for the total study sample were r = 0·70 (P < 0·0001) using crude data and r = 0·30 (P < 0·0001) for energy-adjusted data, with the corresponding correlation coefficients ranging from r = 0·30 to 0·59 across the age groups. Concerning cross-classification, over 80 % of the participants in the total sample and in the different age groups were classified into the same or adjacent category using crude protein intake data, whereas classifications with energy-adjusted protein intake data indicated slightly lower agreement between the methods (77–83 %). Misclassification into the opposite quartile was ≤5 % in the total study group and all age groups for both crude and energy-adjusted data.
Table 2 Agreement between protein intake estimated from one day of a weighed dietary record and protein intake estimated from 24 h urinary-N excretion: differences; Pearson correlation coefficients and cross-classifications for agreement (n 439)
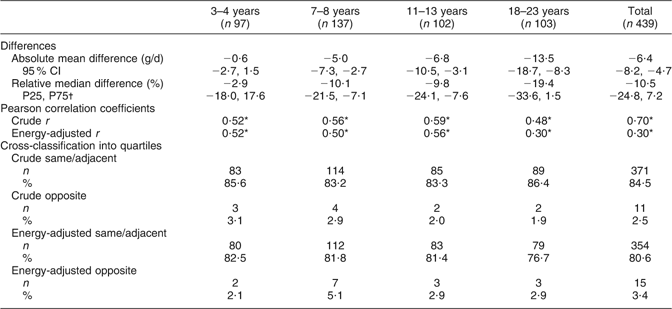
P25, 25th percentile; P75, 75th percentile.
*P < 0·0001.
†The relative mean difference was not normally distributed and is thus presented as relative median difference.
The Bland–Altman plot for the total study sample indicated that differences in protein intake were scattered and increased across the range of protein intake. The limits of agreement comprised less than 95 % of the values (Fig. 1). Mean log-transformed protein intake (g/d) plotted against differences of log-transformed protein intake (g/d) for the total group (Fig. 2) removed the increase in variation, hence confirming the presence of a systematic bias for the total group. However, this increase in variation appeared to result from an age-related increase in differences between the two methods, since age-specific Bland–Altman plots did not confirm such an obvious bias (Figs 3(a) to (d)).
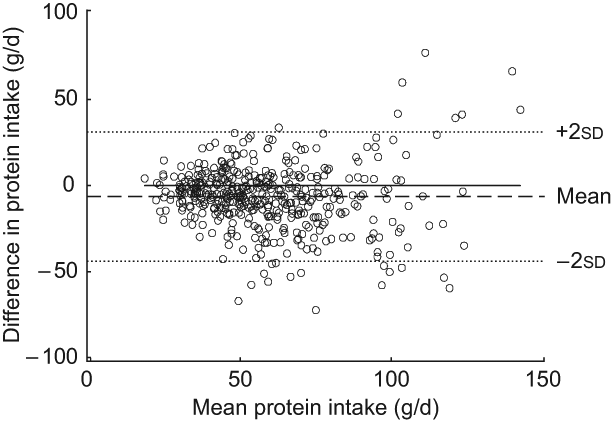
Fig. 1 Bland–Altman plot for the total study group. The difference between protein intake (g/d) calculated from a weighed dietary record (test method) and protein intake level (g/d) estimated from 24 h urinary-N excretion (reference method) for each person (y-axis) is plotted against the mean protein intake averaged from the two methods (x-axis). Data are presented for the total study sample (n 439). The horizontal solid line (y = 0) represents ideal agreement, where the differences between methods are zero; the horizontal dashed line indicates the mean of the differences; the upper and lower dotted lines show the upper and lower 95 % limit of agreement, respectively, presented as twofold standard deviations (±1.96 × sd)
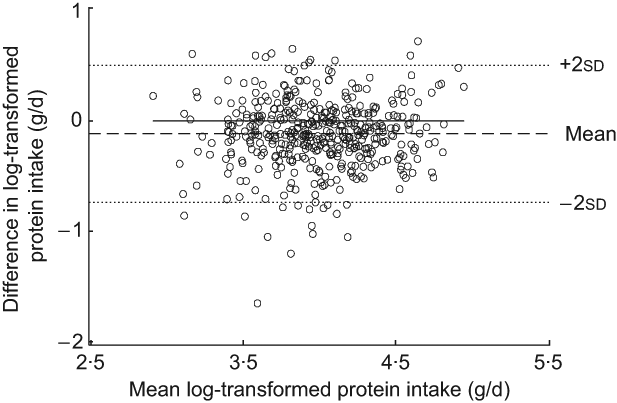
Fig. 2 Bland–Altman plot of log-transformed data for the total study group. The difference between log-transformed protein intake (g/d) calculated from a weighed dietary record (test method) and log-transformed protein intake level (g/d) estimated from 24 h urinary-N excretion (reference method) for each person (y-axis) is plotted against the mean of log-transformed protein intake averaged from the two methods (x-axis). Data are presented for the total study sample (n 439). The horizontal solid line (y = 0) represents ideal agreement, where the differences between methods are zero; the horizontal dashed line indicates the mean of the differences; the upper and lower dotted lines show the upper and lower 95 % limit of agreement, respectively, presented as twofold standard deviations (±1·96 × sd)
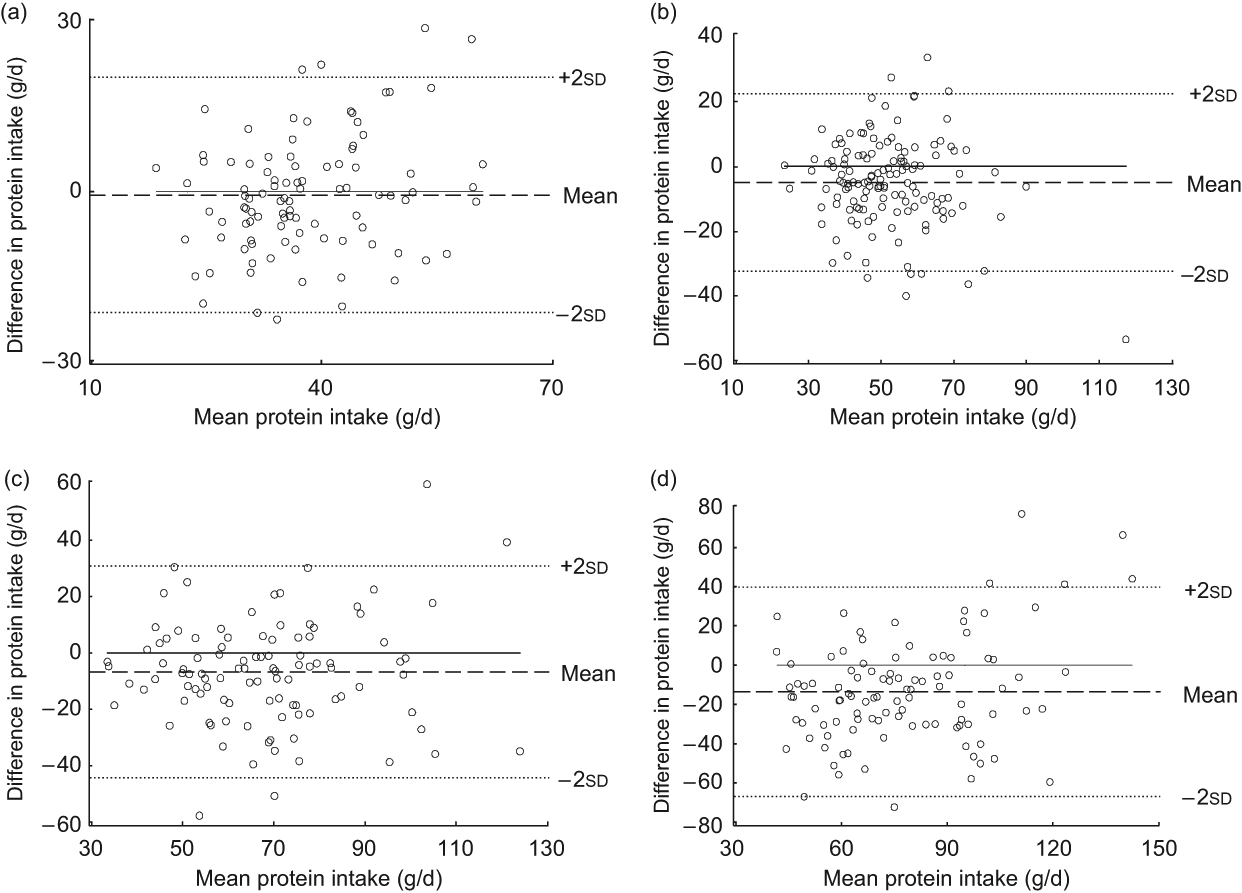
Fig. 3 Bland–Altman plots for different age groups. The difference between protein intake calculated from a weighed dietary record (test method) and protein intake level estimated from 24 h urinary-N excretion (reference method) for each person (y-axis) is plotted against the mean protein intake averaged from the two methods (x-axis). Data are presented for different age groups: (a) age 3–4 years (n 97); (b) age 7–8 years (n 137); (c) age 11–13 years (n 102); (d) age 18–23 years (n 103). The horizontal solid line (y = 0) represents ideal agreement, where the differences between methods are zero; the horizontal dashed line indicates the mean of the differences; the upper and lower dotted lines show the upper and lower 95 % limits of agreement, respectively, presented as twofold standard deviations (±1·96 × sd)
We repeated the analyses, comparing mean protein intakes from the complete 3 d dietary record with protein intake estimated from the urine. The mean difference for the total study sample was 0·6 (95 % CI −0·6, 1·9) g/d or −13 %, the correlation coefficient was r = 0·8 and both methods classified 91 % into the same/adjacent quartile for the whole study group and 1 % into the opposite. Bland–Altman plots were similar to those for the comparison based on the third day of recording only.
Discussion
The results of our study suggest a moderate overall validity of protein intake estimated from weighed dietary records in a large sample of healthy children, adolescents and young adults as evidenced from a comparison with urinary-N excretion levels as a biomarker. Agreement between the methods tended to be lower in older age groups.
To our knowledge, the present study is the first to validate protein intake reported from weighed dietary records against protein intake estimated from 24 h urine samples in a large sample of healthy children and adolescents. To date, validation studies in children and adolescents comparing protein intake from weighed dietary records to the recovery biomarker urinary-N excretion have been carried out only in children suffering from diabetes mellitus or renal insufficiency(Reference Hackett, Morton and McCowen19, Reference Wingen, Fabian-Bach and Mehls20). The scarcity of comparable studies in healthy children is probably due to the high level of compliance and considerable effort required from the children, adolescents and their parents for (repeated) 24 h urine collections. Furthermore, the positive N balance of growing children and adolescents represents a specific methodological challenge. Therefore, our study took advantage of an ongoing longitudinal study, while validation studies in adults were mostly experimental and especially designed to assess validity(Reference Bingham, Cassidy and Cole21–Reference Kroke, Klipstein-Grobusch and Voss23).
The overall level of validity in our study as evidenced from Pearson correlation coefficients and cross-classifications was higher than that seen in other studies with children(Reference Hackett, Morton and McCowen19, Reference Lietz, Barton and Longbottom24) and close to that found in experimental studies conducted in adults(Reference Bingham, Cassidy and Cole21, Reference Black, Welch and Bingham22). In the present study, weighed dietary records underestimated protein intake by −6 g/d or −11 %. The overall magnitude of underestimation appears acceptable; however, the limits of agreement ranged from +31 g to −44 g. Five per cent of the data were located beyond these limits. Our overall conclusion of an acceptable agreement is likely based on conservative estimations, since agreement was even higher when dietary records from all three days were considered, i.e. in a comparison including protein ingested and at least partly excreted before the urine collection was started.
Hackett et al. reported an overestimation of 2·9 g protein/d among 3–16-year-old participants with diabetes mellitus(Reference Hackett, Morton and McCowen19). Among comparable validation studies conducted in healthy adults, one reported a slight overestimation of protein intake by 1.31 g/d(Reference Black, Welch and Bingham22), while another study found an underestimation by 10 % when comparing protein intake assessed by weighed dietary records to urinary-N excretion levels(Reference Bingham, Cassidy and Cole21). Thus, published literature does so far not suggest an explicit tendency towards under- or overestimation of protein intake by weighed dietary records. Nevertheless, our results seem plausible, since various studies with different designs suggest that nutritional intake tends to be underestimated by a number of different nutrition assessment methods(Reference Livingstone and Black25). Under-reporting has been reported to occur especially among overweight persons and girls during puberty(Reference Sichert-Hellert, Kersting and Schoch4, Reference Bandini, Must and Cyr5). In the present study, we did not observe any sex differences in the association between protein intake reported in weighed dietary records and protein intake estimated from urinary-N excretion levels. On the other hand, we did observe a lower level of agreement between the methods in older age groups. Hackett et al. also reported age-related differences in validity comparable to our observations(Reference Hackett, Morton and McCowen19). Furthermore, in a study conducted in 10–15-year-old girls to validate energy intake assessed by dietary records against doubly labelled water, the authors arrived at the conclusion that the accuracy of the data obtained from dietary records was lower in older age groups(Reference Bandini, Must and Cyr5). The lower level of validity among adolescents could be due to a lower level of compliance in accurately weighing and recording all foods and beverages consumed or to the fact that adolescents tend to consume more foods away from home, which are estimated with a lower level of precision. In contrast, among younger children, nutritional intake was recorded by their parents, who are still relatively well informed about the nutritional intake of their children, thus potentially contributing to the observed higher validity.
The Bland–Altman plots underpinned this observation, indicating a tendency towards larger differences between the methods at higher levels of protein intake, which were largely observed in the adolescents and young adults. Consistent with this view, the Bland–Altman plots for each age group – i.e. with age-specific smaller overall ranges of protein intake – did not reveal additional systematic in the bias with higher protein intake levels. We therefore conclude that a moderate agreement in the absolute differences may be observed as long as single age groups are examined. By contrast, when large ranges of protein intake are considered (e.g. when examining a wide age range) intake levels estimated from weighed dietary records could be systematically biased.
Interestingly, in the present study, energy adjustment did not enhance validity. The number of participants with ‘implausible energy intake levels’, based on age- and sex-specific cut-off values, was rather low(Reference Sichert-Hellert, Kersting and Schoch4). Thus, energy adjustment may not improve validity of the dietary data in populations with largely plausible dietary records and should be challenged in further studies.
A particular strength of the present analysis lies in the use of different statistical methods to determine agreement. Pearson correlation coefficients indicate the size of correlation between the test and reference method and should thus only be used in combination with other validation methods to measure the extent of agreement between two methods. In cross-classification the percentage of agreement also comprises randomly originated agreements but this method is independent of the data distribution and potential artefacts resulting from statistics(Reference Block26). Furthermore, in nutritional epidemiology participants are commonly grouped by their intake level, thus supporting the relevance of conclusions drawn from cross-classification analyses. Finally, Bland–Altman plots enable assessment of the extent of variance in agreement and bias. Even though Bland–Altman plots are considered a gold standard in studies of methodical comparisons(Reference Grouven, Bender and Ziegler18), validation studies in nutritional epidemiology have only started to use this method during the past few years(Reference Cade, Burley and Warm27).
Finally, some limitations of our study need to be mentioned. While we were able to compare 24 h urine to 24 h diet records on the same day in a large sample of healthy children and adolescents we could not address intra-personal day-to-day variation in protein intake, since our results are based on a single 24 h urine collection. In our view this may have resulted in an underestimation of the ‘true’ validity as indicated by the fact that agreement was already higher when protein estimated from urinary-N excretion was compared with recorded protein intake averaged from three days. According to Bingham and Cummings, intra-personal variations in protein can be eliminated by collection of eight or more complete 24 h urine samples, allowing 81 (sd 5) %(Reference Bingham and Cummings28) of the consumed protein to be found in the urine samples. However, conduction of a validity study under metabolic ward conditions over a period of at least a week does not seem feasible among healthy children and adolescents.
Since the present study was not specifically designed to determine the validity of recorded protein intake, we judged the completeness of the 24 h urine collection by means of creatinine excretion. Use of an external marker such as p-aminobenzoic acid would have allowed a more reliable verification of completeness. Hence, misclassification of samples collected over notably longer or shorter periods as ‘complete 24 h samples’ may have introduced additional variation in protein intake levels estimated from urinary-N excretion. Potential bias due to energy under-reporting remains a possibility; however, analyses excluding under-reporters yielded essentially comparable results (data not shown). Nevertheless we are aware that conclusions in this regard are hampered by the fact that the present analyses are based on one day of a dietary record for which a broad range of energy intakes has to be regarded as plausible(Reference Sichert-Hellert, Kersting and Schoch4).
Furthermore, we based our allowances for extra-renal losses on percentages adopted from adults in the absence of values for children and adolescents. Finally, parents of children and adolescents participating in DONALD have relatively high socio-economic status(Reference Kroke, Manz and Kersting7) and are interested in health and nutrition issues(Reference Kersting, Sichert-Hellert and Alexy29). As a consequence, the DONALD sample is not representative for Germany and conclusions from the present results may not be extended to other populations, e.g. to samples comprising less motivated children and parents. Nevertheless, previous analyses have suggested that nutritional intake in the DONALD Study is largely comparable to that observed in nationwide representative studies(Reference Kersting, Sichert-Hellert and Alexy29).
In summary, our study suggests an acceptable validity of protein intake from one day of a weighed dietary record as compared with protein intake estimated from the recovery biomarker 24 h urinary-N excretion in a large population of children and adolescents. Since lower levels of validity were found among adolescents and young adults, caution should be exercised when analysing study samples with broad age ranges.
Acknowledgements
The DONALD Study is funded by the Ministry of Science and Research of North Rhine Westphalia, Germany. Support for additional lab analyses was provided by WCRF International. No author had any conflicts of interest. A.K. conceived the project. B.B. and A.L.B.G. performed initial data analyses. B.B. conducted further analyses and drafted the manuscript. A.E.B. supervised the study. G.B.-B. and A.L.B.G. provided statistical expertise. All authors made substantial contributions to the study design and/or the interpretation of the results.


