Malnutrition is a broad term embracing both undernutrition and overnutrition. Since the 1990s, the severity of stunting, underweight and marasmus among children under 5 years of age has been alleviated worldwide, but it remains a serious problem in south-central Asia and Africa( Reference Black, Allen and Bhutta 1 – Reference Black, Victora and Walker 3 ). At the same time, with economic development, overweight and obesity have gradually become a concern in Asia and Africa( Reference Black, Victora and Walker 3 , 4 ). In these underdeveloped regions, malnutrition and overnutrition have formed a double burden( Reference Tzioumis and Adair 5 ). In China, the prevalence of stunting, underweight, marasmus and overweight among children under the age of 5 years was 9·4, 3·4, 2·3 and 6·6 %, respectively, higher than that in the USA( 6 ). Stunting has negative effects on cognitive development and educational outcomes in childhood and income in adulthood( Reference Black, Victora and Walker 3 , Reference Walker, Chang and Powell 7 ). In addition, stunting, low weight and marasmus increase the risk of diarrhoea, pneumonia, measles and other infectious diseases as well as mortality risk in childhood( Reference Olofin, Mcdonald and Ezzati 8 – Reference Caulfield, De Onis and Blossner 10 ). Children who are overweight or obese are more likely to suffer from type 2 diabetes, hypertension, hyperlipidaemia, asthma and other diseases( 4 , Reference Zhang, Himes and Guo 11 ). Compared with normal-weight children, overweight or obese children have significantly elevated risk of overall mortality and CHD( Reference Engeland, Bjorge and Sogaard 12 – Reference Dietz 14 ).
Due to the prevalence of child malnutrition and its serious consequence, it is important to understand its contributing factors. Based on UNICEF’s conceptual framework of malnutrition, there are multifaceted factors, including basic, underlying and immediate causes, that contribute to childhood malnutrition and its short- and long-term consequences( 15 ). However, most studies focus only on the relationship between a single outcome and a limited number of predictors. The most studied outcomes are disease, growth and development. More immediate and comprehensive outcomes such as behaviour change and micronutrient levels should be examined( Reference Dewey and Aduafarwuah 16 ). The most frequently studied predictors include hygienic environment, hygienic habits( Reference Willmott, Nicholson and Busse 17 ) and dietary intake( Reference Sreeramareddy, Ramakrishnareddy and Subramaniam 18 , Reference Richard, Black and Gilman 19 ). Few studies have been conducted to comprehensively investigate the action paths and mechanisms by which the predictors interact with each other and lead to childhood malnutrition. The existing studies using path analysis to explore factors contributing to children’s growth and nutrition have mostly employed cross-sectional data. To the best of our knowledge, there is a lack of studies that use structural equation modelling (SEM) to research influential factors on children’s growth and nutrition based on a longitudinal study design.
Guided by UNICEF’s conceptual framework of malnutrition, the aim of the present study was to use SEM to analyse longitudinal data and explore the direct, indirect and total effects of family wealth, household food safety, nutrient intake, diseases and other factors on children’s growth and nutrition outcomes. The results from the study will help guide the development of comprehensive intervention programmes to address childhood malnutrition.
Materials and methods
Participants
Data for the present study came from a randomized controlled trial, conducted in a rural community in Laishui County, Hebei Province of north China in 2006–2007, that was designed to assess the effectiveness of an educational intervention on caregivers’ feeding practices and children’s growth. Details of the original trial and the effectiveness of the intervention were presented elsewhere( Reference Zhang, Shi and Chen 20 , Reference Shi, Zhang and Wang 21 ). The trial was approved by the institutional review boards of the Johns Hopkins Bloomberg School of Public Health and Peking University Health Science Center. In the current analysis, we used a cohort of children in the intervention group who were aged 1–4 months at baseline and followed up at 12 and 18 months of age. This included a total of 236 children.
Measures
A 30-min questionnaire was conducted with the mother of the child at baseline, and 12 and 18 months of age, to collect information on household sociodemographic background, caregiver’s knowledge, intention and behaviours related to infant feeding, and child’s health status. At the end of each questionnaire survey, the weight and length of the child were measured following standard procedures( Reference Cogill 22 ).
The child’s energy and dietary intakes were measured by the energy ratio, carbohydrates ratio, protein ratio and fat ratio. These measures were obtained by using the actual intake from the 24 h dietary recall divided by the Dietary Reference Intakes from the ‘Chinese resident meals nutrition DRIs of 2013 version’( 23 ).
Disease measure was the sum of frequency of diarrhoea, fever, cough and dyspnoea. For baseline, this was the cumulative frequency from birth to the baseline survey. For 12 months and 18 months, this was cumulative frequency in the last two weeks prior to the follow-up survey.
Family wealth was defined by three variables: fathers’ education, mothers’ education and number of belongings in the household. Mothers’ knowledge of household food safety was defined by the sum of scores of mothers’ knowledge on preparation of complementary foods and hand-washing before meals. Mothers’ intention of household food safety at baseline was defined by the sum of scores of mothers’ intention on preparation of complementary foods and hand-washing practice before meals at baseline. Mothers’ behaviour of household food safety was defined by the sum of scores of mothers’ behaviours on preparation of complementary foods and hand-washing practice before meals. Child feeding behaviour was defined by two variables: current breast-feeding and frequency of complementary feeding in the last 24 h. Higher values represented better performance for all the above variables. Children’s growth and nutrition outcomes comprised three indicators: weight-for-age Z-score (WAZ), length-for-age Z-score (LAZ) and weight-for-length Z-score (WLZ)( 24 ). The assignment of points for each variable is presented in the online supplementary material, Table S1.
Statistical analyses
Descriptive statistics for continuous variables were presented as mean and standard deviations, while categorical variables were presented as frequency and percentage. Univariate correlation analysis was performed for serial data of growth and nutrition outcomes, including WAZ, WLZ and LAZ scores at baseline, 12 months and 18 months.
Validity and reliability of the measurement model were defined as acceptable when the standardized factor loading was greater than 0·500 and statistically significant (i.e. P<0·05), average variance extracted (AVE) was greater than 0·500, and each latent variable’s AVE was greater than the square of the correlation coefficient between this variable and the other latent variables. Composite reliability (CR) of latent variables was calculated by the standardized regression coefficient. CR greater than 0·6 represents good reliability.
SEM was performed using a hypothetical model (shown in the online supplementary material, Fig. S1) and AMOS 20 software. Model fit was assessed using the following fit indices( Reference Hu and Bentler 25 ): χ 2 ( Reference Tabachnick and Fidell 26 ), normed fit index (NFI)( Reference Bentler and Bonett 27 ), comparative fit index (CFI)( Reference Rigdon 28 ) and root-mean-square error of approximation (RMSEA)( Reference Browne and Cudeck 29 ). A non-significant χ 2, NFI or CFI equal to or greater than 0·950, and an RMSEA less than or equal to 0·070( Reference Hu and Bentler 25 , Reference Tabachnick and Fidell 26 ) represent a good fit for the data. The method of maximum likelihood was applied when the variable met or approximated normal distribution. When variables deviated from normal distribution slightly, the maximum likelihood method was also sound( Reference Wu 30 ). However, when this deviation was serious, we preformed Bayesian estimation.
Results
Sociodemographic characteristics
Among the 236 children, 117 (49·6 %) were female. Most of the mothers (70·3 %) and fathers (75·4 %) received middle school education. Only 18·2 % of families had tap water while the remaining families used spring water or well water (Table 1).
Table 1 Demographic characteristics of the infants and their families (n 236) from a rural community in Laishui County, Hebei Province of north China, 2006–2007
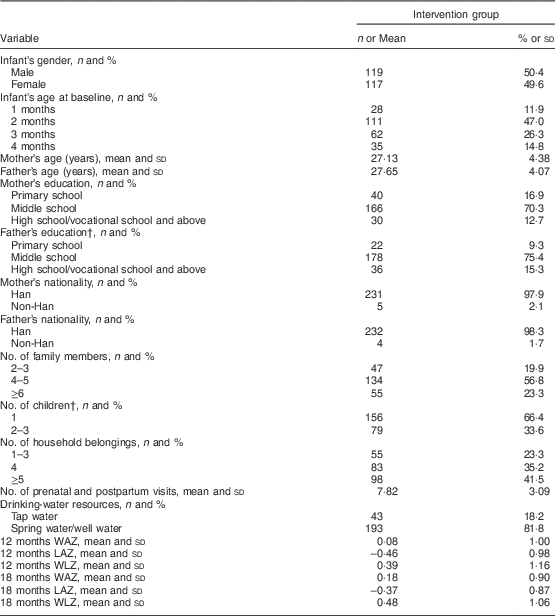
WAZ, weight-for-age Z-score; LAZ, length-for-age Z score; WLZ, weight-for-length Z-score.
† n<236 due to missing data.
Correlations between growth and development and other study variables
The correlation coefficients between infants’ growth and development and predictors were examined. WAZ, LAZ and WLZ at 12 months were positively correlated with their baseline values (Pearson correlation r=0·41, 0·47 and 0·28, respectively, P<0·001). They were also positively correlated with family wealth (Spearman correlation r=0·13 to 0·19, P<0·05). WAZ at 12 months of age was positively associated with protein ratio (r=0·14, P=0·03), while WLZ was positively associated with protein ratio (r=0·18, P=0·01) and carbohydrates ratio (r=0·15, P=0·02), and marginally associated with energy ratio (r=0·12, P=0·06). Similarly, WAZ, LAZ and WLZ at 18 months of age were positively correlated with those at baseline (r=0·24 to 0·41, P<0·001) and at 12 months of age (r=0·37 to 0·56, P<0·001). WAZ at 18 months of age was negatively correlated to the frequency of diarrhoea, fever, cough and dyspnoea, and positively correlated with protein ratio at 12 and 18 months of age. WLZ at 18 months of age was negatively associated with the frequency of fever and dyspnoea, and positively correlated with carbohydrates ratio at 12 months of age and feeding behaviours, energy ratio and protein ratio at 12 and 18 months of age.
Structural equation modelling
At baseline, for infants’ dietary intake, only three manifest variables entered the model: energy ratio, carbohydrates ratio and protein ratio. Fat ratio was not entered in the model. The model had a good fit with P=0·090, NFI=0·996 and CFI=0·998, except RMSEA (RMSEA=0·089). Diseases at baseline was not included as a latent variable because the frequency of dyspnoea was zero and there was insufficient frequency of manifest variables to form a suitable latent variable. For dietary intake at 12 months of age, the same three manifest variables entered the model: energy ratio, carbohydrates ratio and protein ratio. The model had a good fit with P=0·673, NFI=1·000, CFI=1·000 and RMSEA=0·000. For diseases at 12 months of age, only three manifest variables entered the model: total frequency of diarrhoea, fever and cough. The model had a good fit with P=0·392, NFI=0·988, CFI=1·000 and RMSEA=0·000. For dietary intake at 18 months of age, the same three variables entered the model: energy ratio, carbohydrates ratio and protein ratio. The model had a good fit with P=0·648, NFI=1·000, CFI=1·000 and RMSEA=0·000. For diseases at 18 months of age, three variables entered the model. The model had a good fit with P=0·653, NFI=0·996, CFI=1·000 and RMSEA=0·000. The parameters of validity and reliability of the measurement model are shown in the online supplementary material, Table S2.
For the latent variables with acceptable validity and reliability, confirmatory factor analysis was performed to obtain their inter-correlation (online supplementary material, Table S3). All latent variables met the standard that AVE should be greater than the square of the correlation coefficient. These latent variables had great discriminant validity.
Figure 1 shows the structural equation model for WAZ, which had a good fit (P=0·068, NFI=0·909, CFI=0·980 and RMSEA=0·033). Household food safety knowledge at baseline had a positive effect on household food safety intention at baseline (β direct=0·295, P<0·001). Similarly, household food safety knowledge at 12 months of age had a positive effect on household food safety behaviours at 12 months of age (β direct=0·204, P=0·001). Feeding behaviours at 12 months of age had a positive effect on energy and dietary intake at 12 months of age (β indirect=0·339–0·391, P<0·001), and had a positive effect on WAZ at 12 months of age (β indirect=0·042, P=0·072). Diseases at 18 months of age had a negative effect on WAZ at 18 months of age (β direct=−0·276). The direct, indirect and total effects of study variables on WAZ are shown on Table 2. WAZ at 12 months of age had the strongest effect on WAZ at 18 months of age (β direct=0·552) and the second most influential variable was diseases at 18 months of age. The third one was WAZ at baseline, followed by household food safety behaviours at 12 months of age, and finally household food safety knowledge at 12 months of age.
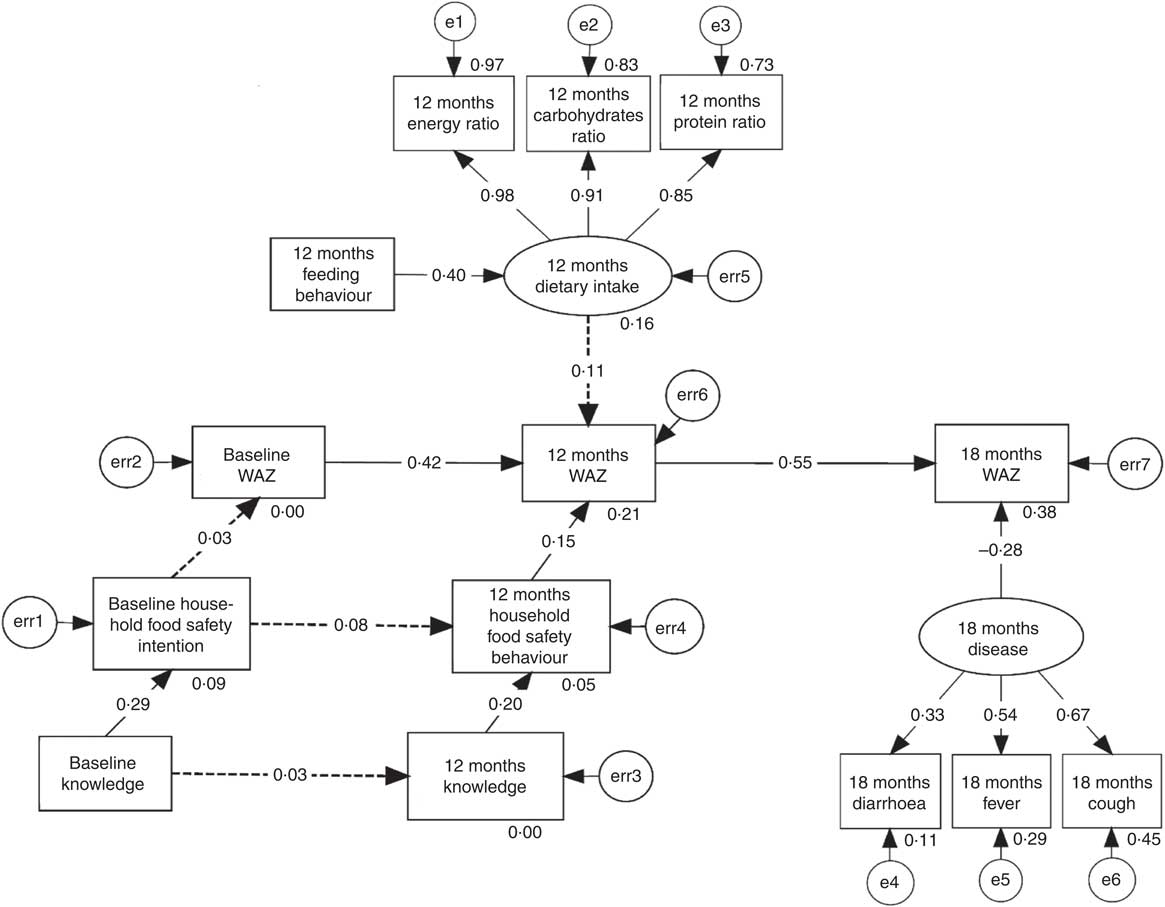
Fig. 1 Structural equation model exploring the effects of family wealth, household food safety, dietary intake, diseases and other factors on the weight-for-age Z-score (WAZ) of infants and young children (n 236), at baseline (1–4 months of age) and follow-up (12 and 18 months of age), from a rural community in Laishui County, Hebei Province of north China, 2006–2007. Solid arrows mean P<0·05.
Table 2 Decomposition of the effects of family wealth, household food safety, dietary intake, diseases and other factors on weight-for-age Z-score (WAZ) of young children (n 236) from a rural community in Laishui County, Hebei Province of north China, 2006–2007
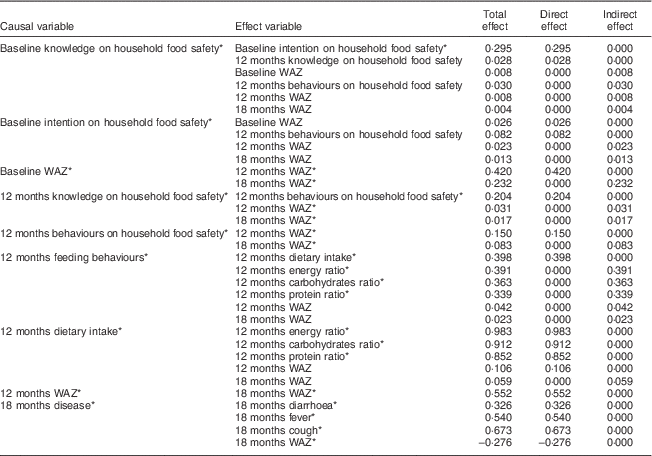
*P<0·05.
LAZ did not obtain a structural equation model with good fit.
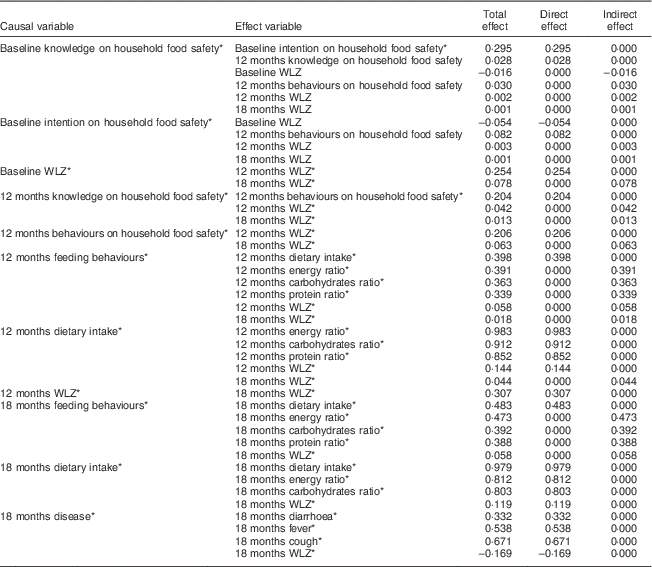
For WLZ, a model with good fit (P=0·004, NFI=0·897, CFI=0·970 and RMSEA=0·039) was obtained (Fig. 2). Household food safety behaviours and energy and dietary intake at 12 months of age had a positive, direct effect on WLZ at 12 months of age (β direct=0·206, P<0·001 and β indirect=0·144, P=0·020, respectively). Feeding behaviours had a positive effect on energy and dietary intake at 18 months of age (P<0·001). Energy and dietary intake at 18 months of age had a positive effect on WLZ at 18 months of age (P=0·052). Diseases at 18 months of age had a negative effect on WLZ at 18 months of age (P=0·041). The direct, indirect and total effects of study variables on WLZ are shown in Table 3. Variables ranked by their absolute value of effect on WLZ at 18 months of age were WLZ at 12 months of age, diseases at 18 months of age, energy and dietary intake at 18 months of age, WLZ at baseline, household food safety behaviours, feeding behaviours at 18 months of age, energy and dietary intake at 12 months of age, feeding behaviours at 12 months of age and household food safety knowledge at 12 months of age.
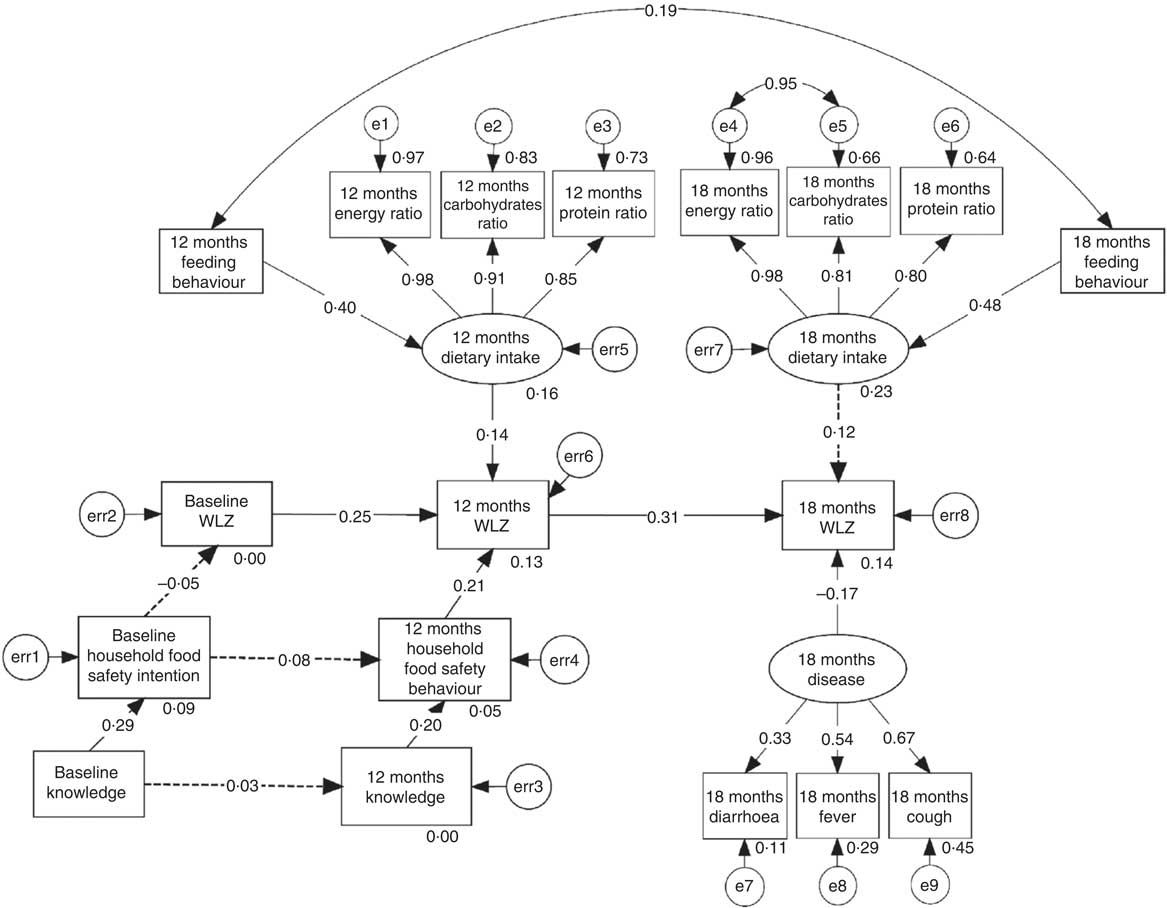
Fig. 2 Structural equation model exploring the effects of family wealth, household food safety, dietary intake, diseases and other factors on the weight-for-length Z-score (WLZ) of infants and young children (n 236), at baseline (1–4 months of age) and follow-up (12 and 18 months of age), from a rural community in Laishui County, Hebei Province of north China, 2006–2007. Solid arrows mean P<0·05.
Table 3 Decomposition of the effects of family wealth, household food safety, dietary intake, diseases and other factors on weight-for-length Z-score (WLZ) of young children (n 236) from a rural community in Laishui County, Hebei Province of north China, 2006–2007
*P<0·05.
Discussion
The present study is among the first to comprehensively examine the direction and relationship of family wealth, household food safety, energy and nutrient intake, diseases and other factors with infants’ growth and nutrition outcomes. Guided by UNICEF’s conceptual framework of malnutrition( 15 ), the present study employed SEM to examine longitudinal data, and revealed that children’s growth and nutrition status is influenced by their energy and nutrient intake, disease, earlier nutrition status and parent’s feeding behaviours and knowledge. The findings from the study suggest that it is important to promote household food safety knowledge and behaviours in the early stage of childhood to improve the child’s nutrient intake and nutrition status in early life, thereby leading to optimal growth and development at later age.
At the individual level, children’s energy and dietary intake and disease were found to be associated with their growth and nutrition outcomes. It was found in the present study that energy and dietary intake contributed only to WLZ, but not WAZ or LAZ. The possible reason is that WAZ and LAZ are ‘chronic’ or long-term measurements for nutrition status and a longer time is needed to observe the effect of dietary intake contributions on them. In contrast to WAZ and LAZ, WLZ is a more acute measurement of nutrition and can be immediately impacted by dietary intake( Reference Wang, Chen and Zhang 31 ). Our results showed that dietary intake was important to children’s growth and development. Such a finding is consistent with many other studies( Reference Sreeramareddy, Ramakrishnareddy and Subramaniam 18 , Reference Psaki, Bhutta and Ahmed 32 , Reference Saha, Frongillo and Alam 33 ). However, the long-term effects of dietary intake on WAZ and LAZ need further research with a longer follow-up period. According to Dewey and Mayers, infectious diseases such as diarrhoea and respiratory tract infections have adverse effects on children’s growth and development( Reference Dewey and Mayers 34 ). In the present study we also found that diseases including diarrhoea, fever and cough had a negative impact on WAZ and WLZ, but this was observed only at 18 months of age and not during earlier ages. It is known that young children may have catch-up growth after recovery from diarrhoea( Reference Checkley, Epstein and Gilman 35 , Reference Wierzba, Elyazeed and Savarino 36 ). Our study only obtained data at baseline, 12 and 18 months of age. The disease data were collected from birth to the survey for the baseline, while for 12 and 18 months of age it was within two weeks prior to the survey. Therefore, infants may already have had catch-up growth at baseline. Further research is needed to identify the different effects of disease in early and later periods of childhood. In addition, our study did not find a contribution of diseases to LAZ. The possible reason is that disease measured in the present study happened immediately before the survey, while catch-up growth in length needs more time than that in weight( Reference Richard, Black and Checkley 37 ).
At family level, it was found that behaviours on household food safety contributed directly to WAZ and WLZ. This may be explained by the quantity and quality of complementary food, as well as hygiene practices when preparing and feeding foods. Previous studies found that intervention based on sanitary water sources and hygiene habits, especially washing hands before meals, could reduce the incidence of diarrhoea remarkably( Reference Zwane and Kremer 38 – Reference Fewtrell, Kaufmann and Kay 40 ). According to a meta-analysis on interventions conducted at kindergartens, primary schools and colleges in developed countries which required participants to wash hands before meals, after sneezing and coughing, and after changing diapers, washing hands could reduce 16 % of respiratory tract infections( Reference Rabie and Curtis 41 ). In addition, a meta-analysis showed that intervention programmes focusing on water sources, sewer systems and personal hygiene could increase LAZ of children( Reference Dangour, Watson and Cumming 42 ). Therefore, providing health education to caregivers at the early stage of childhood may help improve the children’s physical health and growth at later ages.
The SEM provided several important findings: (i) WAZ at 12 months of life had the most significant contribution to WAZ at later age; (ii) diseases had an important influence on WAZ; and (iii) household food safety knowledge and behaviours in early stage of childhood contributed to WAZ at later age. These results suggest that an intervention focusing on child feeding knowledge and behaviours can alleviate incidence of infectious disease and improve dietary intake, leading to better growth and development outcomes. In an educational intervention based on locally accessible, affordable and acceptable resources in a rural area in China, mothers’ knowledge and behaviours on household food safety feeding behaviours, infants’ energy and dietary intake and physical health were significantly improved( Reference Zhang, Shi and Chen 20 ). According to Bhutta et al., intervention programmes using health education as a main intervention measure may produce significant impacts on children’s growth and development( Reference Bhutta, Ahmed and Black 43 ). Majamanda et al. found that interventions using health education and counselling as the intervention strategy without other measures at community level can enhance growth outcomes of infants( Reference Majamanda, Maureen and Munkhondia 44 ). Also, Shi and Zhang revealed that nutrition education combined with other strategies can improve growth and reduce malnutrition in developing countries( Reference Shi and Zhang 45 ). Similarly, another review of sixteen studies, most of which were health education to improve complementary foods while the rest combined it with additional energy intake, found that these interventions generated positive effects on feeding behaviours, infants’ dietary intake and physical growth( Reference Lassi, Das and Zahid 46 ). Thus, the current evidences indicate that educational intervention can effectively improve child growth and nutrition outcomes.
There were several strengths of our study. We employed SEM to examine the relationships between multifaceted factors and outcomes. Compared with most commonly used methods such as linear or logistic regression, SEM could effectively control for measurement error( Reference Bian, Che and Yang 47 ). More importantly, SEM could tackle multiple dependent variables simultaneously and examine the relationships between dependent variables and independent variables at the same time without adjusting for confounders. Child malnutrition is evaluated by various measures and can be impacted by multiple factors; therefore SEM is a more appropriate method to examine their relationships than other statistical methods. The present study collected longitudinal data, which enables us to examine the impact of feeding behaviour, dietary intake, health and nutrition at an earlier stage on those at later age.
The present study also had several limitations. The observation period was relatively short; therefore, we were unable to evaluate the long-term impact of the factors of interest on nutrition and growth outcomes. In addition, the symptoms such as diarrhoea, fever, cough and dyspnoea were self-reported and may not be accurate. Moreover, we treated WAZ and WLZ as continuous variables. Generally, WAZ and WLZ greater than 2 are considered overnutrition, whereas WAZ and WLZ less than −2 represent undernutrition. Therefore, the results on the factors contributing to WAZ and WLZ should be interpreted with caution. Among children 12 months of age, 3·0 and 8·5 %, respectively, had WAZ>2 and WLZ>2. At 18 months, the proportion of WAZ>2 and WLZ>2 was 0·9 and 9·4 %, respectively. Although WAZ or WLZ>2 is an indication of overnutrition, considering that only one (0·4 %) child’s maximal values exceeded 3 and that only a very small percentage of the children had WAZ or WLZ>2, it is reasonable to state that a higher value of WAZ or WLZ represents better performance. Overall, our results provided a useful reference for interventions on child growth in rural areas.
Conclusion
The present study used SEM to examine the direct, indirect and total effects of household food safety knowledge and behaviours, energy and dietary intake and diseases on children’s growth and development. It indicated that improving caregivers’ feeding knowledge and behaviours at an earlier stage of children’s life could decrease their disease, promote their dietary intake at a later age and ultimately enhance their physical growth.
Acknowledgements
Acknowledgements: The authors gratefully acknowledge the assistance of Laishui County Maternal and Child Health Hospital and the participating township hospitals in data collection, as well as the cooperation of the participants. Financial support: This study was funded by the Proctor & Gamble Fellowship at Johns Hopkins Bloomberg School of Public Health, Baltimore, MD, USA. The funding source had no role in the study design, data analysis, data interpretation or writing of the report. Conflict of interest: The authors declare that they have no conflicts of interest. Authorship: Z.C. and L.S. contributed equally to this work. Z.C. wrote the first draft of the manuscript. L.S., J.Z., Y.W. contributed to the design of the study and questionnaires. J.Z. and L.S. contributed to the data collection and field supervision. Y.L. contributed to the analysis. Ethics of human subject participation: Not applicable.
Supplementary material
To view supplementary material for this article, please visit https://doi.org/10.1017/S1368980017003494


