Frequent vegetable intake in adolescence may reduce the risk of obesity and a range of chronic diseases( Reference Craigie, Lake and Kelly 1 , 2 ). It is encouraging that vegetable intake in childhood and adolescence has been increasing over the past decade in many countries in Europe( Reference Inchley, Currie and Jewell 3 , Reference Vereecken, Pedersen and Ojala 4 ) since a frequent vegetable intake in childhood and adolescence seems to track into adulthood( Reference Craigie, Lake and Kelly 1 , Reference Kelder, Perry and Klepp 5 ). Many studies show that adolescents from higher socio-economic groups eat vegetables more frequently than adolescents from lower socio-economic groups( Reference Inchley, Currie and Jewell 3 , Reference Fismen, Smith and Torsheim 6 – Reference Fismen, Samdal and Torsheim 13 ). It is important to continuously monitor vegetable intake as well as socio-economic variations in vegetable intake to guide efforts to improve adolescents’ diet and reduce their risk of overweight and chronic diseases.
Only few studies have reported how socio-economic variations in vegetable intake among adolescents change over time and these few studies have used different measures of socio-economic position. We have identified five studies of changes in social inequality in vegetable intake among 10–16-year-old children and adolescents. A study from Norway( Reference Hilsen, van Stralen and Klepp 11 ) used parental education as indicator of socio-economic position and found increasing relative social inequality in vegetable intake from 2001 to 2008. Other studies from Norway( Reference Fismen, Smith and Torsheim 6 ), Scotland( Reference Levin, Kirby and Currie 8 ) and four Nordic countries( Reference Fismen, Smith and Torsheim 7 ) applied family affluence as indicator of socio-economic position and reported no changes in relative social inequality in daily vegetable intake from 2002 to 2014. A pan-European study( Reference Inchley, Currie and Jewell 3 ) using family affluence as indicator of socio-economic position found no change in absolute social inequality in daily vegetable intake from 2002 to 2014.
The choice of socio-economic indicator may be a key to understand the diverging findings. According to Fismen et al. ( Reference Fismen, Samdal and Torsheim 13 ), material capital and cultural capital contribute in different ways to the prediction of healthy food choice among adolescents. De Clerq et al. ( Reference De Clercq, Abel and Moor 14 ) also stress the choice of socio-economic indicator. They show that various forms of capital in the family are differently associated with adolescents’ food intake and that cultural capital is an important factor in the explanation of social inequality in food intake. Further, it is important to present absolute as well as relative social inequality because these two aspects of social inequality may show different time trends.
The present paper examines the trend in social inequality in low vegetable intake among adolescents in Denmark from 2002 to 2014 using occupational social class (OSC) as the socio-economic indicator. OSC is a classical sociological indicator of socio-economic position, measured by a combination of the educational qualifications needed to fill the occupation and the level of control (e.g. number of employees or control over capital) associated with this occupation. It is probably more closely related to cultural capital than material assets in the family. The analyses focus on both absolute and relative social inequalities. The outcome variable is less than weekly vegetable intake, a cut-off point which represents a more extreme risk group than the cut-off point not adhering to the recommended daily intake.
Methods
Design and study population
The present paper reports Danish data from four waves of the international collaborative cross-national Health Behaviour in School-aged Children (HBSC) study( Reference Inchley, Currie and Young 15 , Reference Roberts, Freeman and Samdal 16 ). The overall aim of the HBSC study is to enhance the understanding of young people’s health behaviours in their social settings. The study design is repeated and comparable cross-sectional surveys of nationally representative samples of three age groups, 11-, 13-, and 15-year-old schoolchildren, every fourth year. Four of these surveys (2002, 2006, 2010 and 2014) used similar measurements of vegetable intake.
Data collection and measurements
In Denmark, we collected data from random samples of schools, drawn from complete lists of private and public schools. The response rate was 87·6 % (n 20 549). The students answered the internationally standardized HBSC questionnaire in the classroom( Reference Roberts, Freeman and Samdal 16 ). In the surveys in 2002, 2006, 2010 and 2014, vegetable intake was measured in a similar way by a food frequency item: ‘How many days a week do you usually eat vegetables?’ with seven response categories (‘never’, ‘less than once a week’, ‘once a week’, ‘2–4 days a week’, ‘5–6 days a week’, ‘once a day every day’ and ‘every day more than once’). A study from Belgium reported that this measure of frequency of vegetable intake was reliable as assessed by test–retest agreement and fairly valid as assessed by comparison with a 7 d food diary( Reference Vereecken and Maes 17 ). We dichotomized the responses into ‘never’ + ‘less than once a week’ v. more often.
Data on socio-economic position stem from the students’ indication of their father’s and mother’s occupation, coded by the research group into OSC. The categories range from I (high) to V (low)( Reference Christensen, Krølner and Nilsson 18 ). We added social class VI to include economically inactive parents who receive unemployment benefits, disability pension or other kinds of transfer income. The coding procedure was identical in all four surveys. Several studies have demonstrated that schoolchildren from the age of 11 years are able to report their parents’ occupation with a fair validity( Reference Ensminger, Forrest and Riley 19 – Reference West, Sweeting and Speed 23 ). Each participant was categorized by the highest-ranking parent into high (I–II), middle (III–IV) and low (V–VI) OSC.
Statistical analyses
We excluded participants with missing information about vegetable intake and OSC, resulting in a final sample size of n 17 243 (Table 1). We applied the χ 2 test for homogeneity and the Cochrane–Armitage test for trends over time. The analyses included two measures of social inequality in less than weekly vegetable intake: (i) rate difference in less than weekly intake of vegetables between high and low OSC as a measure of absolute social inequality; and (ii) OR for less than weekly vegetable intake based on logistic regression analysis as a measure of relative social inequality using high OSC as reference. The logistic regression analyses included sex, age group and survey year as control variables and a final test for statistical interaction between OSC and survey year. To study the effect of cut-off point we also performed the logistic regression analyses with the dichotomization less than daily v. daily vegetable intake.
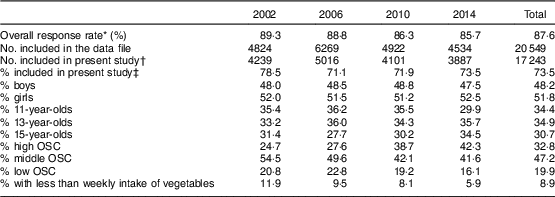
Table 1 Study population’s sex, age group, occupational social class (OSC) and less than weekly vegetable intake by survey year; nationally representative samples of 11–15-year-olds (n 17 243) from four waves of data collection in the Health Behaviour in School-aged Children (HBSC) study in Denmark, 2002–2014

* Number of participants in the data file as percentage of schoolchildren enrolled in the participating classes.
† Number of participants with full data about vegetable intake, OSC, sex, age group and survey year.
‡ Included schoolchildren as percentage of children enrolled in the participating classes.
Ethical issues
There is no formal agency for approval of questionnaire-based surveys in Denmark. Therefore, we asked the school board as the parents’ representative, the headmaster and the student council in each of the participating schools to approve the study. The participants received oral and written information that participation was voluntary and anonymous. The data file does not comprise data about the identity of the individual participants. The study complies with national standards for data protection. The Danish Data Protection Authority has granted acceptance (Case No. 2013-54-0576).
Results
In the entire study population, 8·9 % of the schoolchildren reported less than weekly vegetable intake (Table 1). The prevalence was 4·7 % in high OSC, 10·1 % in the middle OSC and 13·3 % in low OSC (χ 2 test, P<0·001). The prevalence decreased from 11·9 % in 2002 to 5·9 % in 2014 (test for trend, P<0·001; Table 1). Among students with missing information about OSC, 12·2 % reported less than weekly intake of vegetables (data not shown).
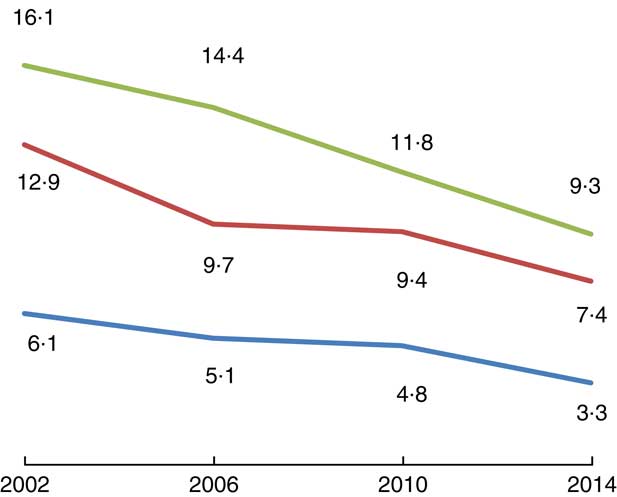
Figure 1 shows the prevalence of less than weekly intake of vegetables by survey year and OSC. There was a significant decrease from 2002 to 2014 in all OSC groups (P high<0·001, P middle<0·001, P low=0·001). The rate difference between high and low OSC was 10·0 % in 2002, 9·3 % in 2006, 7·0 % in 2010 and 6·0 % in 2014, which suggests a diminishing absolute social inequality in less than weekly vegetable intake from 2002 to 2014.

Fig. 1 Percentage with less than weekly intake of vegetables by survey year and occupational social class (![]() , high;
, high; ![]() , middle;
, middle; ![]() , low) among nationally representative samples of 11–15-year-olds (n 17 243) from four waves of data collection in the Health Behaviour in School-aged Children (HBSC) study in Denmark, 2002–2014
, low) among nationally representative samples of 11–15-year-olds (n 17 243) from four waves of data collection in the Health Behaviour in School-aged Children (HBSC) study in Denmark, 2002–2014
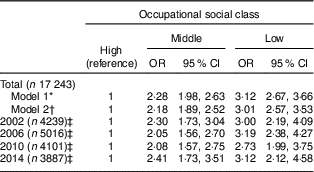
Table 2 shows the relative social inequality in less than weekly intake of vegetables, i.e. the OR and 95 % CI for less than weekly intake. In the total study population there was a significant and graded increase in less than weekly vegetable intake by decreasing OSC. The OR (95 % CI) for less than weekly vegetable intake was 2·28 (1·98, 2·63) in the middle compared with the high OSC and 3·12 (2·67, 3·66) in the low compared with the high OSC. The estimates remained almost the same when adjusted for sex, age group and survey year. Table 2 also shows that this pattern of a significant association between OSC and less than weekly vegetable intake was consistent across the surveys in 2002, 2006, 2010 and 2014. Assessed by the magnitude of the OR estimates, there was no change in the relative social inequality in less than weekly vegetable intake across the last four surveys. The statistical interaction between OSC and survey year was insignificant (P=0·948), which confirms that there was no change in relative social inequality.
Table 2 OR and 95 % CI for less than weekly vegetable intake by occupational social class among nationally representative samples of 11–15-year olds from four waves of data collection in the Health Behaviour in School-aged Children (HBSC) study in Denmark, 2002–2014

* Unadjusted.
† Adjusted for sex, age group and survey year.
‡ Adjusted for sex and age group.
The analyses with the alternative cut-off point, less than daily v. daily vegetable intake, confirmed the main observations. That is, the proportion with low vegetable intake decreased from 70·8 % in 2002 to 55·6 % in 2014, there was a statistically significant social inequality in low vegetable intake, the absolute social inequality declined and the relative social inequality remained unchanged (data not shown).
Discussion
Findings
The present study is one of the first to report changes in social inequality in vegetable intake over time among adolescents, using OSC as indicator of socio-economic position and with a focus on low intake of vegetables. There was an overall reduction in the proportion of adolescents with less than weekly vegetable intake from 2002 to 2014, which is good news from a health perspective. There was a significant increase in less than weekly vegetable intake with decreasing OSC, from 4·7 % in high OSC to 13·3 % in low OSC. There was a diminishing absolute social inequality in less than weekly vegetable intake from 2002 to 2014 and a persistent relative social inequality in less than weekly vegetable intake.
The finding of a diminishing proportion of adolescents with low intake of vegetables from 2002 to 2014 corresponds with observations in many other countries( Reference Inchley, Currie and Jewell 3 , Reference Vereecken, Pedersen and Ojala 4 ). It also corresponds with a national study which concluded that there is a positive development in fruit and vegetable intake among children in Denmark from 2005 to 2013( Reference Matthiesen and Fags 24 ).
The finding of persistent relative social inequality in vegetable intake corresponds with four other studies( Reference Inchley, Currie and Jewell 3 , Reference Fismen, Smith and Torsheim 6 – Reference Levin, Kirby and Currie 8 ) but does not correspond with the finding by Hilsen et al. ( Reference Hilsen, van Stralen and Klepp 11 ), who reported an increasing social inequality in vegetable intake among adolescents. Hilsen et al. ( Reference Hilsen, van Stralen and Klepp 11 ) applied parental education reported by parents as socio-economic indicator, an indicator which is closely related to OSC, but nevertheless reveals a different trend in social inequality than our study.
Food habits in adolescence track into adulthood( Reference Craigie, Lake and Kelly 1 , Reference Kelder, Perry and Klepp 5 ). In this way, social inequality in food habits in adolescence may be one of the pathways which can explain the social inequality in health in adulthood( Reference Due, Krølner and Rasmussen 25 ). According to Kant and Graubard( Reference Kant and Graubard 26 ) it is reasonable to expect that socio-economic variations in dietary behaviours may also contribute to socio-economic variations in body weight. It is therefore important to monitor social inequalities in health behaviours and body weight among children and young people.
We expected a reduction in the proportion of overweight children in this period with decreasing proportion with low vegetable intake, but the HBSC studies from Denmark in 2002, 2006, 2010 and 2014 showed almost no change in the proportion of overweight students in this period( Reference Rasmussen, Pedersen and Due 27 ).
Methodological issues
The strength of the current analyses is the comparability of the four cross-sectional and nationally representative studies which applied a standardized protocol for sampling and measurement. The participation rate was fairly high (87·6 %), which reduces the risk of selection bias. There is a risk of bias related to item non-response since approximately one-quarter of the participants lacked data on vegetable intake and/or OSC. Students excluded from the analyses because of missing data on OSC had a high rate of less than weekly intake of vegetables. This may lead to an underestimation of the proportion with low vegetable intake but is not likely to affect the findings about social inequality in less than weekly intake of vegetables. It may also be a limitation that the distribution of OSC in the population changes over time, mostly because there was an increasing proportion in the high OSC over time and a decreasing proportion in middle OSC.
The available studies about the validity of the two main variables, vegetable intake and OSC, suggest that these measurements have acceptable validity( Reference Vereecken and Maes 17 , Reference Ensminger, Forrest and Riley 19 – Reference West, Sweeting and Speed 23 ) but we need to know more about the validity of self-reported vegetable intake. Although one study reports acceptable reliability and validity, the same study suggests that self-reporting results in an overestimation of vegetable intake( Reference Vereecken and Maes 17 ).
Implications
It is important to monitor not only vegetable intake but also social inequality in vegetable intake because this inequality may contribute to social inequality in health in adulthood( Reference Due, Krølner and Rasmussen 25 ). We propose similar studies in other countries to assess whether the reported trends in social inequality are generalizable to other countries. The current analysis also shows that time trends in social inequality in low vegetable intake appear differently in terms of absolute and relative inequality, i.e. it is important to include both perspectives in studies of social inequality.
There is a need to target adolescents from lower socio-economic groups in the efforts to increase vegetable intake. Pearson et al. propose to identify target groups defined by family circumstances for interventions aiming at promoting healthy eating( Reference Pearson, Biddle and Gorely 10 ). Other possibilities are to focus on mediators of the connection between social circumstances and vegetable intake, such as accessibility and preferences( Reference Hilsen, van Stralen and Klepp 11 ), and to focus more on interventions in the school setting which includes students from all socio-economic groups( Reference Fismen, Smith and Torsheim 7 ).
Acknowledgements
The Principal Investigator for the Danish HBSC studies was Bjørn Holstein until 1991, Pernille Due from 1994 to 2010 and Mette Rasmussen from 2010. Financial support: This work was supported by the Nordea Foundation, Copenhagen (grant number 02-2011-0122). The Nordea Foundation had no role in the design, analysis or writing of this article. Conflicts of interest: None. Authorship: All authors contributed to the formulation of research questions and design of the study. M.R., B.E.H., R.F.K. and T.P.P. contributed to the data collection. R.F.K. and B.E.H. developed the protocol for coding of occupational social class. B.H. and M.R. analysed the data and drafted the paper. All authors contributed to a critical review of analyses and manuscript.


