


Iodine plays a crucial role in maintaining thyroid status and preventing thyroid disease(Reference Laurberg, Pedersen, Knudsen, Ovesen and Andersen1, Reference Konno, Makita, Yuri, Iizuka and Kawasaki2). The costs associated with iodine-related thyroid disease medical care are substantial(Reference Kahaly and Dietlein3). Iodine consumption has shown an upward trend in most Western European countries owing to increased iodine levels in basic foodstuffs. Use of iodine compounds in foods may result in excess contributions to dietary iodine intakes(4). Therefore, it is mandatory to monitor iodine intakes in the general population and to identify groups at risk for low or elevated dietary iodine intakes.
By the turn of the 20th century, goitre was endemic in France. Although iodized household salt (10–15 μg iodine/g) was introduced on a voluntary basis from 1952 onwards, recommendations for reducing salt intake and the increasing use of non-iodized salt may be at the expense of iodine intake(5). Data on iodine nutrition in the French population are scarce. A cross-sectional study in 1985 showed clinical signs of goitre (16·7 %) and a low mean iodine excretion (85·0 μg/g creatinine) among a representative sample of young adolescents (10–16 years)(Reference Mornex6). A second cross-sectional study performed in 1994 among schoolchildren (6–14 years) showed an increase (120 μg/l) in the median urinary iodine concentration (UIC) and a low goitre prevalence among boys (4·1 %) and girls (3·1 %) estimated by ultrasonography(Reference Caron, Jaffiol, Leclère, Orgiazzi and Delange7). In the SU.VI.MAX (SUpplémentation en VItamines et Minéraux AntioXydants) study (1994–5), median UIC was 89 μg/l for males (45–60 years) and 82 μg/l for females (35–60 years) and the overall goitre prevalence ranged from 11·3 % among males to 13·9 % for the female sample(Reference Valeix, Zarebska, Préziosi, Galan, Pelletier and Hercberg8). Thyroid nodules assessed by ultrasound were found in 14·5 % of the population(Reference Valeix, Zarebska, Bensimon, Cousty, Bertrais, Galan and Hercberg9). According to criteria of the WHO, UNICEF and the International Council for the Control of Iodine Deficiency Disorders (ICCIDD), the French adult population may suffer from mild iodine deficiency. In particular, some subsets of the population, especially pregnant females, had an increased prevalence of mild iodine deficiency(Reference Caron, Hoff and Bazzi10).
The French government has set goals and objectives for public health action (Public Health Act, 2004) that pinpointed the need for an adequate iodine supply as a way of reducing endemic goitre in the general population. Underlying this goal is the objective to provide dietary guidance to prevent iodine-related thyroid disease. The primary aim of the present study was to assess dietary iodine intakes among apparently healthy adults aged 35–60 years participating in the SU.VI.MAX study. The influence of risk factor distribution on differences in iodine status has received little attention(Reference Rasmussen, Ovesen, Bülow, Jørgensen, Knudsen, Laurberg and Perrild11–Reference Pryer, Nichols, Elliott, Thakrar, Brunner and Marmot15). Consequently, our secondary aim was to explore sociodemographic characteristics associated with the iodine intake distribution across recommended dietary iodine intake levels.
Methods
Study population
Data came from the SU.VI.MAX study, initially designed as a double-blind, placebo-controlled, primary prevention trial to evaluate the effect of daily supplementation with antioxidants at nutritional doses (vitamins E and C, β-carotene, Se and Zn) on chronic disease incidence(Reference Hercberg, Galan, Préziosi, Bertrais, Mennen, Malvy, Roussel, Favier and Briançon16). A total of 13 017 subjects, females aged 35–60 years and males aged 45–60 years from all over France, were included between October 1994 and June 1995 for a planned follow-up of 8 years. Participant characteristics suggest that the sample was similar to the national population in terms of geographical density and socio-economic status for the selected age groups(Reference Hercberg, Préziosi, Briançon, Galan, Triol, Malvy, Roussel and Favier17). The present study sample consisted of 2117 males and 2962 females who had completed at least six 24 h dietary records over a 2-year period (1994–6). Data for pregnant females were excluded from the analyses. Written informed consent was obtained from all participants and all procedures were approved by the Ethical Committee for Biological Studies among Humans (CCPPRB Paris Cochin no. 706) and the National Committee for the Protection of Privacy and Civil Liberties (CNIL no. 334641).
Dietary assessment methods
Participants were invited to complete a 24 h dietary record every 2 months. Days were selected at random to ensure a sample of weekdays and weekend days throughout the year. Subjects were asked to quantify all foods consumed with reference to photographs of food portions. The colour food photography manual validated on 780 subjects in a pilot study includes a wide range of foods and beverages (959 foods) typical of the French diet(Reference Le Moullec, Deheeger and Préziosi18). Dietary data were considered unreliable if energy from any 24 h record was outside the range of 2·09–14·64 MJ (500–3500 kcal) for females and 3·35–16·74 MJ (800–4000 kcal) for males. Usual mean food intakes were assessed using six 24 h dietary records. Iodine intakes from foods were computed using the French Food Composition Table(Reference Favier, Ireland-Ripert, Toque and Feinberg19). Iodine intakes refer to the intrinsic amounts in basic foods. Table salt use and salt used in cooking were not recorded. Analysed iodine values of French products were used whenever available. Most recent values for fish and fish products, liquid milk and processed dairy products (yoghurt, cheese), eggs, beverages (wine, tap water, mineral water) and iodized table salt were used. The median iodine concentration of all milk consumed throughout the year was used in the present study.
Iodized table salt as a source of iodine
To assess the potential contribution of iodized table salt to iodine intake, daily table salt intake was measured over seven consecutive days in a subgroup of 157 participants(Reference Mennen, Lafay, Valeix, Galan, Volatier, Castetbon and Hercberg20). Subjects for this specific sub-study were participants living in the Paris area (‘Ile-de-France’). During the 7 d period, volunteers were provided with a personal salt shaker. A total of 56·1 % of the participants used table salt both inside and outside the home and added an average of 0·48 g salt to their foods daily. In 2002, 47 % of all table salt consumed in France was iodized at 12·5 μg/g, providing on average about 6 μg iodine daily. Thus, in our study, on the basis of the above percentages, 6 μg iodine was randomly allocated to 26·4 % of the computed mean daily iodine intake. Cooking salt intake was not assessed by the 7 d food diary.
Urinary iodine concentration
Morning urine samples collected at baseline (October 1994 to June 1995) were used to evaluate iodine status. UIC was measured after wet acid mineralization (Technicon AutoAnalyzer II; Technicon Instruments Corporation, Tarrytown, NY, USA) by spectrophotometry (Sandell–Kolthoff reaction). Subjects taking thyroid hormones, antithyroid drugs, amiodarone or lithium treatment were excluded. Subjects with overt iodine contamination (UIC ≥ 600 μg/l) were also excluded. Population median UIC status was assessed according to WHO, UNICEF and ICCIDD criteria for males and non-pregnant/non-lactating females: ≥100 μg/l (adequate iodine excretion status), 50–100 μg/l (mildly low iodine excretion) and <50 μg/l (moderately low iodine excretion)(21).
Covariates
Body weight (BW) and height were measured and BMI (weight (kg)/height (m)2) was calculated. Demographic and lifestyle data included age, smoking habits, marital status, employment status, and education level. Educational achievement was classified as ‘low’ (<13 years), ‘intermediate’ (13–14 years) and ‘high’ (≥15 years). Smoking habits (never and former smokers v. present smokers), marital status (whether subjects lived with a partner or not) and employment status (employed v. unemployed) were analysed as dichotomous variables. Physical activity (transportation, work and leisure combined) was self-estimated in equivalent walking-hours per day and measured on a scale ranging from ‘never or seldom’ to ‘light’ (<1 h/d) or ‘moderate’ (≥1 h/d). Males were considered as ‘light’, ‘moderate’ or ‘heavy’ drinkers if their recorded consumption of alcohol (g ethanol) was <30, 30–45 or ≥45 g/d, respectively. Females were classified as ‘light’ (<10 g/d), ‘moderate’ (10–20 g/d) or ‘heavy’ (≥20 g/d) drinkers. Zip codes of the home addresses were used to categorize eleven well-defined geographical regions of residence(Reference Valeix, Zarebska, Préziosi, Galan, Pelletier and Hercberg8): (i) ‘Nord-Pas-de-Calais/Picardie’; (ii) ‘Haute-Normandie/Basse-Normandie’; (iii) ‘Lorraine/Franche-Comté/Alsace/Champagne-Ardenne’; (iv) ‘Ile-de-France’; (v) ‘Bretagne’; (vi) ‘Pays de la Loire’; (vii) ‘Poitou-Charente/Aquitaine/Midi-Pyrénées’; (viii) ‘Limousin/Auvergne’; (ix) ‘Rhône-Alpes’; (x) ‘Provence-Alpes Côte d’Azur/Languedoc-Roussillon’; and (xi) ‘Centre/Bourgogne’. A three-level urbanization classification (urban, semi-urban, rural) was ordered according to the original scheme developed by the National Central Bureau of Statistics and Economic Studies (INSEE).
Statistical analyses
All statistical analyses were performed separately in males and females using the SAS statistical software package version 8·2 (SAS Institute, Inc., Cary, NC, USA). Since the distribution of values was skewed, iodine intake was logarithmically transformed and geometric means are presented. As iodine intake was highly related to energy intake, the energy-adjusted iodine intake (μg iodine/4184 kJ (1000 kcal)) was also calculated for each subject. In order to assess adequacy of iodine intake, we compared respondents’ mean iodine intake with the dietary reference nutrient intakes (DRI) for adults (150 μg/d; ∼2 μg/kg BW)(22). In addition, median values were determined and mean nutrient intakes at the 97·5th percentile were compared with the tolerable upper intake level (UL) for adults (600 μg/d)(23). The cut-off value for low iodine intake was 70 μg/d (∼1 μg/kg BW)(Reference Delange24). Because there were few subjects with iodine intake <70 μg/d in each sex and age subgroup, we classified subjects into ‘low’ (LII; <100 μg/d), ‘middle’ (MII; 100–150 μg/d) or ‘high’ (HII; ≥150 μg/d) subgroup levels of iodine intake relative to the DRI. Subjects consuming less than two-thirds of the DRI (100 μg/d) were considered to have potentially inadequate iodine intake. Iodine intakes were compared between genders using Student’s t test or the χ 2 test where appropriate. Analysis of variance/covariance was used to compare iodine intakes according to various sociodemographic and health-related characteristics, and the Bonferroni adjustment for multiple comparisons was performed when appropriate. Tests for linear trend were performed. Age (years), food energy (continuous) and covariates associated with iodine intake in bivariate analyses at P < 0·20 were entered simultaneously into the multivariate model. Multinomial logistic regression models were applied to assess lifestyle factors related to LII and MII compared with the HII group (reference)(Reference Hosmer and Lemeshow25). Multivariable-adjusted odds ratios with 95 % confidence intervals are reported. A P value <0·05 was considered statistically significant.
Results
Lifestyle factors
The mean age (sd) was 52·2 (4·7) years for males and 47·2 (6·6) years for females. Mean (sd) BMI was 25·3 (3·1) kg/m2 for males and 23·0 (3·6) kg/m2 for females; 5·7 % of the subjects were obese (BMI ≥ 30·0 kg/m2). One-quarter of the participants had 15 years or more of education. In our sample, 93·3 % of males and 80·3 % of females were categorized as alcohol drinkers. Only 12·9 % of the participants smoked. Among males, 93·1 % of non-smokers and 95·3 % of smokers drank alcohol. The corresponding figures for females were 79·2 % and 87·5 %, respectively. Some 30·4 % of participants reported physical activity of <1 h walking/d, whereas 44·9 % reported ≥1 h/d and 24·7 % reported irregular or no physical activity.
Dietary iodine intakes
Mean (sd) dietary energy was 10·16 (1·98) MJ/d (2431·6 (474·2) kcal/d) for males and 7·70 (1·75) MJ/d (1843·1 (418·1) kcal/d) for females. Both median and geometric mean iodine intakes as well as 2·5–97·5th percentile ranges for males and females of specific age groups are presented in Table 1. Dietary iodine intakes ranged from 30·0 to 446·3 μg/d. The median daily iodine intake (geometric mean, sd) was significantly lower for females, 131·4 μg (129·2, 1·4 μg), compared with males, 150·7 μg (148·9, 1·4 μg; P < 0·001). High-level (97·5th percentiles) intakes were 273·4 μg/d for males and 245·0 μg/d for females. Energy-adjusted iodine intake in males was slightly lower than in females for all age groups (P < 0·0001). Iodine intakes adjusted for BW showed an increasing trend with age in males (P < 0·08) and a decreasing trend in females (P < 0·003). Iodine intakes below 2 and 1 μg/kg BW were prevalent in 49·5 % and 2·2 % of males, and 38·1 % and 1·7 % of females, respectively.
Table 1 Mean and median dietary iodine intakesFootnote * by sex and age among adults in the SU.VI.MAX study (1994–6)

* Data in the table are for food intakes (mean of six 24 h diet records in 2 years) and include the estimated amount of salt added at the table.
† μg/4184 kJ (1000 kcal) = μg iodine per 4184 kJ (1000 kcal) from food (excluding energy from alcohol).
‡ Geometric mean.
Some 50·5 % of males and 34·3 % of females achieved the DRI (Table 2). Over 8·5 % of males and 20·3 % females had iodine intakes below two-thirds of the DRI. Across each age group, a higher proportion of females than males had iodine intakes <100 μg/d. With iodine intakes calculated over 6 d, the UL was never exceeded in all age–sex groups. Only ninety-eight subjects (0·3 % of total daily dietary records) had a daily intake of iodine >600 μg. The highest single estimated daily iodine intake was 1046·9 μg for males and 1159·8 μg for females.
Table 2 Daily iodine intake (cumulative percentages) by sex and age among adults in the SU.VI.MAX study (1994–6)

Urinary iodine concentration
Median UIC was 85·1 μg/l for males, 86·6 μg/l for younger (35–44 years) and 81·1 μg/l for older females (45–60 years). The median UIC was <100 μg/l in all age groups. The prevalence of UIC < 100 μg/l and <50 μg/l was respectively 61·6 % and 15·7 % for males, 60·1 % and 17·0 % for younger females, 64·6 % and 20·8 % for the oldest females. UIC and iodine intakes were associated in both males (r = 0·11; P < 0·001) and females (r = 0·07; P < 0·0001).
Demographic and lifestyle covariates
Sociodemographic and behavioural characteristics associated with iodine intakes and the results of a multivariate analysis of iodine intakes for these selected variables are presented in Table 3. Age-adjusted mean iodine intakes decreased with smoking, alcohol consumption and urbanization, and increased with education and physical activity. However, the differences in iodine intakes for education level and physical activity were no longer significant in multivariate analyses. Older females had higher iodine intakes than those aged 35–44 years (130·4 v. 127·0 μg/d; P = 0·034). Male and younger female smokers tended to consume less iodine than non-smokers (P = 0·059). Female abstainers had the highest iodine intake compared with younger (P = 0·048) and older (P = 0·069) female drinkers. An inverse relationship between drinking levels and iodine intake was statistically significant only for younger females (P = 0·034 for linear trend). A similar trend was observed among males.
Table 3 Age- and multivariate-adjustedFootnote * geometric mean level of iodine intake (μg/d) of adults in the SU.VI.MAX study (1994–6), calculated as the average of intake from six 24 h dietary records by sex and age category, according to various demographic and lifestyle characteristics

* Full model, means are adjusted for age, food energy and all other characteristics included in the table and back-transformed following regression.
† Excludes fifty-five persons for whom marital status was unknown.
‡ For geographical representation, see reference Reference Valeix, Zarebska, Préziosi, Galan, Pelletier and Hercberg8.
§ Excludes eight persons for whom the degree of urbanization was unknown.
There were significant overall regional differences in mean adjusted iodine intakes for both males and females, with more ‘protective’ iodine intakes observed in the western region compared with the eastern region. Both males and females living in the north-east (‘Alsace/Lorraine/Franche-Comté/Champagne-Ardenne’) had the lowest adjusted iodine intake: males consumed almost 21·3 μg (13·2 %) less iodine per day than those living in ‘Bretagne’ (P < 0·05), while females aged 35–44 and 45–60 years consumed 20·8 μg (15·4 %; P < 0·05) and 20·4 μg (14·2 %; P < 0·05) less iodine per day, respectively, than those living in ‘Normandie’ (other variables remaining constant). Females living in suburban areas had lower adjusted iodine intakes compared with their rural counterparts (P = 0·013).
Male and female drinkers had a slightly higher risk of MII than male and female abstainers (Table 4). We observed a lower risk of LII and MII for males who reported an intermediate education level and had light physical activity level, respectively. Males who lived in the north-east region had an increased risk of MII (OR = 1·24, 95 % CI 1·03, 1·51) compared with those living in ‘Ile-de-France’. Males living in ‘Bretagne’ had a reduced risk of LII (OR = 0·83, 95 % CI 0·71, 0·98) and MII (OR = 0·90, 95 % CI 0·83, 0·97) compared with those living in ‘Ile-de-France’. Conversely, males who lived in the ‘Rhône-Alpes’ and the north-east had a higher risk of MII compared with the reference region (‘Ile-de-France’). Relative to the reference group, females with an intermediate or a high education level (P for trend = 0·003) were less likely to have LII compared with females with only a low education level. Females with a reduced risk of LII were more likely to live in ‘Normandie’ or ‘Bretagne’. Those with a reduced risk of MII were more likely to be highly educated (P for trend = 0·04), abstainers (P = 0·041), to report doing light- or moderate-intensity exercise (P for trend = 0·01) and live in ‘Normandie’ (P = 0·063). Interactions such as education by smoking, education by alcohol consumption and smoking by alcohol consumption were added to the model, but none of the interaction terms was found to be statistically significant.
Table 4 Odds ratios and 95 % confidence intervals for having low (LII) and moderate (MII) iodine intakes according to sociodemographic, geographic and behavioural characteristics among adults in the SU.VI.MAX study (1994–6)
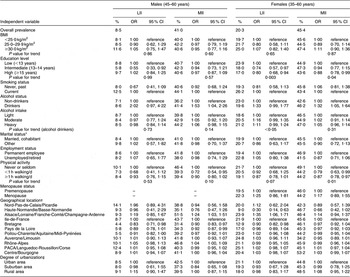
LII, <100 μg/d; MII, 100–150 μg/d; reference, HII, ≥150 μg/d.
Multivariate multinomial logistic regression models were adjusted for age, food energy and all other characteristics included in the table.
Tests for trend are Wald’s test in logistic models.
*Excludes thirty-three persons for whom marital status was unknown.
†For geographical representation, see reference Reference Valeix, Zarebska, Préziosi, Galan, Pelletier and Hercberg8.
‡Excludes five persons for whom the degree of urbanization was unknown.
Discussion
Our results showed borderline low iodine intakes with significant gender differences. On average, males approached the DRI, but females did not meet these recommendations. In our study, no clear age difference in iodine intakes was found although it tended to increase slightly with age in males. Mean iodine intakes among males decreased with age in The Netherlands (22–49 v. 50–64 years, 8·0 %)(Reference Brussaard, Hulshof and Löwik26) and the USA (25–30 v. 60–65 years, 19·5 %)(Reference Pennington and Young27), but increased significantly with age by 4·1 % in the British National Diet and Nutrition Survey (BNDNS; 35–49 v. 50–64 years)(Reference Henderson, Irving, Gregory, Bates, Prentice, Perks, Swan and Farron13). Age had little effect among females, as intakes were observed to decrease by 2·9 % in The Netherlands(Reference Brussaard, Hulshof and Löwik26), 7·7 % in the USA(Reference Pennington and Young27), and to increase by 9·9 % in the BNDNS(Reference Henderson, Irving, Gregory, Bates, Prentice, Perks, Swan and Farron13) and in Denmark (Aalborg, 14·1 %; Copenhagen, 1·7 %)(Reference Rasmussen, Ovesen, Bülow, Jørgensen, Knudsen, Laurberg and Perrild11). Male-to-female differences (in percentage) in iodine intakes in 45–60 years age groups (13·5 %) were consistent with previous studies conducted among adults in Spain (36·4 %)(Reference Capita and Alonso-Calleja28), the BNDNS (26·0 %)(Reference Henderson, Irving, Gregory, Bates, Prentice, Perks, Swan and Farron13), Norway (22·7 %)(Reference Dahl, Johansson, Julshamn and Meltzer14), The Netherlands (18·6 %)(Reference Brussaard, Hulshof and Löwik26), Germany (10·3 %)(Reference Manz, Böhmer, Gärtner, Grossklaus, Klett and Schneider12) and Denmark (5·8 %)(Reference Rasmussen, Ovesen, Bülow, Jørgensen, Knudsen, Laurberg and Perrild11). Gender difference in iodine intake is mainly due to the greater volume of food consumed by males. However, the higher density of iodine in females’ diets suggests an average higher quality of foods consumed by females compared with males. Similar female-to-male differences in iodine density have been reported in Norway (71·1 v. 67·3 μg/4184 kJ (1000 kcal))(Reference Dahl, Johansson, Julshamn and Meltzer14) and the UK (103 v. 97 μg/4184 kJ (1000 kcal))(Reference Pryer, Nichols, Elliott, Thakrar, Brunner and Marmot15). Yet, iodine density was higher in Spanish males’ diets (131·7 μg/4184 kJ (1000 kcal)) than in those of females (127·5 μg/4184 kJ (1000 kcal))(Reference Capita and Alonso-Calleja28). In our study, ANOVA showed a positive relationship between age and iodine density in both males and females. This positive relationship with age is surprising, since energy intake is slightly lower at a higher age. To meet the DRI, females must have a diet with a high iodine density. In our data, 0·8 % of males and 3·1 % of females had iodine intakes <70 μg/d and 8·5 % of males and over one-fifth of females had intakes <100 μg/d. The same figures were 2 % and 6 % for males, and 4 % and 17 % for females in the BNDNS, respectively(Reference Henderson, Irving, Gregory, Bates, Prentice, Perks, Swan and Farron13). In The Netherlands, 3 % of males and 8 % of females had iodine intakes <50 μg/d, and 35 % of males and 64 % of females had intakes <100 μg/d(Reference Brug, Löwik, van Binsbergen, Odink, Egger and Wedel29). In our study, the UL was not reached by any subject when iodine intake was calculated as the mean of six 24 h records. Individual variations of food consumption may lead to more daily extreme amounts (low or high) different from those found in our study. Calculations based on 1 d showed a small proportion (0·3 %) with iodine intake >600 μg/d. In Germany, 0·2 % of iodine intakes were >500 μg/d(Reference Manz, Böhmer, Gärtner, Grossklaus, Klett and Schneider12) and in Norway, 0·6 % were >400 μg/d(Reference Dahl, Johansson, Julshamn and Meltzer14). High-level (97·5th percentiles) intakes in the BNDNS were 428 μg/d for males and 340 μg/d for females(Reference Henderson, Irving, Gregory, Bates, Prentice, Perks, Swan and Farron13).
The geographic distribution of iodine intakes in the present study approximately coincides with the prevalence of human goitre. In the BNDNS(Reference Henderson, Irving, Gregory, Bates, Prentice, Perks, Swan and Farron13), mean iodine intakes among males ranged from 208 μg/d in London and the south-east area, to 245 μg/d in Scotland, while among females, iodine intakes across regions remained fairly unchanged. In Denmark, median iodine intakes in Copenhagen and Aalborg were 149 and 103 μg/d in males and 123 and 97 μg/d in females aged 60–65 years(Reference Rasmussen, Ovesen, Bülow, Jørgensen, Knudsen, Laurberg and Perrild11). Analyses of the association between lifestyle and iodine intakes while controlling for sociodemographic characteristics revealed that smoking habits had a greater effect than any other covariate on iodine intakes (smokers having slightly lower iodine intakes than non-smokers). In the British Longitudinal Birth Cohort, iodine intakes were significantly lower among females aged 16–17 years who smoked than among non- or occasional smokers (150·8 v. 160·3 μg/d, P < 0·01)(Reference Crawley and While30). Some of the associations between smoking habits, drinking habits and iodine intake could be of clinical importance, since smokers and alcohol drinkers may have a higher requirement for iodine(Reference Vestergaard31, Reference Valeix, Faure, Bertrais, Vergnaud, Dauchet and Hercberg32). Females with a high education level and males and females with an intermediate education level had the lowest risk of LII or MII compared with those with a low education level. Physical activity was positively associated with dietary iodine in both males and females. Greater iodine intake suggests a greater increase in overall energy intake. However, the explanation for this difference is not clear, since we found a strong relationship with education and physical activity after adjusting for energy and other behavioural characteristics. Education and physical activity may simply represent better food choices or a greater awareness of health.
In our data, mean iodine intakes per kg BW or per 4184 kJ (1000 kcal) were higher in females than in males. Prevalence estimates of iodine intakes <70 μg/d, based on dietary methods with a long time frame (6 d food records over a 2-year period) and more representative physiological intake parameters (per kg BW), gave results which are roughly comparable: 0·8 % and 2·2 % among males, 3·1 % and 1·7 % among females. Extending these figures to the entire French population using 1991 gender- and age-specific census data, an overall estimated 0·3 million had iodine intakes <70 μg/d and approximately 0·4 million males and 1·8 million females had intakes <100 μg/d. These data refer to a habitual pattern of intake. Long-term low iodine intake may result in exhaustion of thyroid iodine stores and, finally, in goitre. The mild degree of iodine deficiency reported in the female group is of some concern because a relatively high level of iodine-related morbidity was found among females having an iodine status comparable to that found in the present study(Reference Valeix, Zarebska, Bensimon, Cousty, Bertrais, Galan and Hercberg9, Reference Valeix, Dos Santos, Castetbon, Bertrais, Cousty and Hercberg33). Median UIC was in the range for mild iodine deficiency disorders. However, the prevalence of low UIC in our study, which is based on spot urine samples, is likely to be higher than the prevalence based on habitual iodine excretion. The difference in time frames between urine collections and diet records can result in false low correlation coefficients.
A major strength of the present study is that it was a large population-based study. Few studies in the literature have assessed the independent contributions of various risk factors such as unfavourable lifestyle factors for iodine intakes. Although we adjusted for several potential confounders, we cannot rule out the possibility of unmeasured confounding factors. The iodine content of food represents the maximum amount of iodine available to the consumer and not the amount actually utilized or absorbed. First, iodine intake was slightly underestimated in our study because the contribution of iodized cooking salt could not be assessed; second, iodine intake would be further reduced if we took conventional cooking losses into account; third, bioavailability depends on the chemical form of iodine, the nature of the food ingested and the health and nutritional status of the individual (thyroid uptake); and fourth, iodine economy depends on the intake of substances known to impair iodine uptake by the thyroid or incorporation of iodine in thyroid hormones(Reference Gaitan34). The calculation of iodine intake is frequently incorrect due to large regional and seasonal variations of the iodine content in many foods. Nevertheless, the concurrence of the results of our two methods, the calculated iodine intake based on 6 d diet records and iodine excretion, strengthens the results of our study.
In conclusion, dietary iodine intakes among adults from all over France participating in the SU.VI.MAX study (1994–6) were found to be slightly lower than the DRI standards, with significant gender and regional differences. Our study has highlighted that females are an ‘at risk’ group for iodine deficiency. Both physicians and health-care providers should be aware that with low-energy diets (young females, slimming diets, elderly and illnesses), increased requirements of iodine (pregnancy, lactation) and failure to promote iodine-dense diets, iodine status may still be insufficient. In order to further reduce the incidence of iodine deficiency disorders, iodine concentration in salt was recently increased from 10–15 to 15–20 mg/kg. The simulated combined iodization of bread, rusks and flaky pastries with iodized salt during processing has recently been evaluated and appeared to be an effective strategy to control and eliminate iodine deficiency in the French population(35).
Acknowledgements
The study was supported by grant from the Direction Générale de la Santé (Ministère de la Santé et des Solidarités). None of the authors had a personal or financial conflict of interest. The authors’ contributions were as follows: P.V. and S.B. contributed to data analysis, interpretation of the data and writing of the manuscript; P.F. supervised the laboratory measurements; C.E., S.P. and S.H. aided in interpretation of results. We thank Stacie Chat-Yung for reviewing and editing the manuscript.


