The number of children with cardiometabolic risk factors, such as excess abdominal adiposity, insulin resistance, dyslipidaemia and subclinical inflammation, has been increasing in many countries worldwide( Reference Damsgaard, Dalskov and Laursen 1 , Reference Wang and Lobstein 2 ). These metabolic alterations favour the development and progression of chronic non-communicable diseases during childhood( Reference Freedman, Khan and Serdula 3 ) and, consequently, the reduction of life quality and expectancy( Reference Hulsegge, Looman and Smit 4 ).
Studies with adults have identified low Ca intake to be inversely associated with systemic inflammation( Reference Zemel and Sun 5 ), adiposity( Reference Castro Burbano, Fajardo Vanegas and Robles Rodríguez 6 ) and risk of developing diabetes( Reference Pittas, Lau and Hu 7 , Reference Martini, Catania and Ferreira 8 ) and hypertension( Reference Wang, Manson and Buring 9 ), as well as an increase in mortality rate( Reference Asemi, Saneei and Sabihi 10 ).
In children, adequate Ca intake has been associated with better blood pressure( Reference Rangan, Flood and Denyer 11 , Reference Magalhães, Pessoa and Franceschini 12 ) and lower values of body fat and BMI( Reference Skinner, Bounds and Carruth 13 – Reference Dixon, Pellizzon and Jawad 15 ); however, these results are still controversial( Reference Weaver, Campbell and Teegarden 16 , Reference Moreira, Padez and Mourão 17 ). To date, no studies have been found evaluating the relationship between Ca intake and inflammatory markers in children.
Since there is a high prevalence of inadequate Ca intake among children( Reference Oliveira, Silveira and Beghetto 18 – Reference Santos, Martini and Freitas 20 ) and an adequate intake of this mineral may be related to better lipid profile, reduced inflammation and lower adiposity, the aim of the present study was to evaluate Ca intake and its association with cardiometabolic risk factors during childhood.
Methodology
Participants
The present study was a cross-sectional, population-based study carried out with children between the ages of 8 and 9 years who were included in the Survey of Health Assessment of Schoolchildren (Pesquisa de Avaliação da Saúde do Escolar, PASE) and enrolled in one of the public or private schools in the city’s urban area of Viçosa, Minas Gerais, Brazil.
In 2015, this city had seventeen public schools and seven private schools in the urban area, with 1464 children aged 8–9 years enrolled. During sample size calculation, we considered the prevalence as 50 % with multiple outcomes for cardiometabolic risk factors in this population, with a 95 % confidence level, a tolerable error of 5 %, 10 % for losses and 10 % for confounding factors, adding up to a sample of 366 children. However, 378 schoolchildren enrolled in the third and fourth year of primary school were selected by stratified random sampling.
The sample from each school was proportional to the total number of enrolled students by age and sex. Students were selected randomly until the required number of each was completed. All urban schools of the city attended by children of this age range were evaluated (n 24). After the draw, the parents or guardians were invited to participate in the study through a telephone call. We explained all the objectives and methodology to them and the first meeting was scheduled. At this point, each step of the study had been clarified to the parents or guardians, and those who agreed to participate signed a written informed consent.
Children using Ca supplementation were not included, nor were those taking medications or with health conditions that modified the nutritional status, body composition, lipid profile, blood pressure or glucose metabolism of the child. Children who had physical, cognitive or multiple disabilities, and those whose legal guardian could not be contacted after three attempts, were also not included in the research. All children with C-reactive protein (CRP) ≥10mg/l (n 28) were excluded since concentrations of this protein above this value are associated with infections and more serious inflammatory conditions, not subclinical inflammation. Thus, the final sample for the present study consisted of 350 children.
The study was conducted according to the guidelines laid down in the Declaration of Helsinki and all procedures involving human subjects were approved by the Ethics Committee on Human Research of the Federal University of Viçosa (case number 663.171/2014).
Demographic data
Sociodemographic data, such as sex, age, ethnicity, type of school (public or private), area of residence (urban or rural) and family per capita income, were collected by the researchers through a semi-structured questionnaire. Prior to beginning the research, a pilot study had been performed with 10 % of the sample (n 37) in order to adjust the questionnaire as well as other measures evaluated in the research. Pilot children were not included in the final sample of the present study.
Food consumption
To estimate food consumption, three 24 h dietary recalls were applied on non-consecutive days, including one day of the weekend, and filled in according to information provided by the mother/guardian and the child. To increase data reliability, interviewers went through a specific training and during the interviews participants were shown standard utensils and photographic albums with food preparation and pictures distinguishing different portions( Reference Zabotto, Vianna and Gil 21 ). Later, the measures done at each individual’s house were transformed into grams or millilitres to analyse intakes of energy (in kilocalories) and Ca (in milligrams).
We estimated nutrient intakes from the 24 h dietary recall using Diet Pro® 5i software version 5.8. For this, the Brazilian Food Composition Table( 22 ) and the US Department of Agriculture’s Food Composition Database( 23 ) were used.
To evaluate the adequacy of Ca intake, we considered the Estimated Average Requirement according to sex and life stage proposed by the Institute of Medicine( 24 ).
Anthropometry and body composition
Child weight was measured using an electronic digital scale with a capacity of 150 kg and sensitivity of 50 g (Tanita® model Ironman BC 553; Tanita Corporation of America, Inc., Arlington Heights, IL, USA), while child height was measured using a vertical stadiometer divided into centimetres and subdivided into millimetres (Alturexata®, Belo Horizonte, MG, Brazil) according to the norms of Jelliffe( Reference Jellife 25 ). BMI was calculated based on weight and height. To classify children according to their nutritional status, BMI-for-age cut-off points by Z-score were calculated using the WHO Anthro Plus software( 26 ) and classified according to the WHO( Reference de Onis, Onyango and Borghi 27 ). Children were considered to have excess weight when they were classified as overweight or obese by BMI.
Waist circumference was measured using an inelastic measuring tape divided into centimetres and subdivided into millimetres, with measurements taken at the midpoint between the iliac crest and the last rib( 28 ). The 90th percentile of the sample was adopted to classify increased waist circumference due to the absence of cut-off points established for this age group. Waist-to-height ratio (WHtR) was calculated as the ratio of waist circumference to height. Cut-off point for WHtR of ≥0·5 was considered as risk of development of cardiometabolic diseases( Reference Ashwell and Hsieh 29 ).
Body composition of the child was estimated by the dual-energy X-ray absorptiometry method (Lunar Prodigy Advance; GE Medical Systems Lunar, Milwaukee, WI, USA) and was classified according to cut-off points proposed by Lohman( Reference Lohman 30 ).
Biochemical variables
Blood collection was performed by a qualified professional after 12 h of fasting through a venepuncture procedure with disposable material. Samples were collected in a vacuum tube and centrifuged for 15 min at 3500 rpm; then the serum samples were separated into 1·5 ml Eppendorf tubes and stored in an ultra-freezer at −80°C.
Serum concentrations of total cholesterol (mg/dl), HDL cholesterol (HDL-C; mg/dl), LDL cholesterol (LDL-C; mg/dl), TAG (mg/dl) and insulin (μU/ml) were determined using BioSystems model 200 Mindray® equipment (Nanchan, China) as recommended by the manufacturer of the Bioclin® kits (Belo Horizonte, MG, Brazil).
Serum insulin was analysed through chemiluminescence immunoassay using the Elecsys Insulin® test (Roche Diagnostics, Indianapolis, IN, USA) with a detection limit of 0·200–1000 μU/ml. Insulin resistance was estimated by the homeostasis model assessment of insulin resistance (HOMA-IR)( Reference Matthews, Hosker and Rudenski 31 ).
Levels of HDL-C<45 mg/dl, LDL-C≥100 mg/dl, TAG≥100 mg/dl, glucose≥100 mg/dl and fasting insulin >15 μU/ml were considered inadequate( 32 , 33 ). The 90th percentile of the sample was used to classify increases in high-sensitivity CRP and HOMA-IR assays due to the absence of cut-off points established for this age group.
Statistical analysis
The analysis was carried out using the statistical software packages IBM SPSS Statistics® version 24 and Stata version 13. The Kolmogorov–Smirnov test was used to evaluate the normality of the variables. Adjustment was made for intra-individual variability( Reference Fisberg, Marchioni and Colucci 34 ) and for energy by the residual method( Reference Willett 35 ).
We divided the sample according to the 75th percentile of Ca intake and used the Pearson χ 2 test to verify associations between the variables. ANOVA was used for multiple comparisons in tertiles of Ca intake, with application of the post hoc Tukey test to identify the differences between the groups.
The multiple stepwise regression test was performed to verify which major food items contributed to the variability in Ca intake of the children.
Bivariate analysis was performed based on Poisson regression models with robust variance. Cardiometabolic risk factors were considered dependent variables with daily Ca intake as the explanatory variable. Predictive variables that obtained a P value of <0·20 were inserted by the backward method in the multivariate Poisson regression model with robust variance. Variables with a lower level of significance (P≥0·05) were taken one by one from the model. The models were still adjusted for potential confounding factors. The Hosmer–Lemeshow test was used to verify the adjustment of the final model. Prevalence ratio (PR) with 95 % CI was used as an effect measure. During all analyses, a significance level of 5 % was adopted.
Results
Among the participating children (n 350), 52·6 % were female and 51·4 % were 9 years old. The children with the lowest Ca intake were 9 years old, non-white, public-school students, with low HDL-C and high LDL-C (P<0·05; Table 1).
Table 1 Sociodemographic, anthropometric and biochemical variables according to calcium intake among urban schoolchildren aged 8–9 years (n 350), Viçosa, Minas Gerais, Brazil, 2015
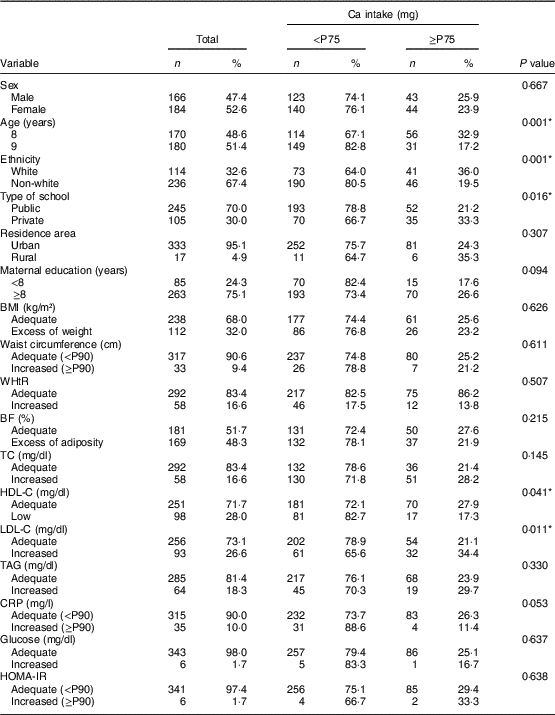
P75, 75th percentile; P90, 90th percentile; WHtR, waist-to-height ratio; BF (%), body fat percentage; TC, total cholesterol; HDL-C, HDL cholesterol; LDL-C, LDL cholesterol; CRP, C-reactive protein; HOMA-IR, homeostasis model assessment of insulin resistance.
* P<0·05 (Pearson’s χ2 test).
After adjusting the results for intra-individual variability, there was a high prevalence of inadequate Ca intake (97·4 %). In addition, the most consumed sources of Ca were ‘milk’ and ‘cheeses and yoghurts’ (R 2=0·66 and 0·13, respectively). There was a moderate correlation between milk consumption and chocolate milk powder (r=0·538, P<0·01). Food items listed in Table 2 explained 66–91 % of the total variability of Ca intake.
Table 2 Main food items consumed that contributed to calcium intake by urban schoolchildren aged 8–9 years (n 350), Viçosa, Minas Gerais, Brazil, 2015
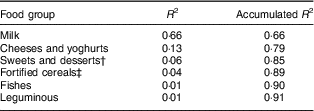
† Ice cream, milkshake, chocolate powder, industrialized chocolate milk, chocolate, sweets in general.
‡ Mucilon, breakfast cereal, milk flour, breads, cookies and cakes.
Individuals with Ca intake in the first tertile had lower mean per capita income (P<0·001; Table 3) and higher serum level of CRP (P=0·012; Fig. 1) when compared with the second and third tertiles.
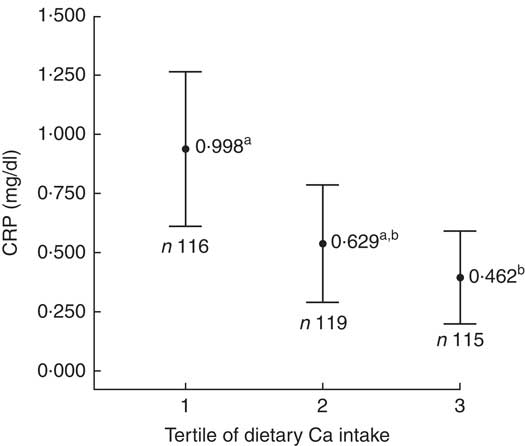
Fig. 1 Mean serum concentration of C-reactive protein (CRP), with 95% CI represented by vertical bars, according to tertile of calcium intake among urban schoolchildren aged 8–9 years (n 350), Viçosa, Minas Gerais, Brazil, 2015. a,bMean values with unlike superscript letters were significantly different: P=0·012*. *P<0·05 (ANOVA with post hoc Tukey test)
Table 3 Sociodemographic, anthropometric and biochemical variables according to tertile of calcium intake among urban schoolchildren aged 8–9 years (n 350), Viçosa, Minas Gerais, Brazil, 2015
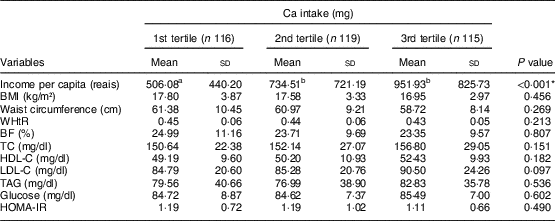
WHtR, waist-to-height ratio; BF (%), body fat percentage; TC, total cholesterol; HDL-C, HDL cholesterol; LDL-C, LDL cholesterol; HOMA-IR. homeostasis model assessment of insulin resistance.
a,bMean values within a row with unlike superscript letters were significantly different.
* P<0·05 (ANOVA with post hoc Tukey test).
In the adjusted regression models, children with Ca consumption in the first tertile (0–341·98mg) presented higher prevalence of increased waist circumference (PR=2·86; 95 % CI 1·01, 8·13; P=0·048) and increased CRP (PR=2·93; 95 % CI 1·21, 7·07; P=0·017), as well as a lower prevalence of increased LDL-C (PR=0·64; 95 % CI 0·41, 0·99; P=0·047), compared with children in the third tertile of Ca consumption (≥485·82 mg; Table 4).
Table 4 Crude and adjusted prevalence ratios (PR) of the association between calcium consumption tertile and cardiometabolic markers among urban schoolchildren aged 8–9 years (n 350), Viçosa, Minas Gerais, Brazil, 2015
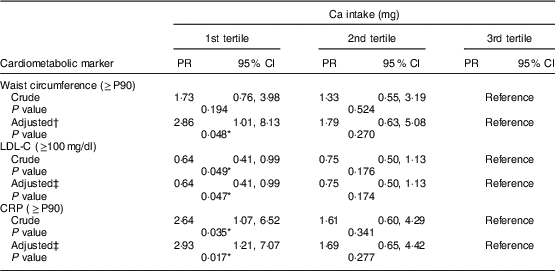
P90, 90th percentile; LDL-C, LDL cholesterol; CRP, C-reactive protein.
* P < 0·05 (Poisson regression).
† Adjusted for sex, age, ethnicity, maternal age and schooling, type of school, sedentary behaviour, and percentage of energy from fat, protein and carbohydrate.
‡ Adjusted for sex, age, ethnicity, maternal schooling, daily number of meals, body fat percentage, sedentary behaviour, and percentage of energy from fat and carbohydrate.
Discussion
Children with lower Ca intake had higher prevalence of increased CRP, increased waist circumference, as well as a lower prevalence of elevated LDL-C.
Higher serum concentration of CRP in children with lower Ca intake may be related to bioactive compounds present in dairy foods, such as Ca, phospholipids, proteins and peptides, which may decrease the inflammatory process in adipose tissue by decreasing the serum concentration of CRP( Reference Zemel and Sun 36 – Reference Astrup 38 ). In research done with adults, Labonté et al. ( Reference Labonté, Couture and Richard 39 ) observed an improvement in concentration of inflammatory markers, including reduction of serum CRP, due to an increased consumption of Ca-containing food sources. On the other hand, other studies with adolescents and adults identified a null effect of dairy intake on the CRP concentration( Reference Zemel and Sun 5 , Reference Ghayour-Mobarhan, Sahebkar, Vakili and Safarian 40 – Reference Schmid, Petry and Walther 43 ). Therefore, since these findings are controversial in adults and no studies have been found with children, the present study highlights the need for longitudinal investigations with child populations to elucidate possible mechanisms involved in the relationship between Ca intake and the presence of subclinical inflammation.
The inverse association between Ca intake and abdominal adiposity identified in the current study corroborates other investigations carried out with 10–12-year-old boys( Reference Chen, Liu and Xue 44 ), 12–19-year-old girls( Reference Castro Burbano, Fajardo Vanegas and Robles Rodríguez 6 ) and 7–18-year-old obese children and adolescents( Reference Czerwonogrodzka, Pyrzak and Majcher 45 ). Major et al. ( Reference Major, Chaput and Ledoux 46 ) identified a possible mechanism to explain the relationship between low Ca intake and abdominal obesity. Adequate Ca intake can reduce the concentration of calcitriol. Therefore, autocrine activation of cortisol synthesis would decrease, leading to less fat accumulation( Reference Da Cunha, Magalhães and Loureiro 47 , Reference Zemel and Miller 48 ). This occurs because calcitriol stimulates the expression of 11-β-hydroxysteroid dehydrogenase-1, which helps in the conversion of cortisone into cortisol, a substance that acts in the accumulation of fat, mainly in the abdominal region( Reference Dougkas, Reynolds and Givens 49 ). Another accepted mechanism is the increase in the oxidative capacity of adipose tissue when there is an adequate intake of Ca. Higher intake of this mineral would induce intracellular Ca content to decrease in adipose tissue, promoting fat oxidation rather than its deposition( Reference Chen, Liu and Xue 44 ).
Children with Ca consumption in the first tertile had a lower prevalence of increased LDL-C. We believe that sugar-rich chocolate powder addition to milk may have contributed to this finding since, in the present study, milk accounted for 66 % of Ca intake. Furthermore, all children who reported to consume milk (n 213) were recorded to do so with chocolate milk powder, which corresponds to 60·8 % of the total sample (n 350). Frequent intake of powdered chocolate by children has been described (19·6–49 %)( Reference Aquino and Philippi 50 , Reference Hinning and Bergamaschi 51 ) and usually associated with milk( Reference Henry, Whiting and Finch 52 , Reference Araujo, Brandão and Araújo 53 ). Ingestion of sugar contributes to an increase in adiposity( Reference Frantsve-Hawley, Bader and Welsh 54 , Reference Lee, Chowdhury and Welsh 55 ) and LDL-C( Reference Murakami and Livingstone 56 , Reference Davis, Spurlock and Ramsey 57 ), since excessive sugar intake is involved in the synthesis of free radicals, such as reactive oxygen species, cytokines and molecular adhesion molecules. These components lead to the formation of oxidized LDL-C, which stimulates the migration of macrophages to form foam cells, resulting in the progression of atherosclerosis( Reference Prasad and Dhar 58 ).
Dairy foods may be high in saturated fats and an elevated consumption of this nutrient is associated with worsening markers of cardiovascular risk( Reference Astrup, Dyerberg and Elwood 59 , Reference Vafeiadou, Weech and Altowaijri 60 ). However, some studies did not find a relationship of fat intake from dairy products with worsening of the lipid profile, inflammation and obesity( Reference Nestel, Chronopulos and Cehun 61 – Reference O’Sullivan, Bremner and Mori 64 ). This may be because Ca forms insoluble soaps with fatty acids, preventing them from being absorbed since Ca causes fatty acids to be bounded to bile salts, preventing their resorption in the intestine( Reference Vaskonen 65 ). Thus, greater fat excretion occurs when there is higher Ca content in the diet( Reference Buchowski, Aslam and Dosset 66 , Reference Christensen, Lorenzen and Svith 67 ).
Another result to be highlighted is the inadequate intake of Ca in 97·4 % of the sample. In fact, Ca is one of the micronutrients with the highest rate of inadequate consumption worldwide( Reference Beal, Massiot and Arsenault 68 ). In the literature, most studies with children and adolescents have identified low Ca intake (88·6–97·6 %), corroborating the results of the current study( Reference Magalhães, Pessoa and Franceschini 12 , Reference Zanchett, Bosco and Arend 69 , Reference Assumpção, Dias and Barros 70 ). Low Ca intake is worrying because this mineral is important for child growth and may be involved with early development of cardiometabolic diseases( Reference Astrup 38 , Reference Major, Chaput and Ledoux 46 , Reference Wang Lang, Manson and Sesso 71 ). However, we do not know if the high prevalence of inadequate Ca intake among children in our study could affect its relationship to the cardiometabolic risk factors, since few children presented adequate Ca intake (n 9·1, 2·6 %). Therefore, studies conducted with a larger sample size are of scientific interest.
In the present study, milk was the main contributor to Ca intake (66 %), followed by cheeses and yoghurts (13 %; Table 3). Milk has a lower cost compared with other dairy products, which may explain its higher consumption( Reference Levy, Claro and Mondini 72 ). On the other hand, dark green leaves did not contribute to explain the variability in Ca intake, since many children (83 %) consumed less than one portion of these foods daily, well below the daily recommendation of three portions( 73 ).
Non-white children with lower socio-economic status (lower income per capita and students from public schools) had lower Ca intakes. In addition, 84·3 % of non-white study children had an income of up to one minimum wage per capita. Epidemiological studies with child and adolescent populations have also shown that individuals with lower income and those studying in public schools present lower intakes of Ca( Reference Assumpção, Dias and Barros 70 , Reference Levy, Claro and Mondini 72 ). Another study evaluating dairy intake according to income, using data from the Household Budget Survey (2002–2003), identified a positive association between Ca intake and income in Brazilian families( Reference Levy-Costa, Sichieri and Pontes 74 ). In this sense, acquisition of dairy products, which are the main sources of Ca, may not be affordable to the budget of low-income families. Thus, they opt for other lower-cost foods.
The current study has some limitations. Because of the cross-sectional design, it is not possible to establish a temporal relationship between Ca intake and cardiometabolic risk factors since the direction of causality is unknown; that is, if the lower consumption of Ca causes cardiometabolic changes or vice versa. In addition, the instrument used to estimate dietary intake (24 h recall) may show poor estimates because it depends on the memory of the children and their legal guardian. However, some good points should be highlighted. We used strategies to reduce memory bias and improve portion estimation, such as interviewer training and the use of photo albums and standard tools. Adjustment of Ca intake was also made to account for intra-individual variability and total energy intake. In addition, the present study is one of the few that have evaluated the relationship of Ca intake with cardiometabolic risk factors and inflammatory markers in the child population; and it is the first Brazilian study within this age group to date.
Conclusion
In conclusion, lower intake of Ca in Brazilian children was found to be associated with excess abdominal adiposity and subclinical inflammation. Prevalence of inadequate Ca intake was high, with the lowest intake being observed in low-income, non-white children and those attending public schools. Furthermore, effective performance of health professionals in monitoring adequate Ca intake is important, especially in poorer communities. Lastly, longitudinal studies are needed to better elucidate the causal direction between low Ca intake and cardiometabolic risk factors in the child population, especially in developing countries such as Brazil.
Acknowledgements
Acknowledgements: The authors thank all children who participated in this work and their parents/guardians; BioClin® (Belo Horizonte, MG, Brazil) for their support in the biochemical analyses and Diet Pro® software for the license granted; and the Coordenação de Aperfeiçoamento de Pessoal de Nível Superior (CAPES) and the Fundação de Amparo à Pesquisa do Estado de Minas Gerais (FAPEMIG) for the scholarships granted to L.G.S., B.K.S.S. and M.S.F. Financial support: This work was supported by the Conselho Nacional de Desenvolvimento Científico e Tecnológico (CNPq) (grant number 407547/2012-6). H.H.M.H. and M.C.G.P. have a fellowship in Research Productivity from CNPq. The CNPq had no role in the design, analysis or writing of this article. Conflict of interest: The authors declare no conflict of interest. Authorship: L.G.S. assisted the conception and design of this work, analysis and interpretation of the data, conducted the literature search, as well as wrote the manuscript. B.K.S.S. contributed to analysis and interpretation of the data, conducted the literature search, as well as wrote the manuscript. M.S.F. assisted in data collection, analysis and interpretation of the data, and revised and approved the final version to be published. M.C.G.P. revised and approved the final version to be published. H.H.M.H. assisted in the interpretation of results and approved the final version to be published. J.F.N. designed the study including the data collection and coordinated, supervised and approved the final version to be published. Ethics of human subject participation: This study was conducted according to the guidelines laid down in the Declaration of Helsinki and all the procedures involving human subjects were approved by the Ethics Committee on Human Research of the Federal University of Viçosa (case number 663.171/2014). Moreover, this project was presented to the Municipal Department of Education, the Regional Superintendent of Education and principals of schools. All participants, as well as their responsible parents/guardians, were informed about the objectives of the research and written informed consent was obtained from all children’s parents.


