Regular adequate consumption of fruits and vegetables may be protective against chronic disease such as cardiovascular diseases and some cancersReference Riboli and Norat1–Reference Bingham, Day, Luben, Ferrari, Slimani and Norat6. Indeed, inadequate consumption of fruit and vegetables is a major risk factor contributing to the worldwide burden of diseaseReference Lock, Pomerleau, Causer, Altmann and McKee7, Reference Pomerleau, Lock and McKee8. Eating more fruit and vegetables may be the single most important dietary change needed to reduce the risk of these chronic diseasesReference Miller, Shiell and Stafford9.
To help reduce chronic disease, the World Health Organization and the Food and Agriculture Organization of the United Nations ask countries to conduct targeted campaigns to increase the consumption of fruit and vegetables10, asserting that effective health communication ‘has the capacity to create awareness, improve knowledge and induce long-term changes in individual and social behaviours’11.
The Western Australian Health Department’s Go for 2&5® fruit and vegetable social marketing campaign aimed to increase awareness of the need to eat more fruit and vegetables and to encourage increased consumption. The present paper reports results using an evaluation framework based on behaviour-change theory, which included reach or awareness of the campaign; knowledge of the recommended intake for fruit and vegetables; self-perception of current intake; and self-reported fruit and vegetable intake.
Although there is agreement on the need to increase fruit and vegetable consumption, there are differences in the classification of fruit and vegetables, in what constitutes a serving and thus in the recommended number of servingsReference Miller, Pollard and Coli12. The Australian Government’s food selection guide recommends that adults over the age of 18 years consume at least two servings of fruit and five servings of vegetables each dayReference Smith, Schmerlaib and Kellett13. A serving of vegetables is equivalent to 75 g and includes salad and cooked vegetables, potatoes, tomatoes and avocados, while a serving of fruit is equivalent to 150 g. In 2000, Western Australian adults reported consuming a mean of 1.6 servings of fruit and 2.6 servings of vegetables daily.
Health promotion theory and pre-campaign research guided campaign development. While most adults were aware that fruit and vegetables were good for them, they did not know the recommended level of intake and did not perceive a need to increase their intake. Lack of time, difficulty in preparation (particularly for vegetables) and incorrect perception about the adequacy of fruit and vegetable intake were the barriers to increasing intake. The campaign objectives were to increase knowledge of the recommended number of servings of fruit and vegetables, improve perceptions of the need to eat more fruit and vegetables (particularly vegetables), and reduce the barriers to intake through communicating the ease of preparing and eating vegetables.
The meal main preparer and the household grocery shopper were the target groups, considered to have the greatest influence on the family diet. Most adults (88%) in pre-campaign surveys considered themselves as either the main household food shopper or had shared responsibility for food shopping.
The Go for 2&5® campaign, launched in March 2002, was implemented for three years until June 2005. The comprehensive range of strategies included mass media advertising (television, radio and press) supported by public relations events, publications (including cookbooks), point-of-sale promotions, school-based activities, community activities and a website (www.gofor2and5.com). The Go for 2&5® campaign logo and colourful animated characters, based on well-known television personalities made from fruit and vegetables, were used to deliver the message. Advertising propositions were clear and simple: initially ‘It’s easy to get an extra serving of vegies into your day’, followed by the more intrusive self-assessment question ‘How many servings of vegies did you really eat today?’ in 2003.
Method
The campaign development and evaluation framework (Fig. 1), adapted from Fishbein and AjzenReference Fishbein and Ajzen14, EggerReference Egger15 and Flay and CookReference Flay, Cook, Rice and Atkin16, was designed to assess values, beliefs, knowledge and behaviour. Flay and CookReference Flay, Cook, Rice and Atkin16 surmised that advertising, particularly social marketing, rarely changes behaviour directly but rather works by initially creating (or maintaining) awareness; modifying or reinforcing perceptions; and providing relevant behavioural motivators to influence the target audience’s attitudes about an issue. Then, as attitudes change, an increased propensity to behave differently results.

Fig. 1 Adapted phases between knowledge and behaviour for fruit and vegetable consumption (source: adapted from Fishbein and AjzenReference Fishbein and Ajzen14 and EggerReference Egger15)
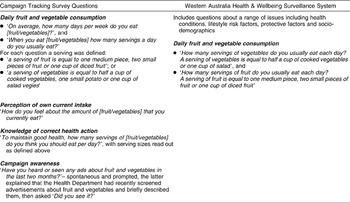
Two independent surveys demonstrated the impact of the campaign: the Campaign Tracking Survey (CTS) monitored advertising, awareness, knowledge and perceptions, attitudes towards fruit and vegetable consumption, and self-reported intake; and the Health Department’s Health & Wellbeing Surveillance System (HWSS) provided data on self-reported fruit and vegetable intake using short questions based on those validated against 24-hour intakeReference Marks, Webb, Rutishauser and Riley17. Table 1 outlines key questions from each survey.
Table 1 Survey instruments and measures

Prior to any campaign mass media activity, a ‘pre-campaign’ baseline telephone survey of 300 adults in the Perth metropolitan area was undertaken. From October 2002 to May 2006, ‘continuous tracking’ surveys of 30 people each week for 33 months were conducted to measure campaign impact, including 12 months after campaign cessation. The computer-assisted telephone interview (CATI) method was used to collect information from the television advertising audience of adults aged 25 to 44 years living in the Perth metropolitan area (75% of the population of Western Australia resides in Perth). Telephone numbers were generated by a strict random sampling approach from the electronic White Pages. A 47% participation rate was achieved, resulting in 3578 completed interviews. Data were weighted by age and gender. Prevalence and means were calculated using the Statistical Package for the Social Sciences (SPSS 14.0 for Windows; SPSS Inc., 2004). Tests for statistical significance by time period and subgroup were conducted using standard t-tests and confidence intervals.
The second survey, HWSS, interviewed Western Australian adults aged 18 years and over about issues including health conditions, lifestyle risk factors, protective factors and sociodemographics. Pre-campaign information was collected at a single time point in 2001, then continuously from March 2002 using CATI methodology. Monthly samples were identified using electronic White Pages and a stratified random sample approach with over-sampling in rural and remote areas. A 78–80% response rate was achieved, higher than the CTS, possibly because respondents were sent an initial letter prior to being telephoned. HWSS data were weighted to adjust for rural over-sampling, age and sex. The analysis includes adults aged 18 years and over in the April 2001 pre-campaign (n = 4274, comprising 1748 males and 2526 females) and from March 2002 to July 2006 (n = 27 153, comprising 11 288 males and 15 865 females).
Prevalence estimates, with 95% confidence intervals, for the number of servings of fruit and vegetables consumed from March 2002 to July 2006 were conducted using SPSS 14.0. The data were examined for consumption trends over time and pre- and post-campaign using time-series analysis. Regression modelling was used to determine if the trends noted were related to time and to explore any post-campaign changes. Auto-regression was used to correct for serial autocorrelation. Curtin University and the Department of Health granted research and ethics approval.
Results
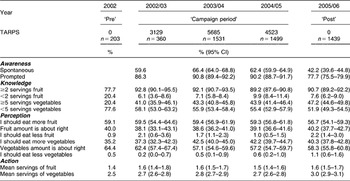
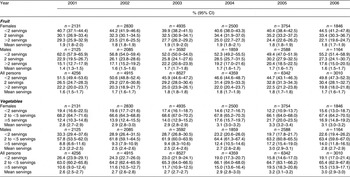
Table 2 shows annual campaign recall, changes in attitudes and beliefs, and self-reported behaviour from the CTS. Table 3 shows annual changes in self-reported fruit and vegetable intake from the HWSS.
Table 2 Campaign awareness, knowledge, attitudes and beliefs towards fruit and vegetable consumption, by year, of persons aged 25–45 years in Perth metropolitan area, Western Australia, 2002 to July 2006 (source: Campaign Tracking Survey)

CI – confidence interval; TARPS – a standard measure of weekly volume of television advertising weight scheduled to reach the target audience18.
Table 3 Fruit and vegetable consumption, by year and gender, of persons aged 18 years and older, Western Australia, 2001 to July 2006 (source: Western Australia Health & Wellbeing Surveillance System)

CI – confidence interval.
Campaign recall increased during the intervention: 62.4% of respondents were spontaneously aware of the Go for 2&5® campaign in 2005 after three years and 90.2% were aware when prompted with a description, the values declining significantly at 12 months post-intervention to 42.2% spontaneously and 77.7% when prompted (see Table 2).
Prevalence of correct knowledge of the recommended number of servings of fruit and vegetables also increased significantly over the campaign period, from 77.7% to 89.2% for fruit and from 20.4% to 43.9% for vegetables. Knowledge continued to increase in the 12 months after the intervention, with 90.7% reporting correct recommendations for fruit and 47.2% reporting correctly for vegetables in 2006 (see Table 2).
Pre-campaign in 2002, the proportion of adults who thought they should eat more fruit (59.1%) was higher than for vegetables (35.2%). This proportion did not change significantly for fruit during the campaign period (59.3% in 2005) or the post-intervention year (56.7%). The proportion who felt they should eat more vegetables increased significantly to 42.2% in 2005, then decreased significantly to 40.3% in 2006 (see Table 2).
The HWSS showed that total mean daily fruit and vegetable intake by Western Australian adults aged over 18 years increased by 0.8 servings over the campaign period, an increase of 0.2 servings of fruit (not significant) and 0.6 servings of vegetables (significant at P < 0.05) (Table 3). At 12 months post-intervention, consumption levels declined by 0.1 servings of fruit and 0.2 servings of vegetables – a net decline of 0.3 servings.
The increase in vegetable intake was observed across all consumption levels but was most pronounced for males with very low consumption. In 2001, 26.4% of respondents consumed less than two servings of vegetables each day, declining significantly to 15.8% by 2005 but rebounding to 19.1% at 12 months post-campaign. Although males’ fruit and vegetable intakes were less than females’ at baseline and throughout the campaign, there was a net increase in male intake of 1.0 serving of fruit and vegetables between 2001 and 2005. Mean male fruit intake increased from 1.4 servings in 2001 to 1.7 in 2005, and mean male vegetable intake increased significantly from 2.3 servings in 2001 to 3.0 in 2005 (see Table 3).
Time-series auto-regression analysis confirmed a significant increase in vegetable consumption over the campaign period but no significant change in fruit consumption, as shown in Fig. 2. The interrupted time-series analysis showed for both fruit and vegetables that there was a significant decrease in mean consumption from June 2005, when the campaign stopped. Overall, the proportion of the population who reported eating two or more servings of fruit and five or more of vegetables daily increased significantly from 7.0% in 2001 to 13.4% in 2005.

Fig. 2 Trends for fruit and vegetable consumption, persons aged 18 years and older, Western Australia, March 2002 to July 2006
Discussion
The intervention reached the target audience, with prompted campaign awareness in 90.2% of those surveyed in 2005, generated mainly through high-profile television advertising. Changes in each component of the evaluation framework were seen over the intervention period, with significant increases in proportions of the population who reported correct knowledge of recommended health action, perception of need to increase own current intake and self-reported consumption (particularly vegetables).
Population estimates showed significant increases in mean vegetable intake over the intervention period, particularly for men, and a significant decline at 12 months post-intervention. Increases in intake were seen across the continuum of intakes, with the greatest effect at lower intakes. The effect is similar to, although not directly comparable with, other fruit and vegetable intervention studiesReference Knai, Pomerleau, Lock and McKee19, Reference Pomerleau, Lock, Knai and McKee20.
Although there was no defined control group, comparative fruit and vegetable consumption data – obtained using a similar methodology to the WHSS survey21 – for two other Australian states where a campaign did not occur show consumption prevalence in 2004 lower than that in Western Australia (WA) and similar to WA pre-campaign figures in 2001 (Table 3). In 2004, 91.8% of adults in New South Wales (NSW) and 91.5% in South Australia (SA) were consuming four or fewer servings of vegetables per day, compared with only 85.1% in WA (89.4% consuming less than five servings in 2001). For fruit, 53.1% of adults in NSW and 60.0% in SA were consuming one or no servings of fruit per day compared to only 46.9% in WA (51.5% consuming less than two servings in 2001).
Results should be interpreted keeping in mind that the evaluation was action research with population monitoring, not a controlled research design. Impact was assessed by pre-campaign baseline, tracking during the campaign period, and 12-month post-campaign data. The continuous tracking method monitored the build of campaign awareness and impact. Trends in awareness, perceptions, intentions and consumption are consistent with campaign advertising and suggest a causal relationship. There were no similar campaigns at the time and no obvious or logical influences other than the Go for 2&5® campaign over the tracking period. However, analyses are descriptive and are limited in determination of causal relationships.
The greater impact for vegetables than for fruit is not surprising, given the greater emphasis on increasing vegetable consumption in campaign television advertising. Ball et al.Reference Ball, Crawford and Mishra22 suggest that fruit and vegetable intake is related to nutrition knowledge. The effect may also be because baseline intake of fruit, knowledge of recommended intake and perceived intake were closer to the recommended levels than for vegetables.
Conclusion
The Go for 2&5® social marketing campaign was successful in reaching the target audience and achieving the campaign communication objectives of increasing awareness of the recommended servings of fruit and vegetables, and encouraging increased consumption, particularly of vegetables. Awareness of the recommended intake and self-reported vegetable consumption among Western Australian adults increased significantly and the proportion of adults consuming less than two servings of vegetables declined. The impact of the campaign was greatest amongst male low consumers of fruit and vegetables.
The net effect, in terms of population increases in self-reported fruit and vegetable consumption before and after the intervention, was 0.8 servings (0.2 servings of fruit and 0.6 servings of vegetables, or 75 g). The Go for 2&5® campaign evaluation shows that well-executed social marketing campaigns are an effective method to increase awareness of dietary recommendations and to motivate dietary behaviour change. Results demonstrate the importance of implementing social marketing campaigns over an extended period so that incremental growth in knowledge, intentions and behaviour can occur and be maintained.
Acknowledgements
Sources of funding: The Department of Health in Western Australia funded the development, implementation and evaluation of the Go for 2&5® campaign.
Conflict of interest declaration: There is no conflict of interest to declare.
Authorship responsibilities: The Go for 2&5® campaign was managed by C.M.P. M.R.M. advised on campaign development and evaluation; A.M.D. and K.E.C. implemented the HWSS and analysed data; K.J.O’D. and A.J.L. implemented the CTS and analysed data; C.W.B. supervised the writing of the paper as part of the requirement of C.M.P.’s PhD.
Acknowledgments: The authors wish to thank the following people for their contribution to the campaign development and implementation: Jenny Aitken, Meg Clarey, Michelle Hogan, Krista Coward, Cathy Campbell, Jan Lewis and Narelle Norish (Department of Health, WA); and Lindsay Medallia, Alan Taylor and Clive Bingwa (303 Advertising Agency).


