


Along with fruits and vegetables, grain foods are recommended by major national and international guidelines as the bulk of the diet and increasing attention has been given to whole grains specifically, as way to improve nutrient density, reduce the incidence of diet-related non-communicable diseases and move towards a sustainable diet(Reference Herforth, Arimond and Alvarez-Sanchez1,Reference Willett, Rockstrom and Loken2) . However, global intake of whole grains remains substantially lower than optimal levels (estimated to be 125 g/d by the Global Burden Disease Study), and it is among the leading dietary risk factors for death and disability-adjusted life-years, with particular impact on CVD and type 2 diabetes(Reference Mann, Pearce and Seal3,4) . In 2017, 3 million deaths and 82 million disability-adjusted life-years were attributable to low wholegrain intake(4). Previous studies suggest demographic and economic disparities may play a role in this failure to meet recommendations, for example, higher intake of whole grains was found among higher socio-economic subgroups and among non-Hispanic white adults in the USA and a similar scenario was reported in other countries(Reference Mann, Pearce and Seal3–Reference Rehm, Penalvo and Afshin5). Additionally, whole grains, as well as Na, were the only dietary components associated with diet inequalities in São Paulo, Brazil(Reference Mello, Sarti and Pereira6). From this perspective, identifying trends in grain foods consumption is essential to inform policymakers and stakeholders to reduce the incidence of diet-related non-communicable diseases(Reference Rehm, Penalvo and Afshin5).
The required increase in wholegrain foods intake is hindered by the population’s inability to correctly identify these foods, along with the ongoing debate on the definition of what constitutes a wholegrain food(Reference Ross, van der Kamp and King7–Reference Chea and Mobley9). In this sense, the presence per 10 g of carbohydrate of at least 1 g of fibre (≤10:1 ratio) was proposed by the American Heart Association as a metric to identify fibre-rich whole grains(Reference Lloyd-Jones, Hong and Labarthe10). Prior investigations have shown the ≤10:1 ratio as a metric that incorporates overall carbohydrate quality and identifies healthful grain foods(Reference Mozaffarian, Lee and Kennedy11–Reference Fontanelli, Micha and Sales13). In addition, higher intake of foods meeting this ratio was inversely associated with cardiometabolic risk factors related to atherogenic dyslipidaemia and insulin resistance, suggesting that the ≤10:1 ratio is a simple and useful metric to depict healthful grain foods(Reference Fontanelli, Micha and Sales13). Unfortunately, few studies of dietary trends in Brazil investigated grain foods, and most of them did not evaluate if the grains consumed met the ≤10:1 ratio(Reference Mello, Sarti and Pereira6,Reference Andrade, Previdelli and Cesar14) .
To address this knowledge gap, the aim of the current study is to evaluate trends and determinants of the intake of grain foods meeting the carbohydrate:fibre ≤10:1 ratio in the population of São Paulo, Brazil, as well as to estimate projections of the prevalence of intake for the next years. Characterising trends of healthful grain foods in Brazil, a middle-income country where the low intake of whole grains is the leading dietary risk factor for deaths and disability-adjusted life-years(4), could provide evidence to evaluate future scenarios and support corresponding interventions and public policies. Importantly, by exploring such trends in population subgroups is possible to assess potential disparities over the years(Reference Rehm, Penalvo and Afshin5).
Materials and methods
Study population and dietary assessment
This study used data from three editions of the Health Survey of São Paulo (HSSP – Inquérito de Saúde de São Paulo), 2003, 2008 and 2015. This is a cross-sectional, population-based study, designed to evaluate health status and life conditions in a probabilistic sample of urban residents of São Paulo, the most populous city in the Southern Hemisphere, located in southeastern Brazil. Similar sampling procedures were adopted in all survey editions, which used a stratified sampling with two-stage clusters: census tracts and households. Sample size in all editions was designed to estimate proportions of 0·50, with a sampling error of 0·1, considering a 95 % confidence level and a design effect of 1·5. Details of the survey design were previously described(Reference Alves, Escuder and Goldbaum15,Reference Fisberg, Sales and Fontanelli16) .
Participants aged 12 years or more completing a semi-structured questionnaire and at least one 24-h dietary recall during the survey editions were included in the present study. The total sample size was 5801 participants (n 2398 from 2003 HSSP, n 1662 from 2008 HSSP, and n 1741 from 2015 HSSP) (online Supplementary Fig. S1). Among 5617 of these participants with complete demographic and socio-economic data, we investigated features associated with the consumption of grain foods meeting the ≤10:1 ratio and predicted the prevalence of healthful grain food consumers for the next years.
Data collection occurred throughout the year, 7 d/week in all editions of the survey. Trained interviewers conducted a household visit and collected a semi-structured questionnaire regarding demographic and socio-economic data, referred morbidity, use of medications, as well as lifestyle information. The 24-h dietary recall was collected during the household visit from individuals who were previously randomly selected. Dietary intake data collection used the multiple-pass method to enable complete 24-h recalls(Reference Raper, Perloff and Ingwersen17). Information was converted into nutrients using Nutrition Data System for Research software version 2014 developed by the Nutrition Coordinating Center, University of Minnesota, Minneapolis, MN, USA. Food nutritional values were compared with the ones available in Brazilian national food composition tables(18,19) . The protocol and data collection were documented by Fisberg et al. (Reference Fisberg, Sales and Fontanelli16).
Grain food products
All foods reported in the 24-h dietary recall were evaluated, and all recipes and mixed dishes were disaggregated into their ingredients. Grain products were identified using the United States Department of Agriculture ‘grain products’ food group, which includes the following subcategories: (1) flour and dry mixes; (2) yeast breads and rolls; (3) quick breads; (4) cakes, cookies, pies, pastries and bars; (5) crackers and salty snacks from grain products; (6) pancakes, waffles, French toast and other grain products; (7) pastas, cooked cereals and rice; (8) cereals, not cooked or not specified as cooked; (9) grain mixtures, frozen plate meals and soups; and (10) meat substitutes, mainly cereal protein(20). For each item, we used the contents of total carbohydrate and dietary fibre to assess the carbohydrate:fibre ratio.
Each participant’s consumption of grain foods meeting the ≤10:1 ratio was evaluated as a percentage of energy in order to assess the contribution of these foods to dietary composition. We also classified participants as consumers of grain foods meeting the ≤10:1 ratio if they reported the intake of at least one grain food meeting the ≤10:1 ratio in the 24-h dietary recall, regardless of the amount consumed. Those who did not report any grain food meeting the ≤10:1 ratio were considered nonconsumers. Likewise, total grain food intake was investigated as a percentage of energy, and participants were classified according to whether or not they consumed these foods.
Demographic, socio-economic and lifestyle data
Demographic, socio-economic and lifestyle data were assessed using a standardised questionnaire. The age group was categorised as 12–19, 20–59 and 60 years or more according to the definitions of WHO and Brazilian Statute for Children and Adolescents(21,22) . Education level was categorised as less than high school graduate, high school graduate/equivalent and college or some college. Individual education was considered to classify participants aged 20 years or more, and the householder education was used for adolescents. We estimated family income by summing the monetary income reported by all family members and dividing by the number of family members and classified this value as ≤1 minimum wage, >1 and ≤3 minimum wages, >3 minimum wages and ‘do not know’. Minimum wage was Brazilian Reals (BRL) 480·77 in 2003 (equivalent to USD 119·28, 1 USD = 4·0 306 994 BRL at 30 December 2019, Brazilian Central Bank), BRL 640·81 in 2008 (equivalent to USD 158·98) and BRL 839·03 in 2015 (equivalent to USD 208·16) – values were deflated to December 2019 using official inflation rates (National Consumers’ Prices Index, Brazilian Institute of Geography and Statistics). Self-reported ethnicity classification was based on Brazilian law for admission to public universities (number 12.711) and was categorised as ‘white or yellow’, and ‘black, brown or indigenous’(23).
Statistical analyses
The mean intake of total grain foods and of grain foods meeting the ≤10:1 ratio was estimated for each HSSP edition, as well as the proportion of the population consuming these foods. We assessed the statistical significance of mean and proportion trends by treating the survey year as a discrete variable in linear and logistic regression models, respectively. To evaluate the impact of demographic and socio-economic shifts among observed trends, models for overall population were adjusted for demographic and socio-economic variables.
In order to assess which foods contributed to total energy intake from grain foods meeting the ≤10:1 ratio in the population of São Paulo from 2003 to 2015, we estimated the corresponding weighted percentage of grain foods meeting the ≤10:1 ratio consumed by the population from the total energy provided from these foods for each survey edition.
Multivariable logistic regression models were performed to investigate determinants of the intake of grain foods meeting the ≤10:1 ratio. Covariates were included based on the presence of a relationship between each covariate and the intake of these foods (P < 0·20) in univariate analysis. The final model included the following variables: age (12–19, 20–59 and 60 years or more), sex, education level (<high school graduate, high school graduate and college or some college), family income per capita (≤1 minimum wage, >1 and ≤3 minimum wages, >3 minimum wages and do not know) and ethnicity (white or yellow; black, brown or indigenous). Model was assessed using a goodness-of-fit test for logistic regression models. In order to evaluate potential heterogeneities in demographic and socio-economic characteristics associated with the intake of grain foods meeting the ≤10:1 ratio during study years, we stratified the multivariable model by survey edition. As sensitivity analyses, multivariable logistic regression models were further adjusted for total energy intake (kJ/d) to investigate factors associated with the intake of grain foods meeting the ≤10:1 ratio on an isoenergetic basis(Reference Willett24).
With the purpose of predicting the prevalence of consumers of grain foods meeting the ≤10:1 ratio for the years 2020, 2025 and 2030, we used the coefficients of the multivariable logistic regression (including the same previously mentioned covariates).
Stata version 14.0 (StataCorp) was used for all statistical analyses, a P-value < 0·05 was considered statistically significant. We used the survey module of Stata to account for the complex survey design of the study. Therefore, results were representative of the population of São Paulo aged 12 years or more. Statistically significant trends were mentioned in the text as increasing, decreasing or corresponding expressions.
Results
Characteristics of the study population
From 2003 to 2015, the population aged 60 years or more increased in the city of São Paulo, whereas the proportion of individuals aged between 20 and 59 years decreased (online Supplementary Table S1). The proportion of the population with 3 or more minimum wages of income declined, and there was an increase in those reporting ‘not known’ for information about family income. Regarding ethnicity, the proportion of individuals who self-reported black, brown or indigenous ethnicity increased.
Trends in grain foods intake
Considering the total population, the intake of total grain foods was 39·2 % of energy (%E) in 2003, 36·9 %E in 2008 and 38·0 %E in 2015, and there was no difference from 2003 to 2015. However, after adjusting total population trends for socio-economic and demographic characteristics, a decreasing trend was found for total grains in 2015 compared with 2003 (–1·2 %E, P = 0·002). Declining trends were also found among older individuals (–2·8 %E), females (–3·3 %E), those with educational level below high school graduate (–2·5 %E), with family income per capita less than 1 minimum wage (–27 %E) and between 1 and 3 minimum wages (–2·5 %E) and those who self-reported black, brown or indigenous ethnicity (–2·4 %E) (Table 1).
Table 1 Trends in percentage of energy intake from total grain foods and from grain foods meeting the ≤10:1 ratio by demographic and socio-economic characteristics in the population of São Paulo aged 12 years or more based on the Health Survey of São Paulo 2003, 2008 and 2015
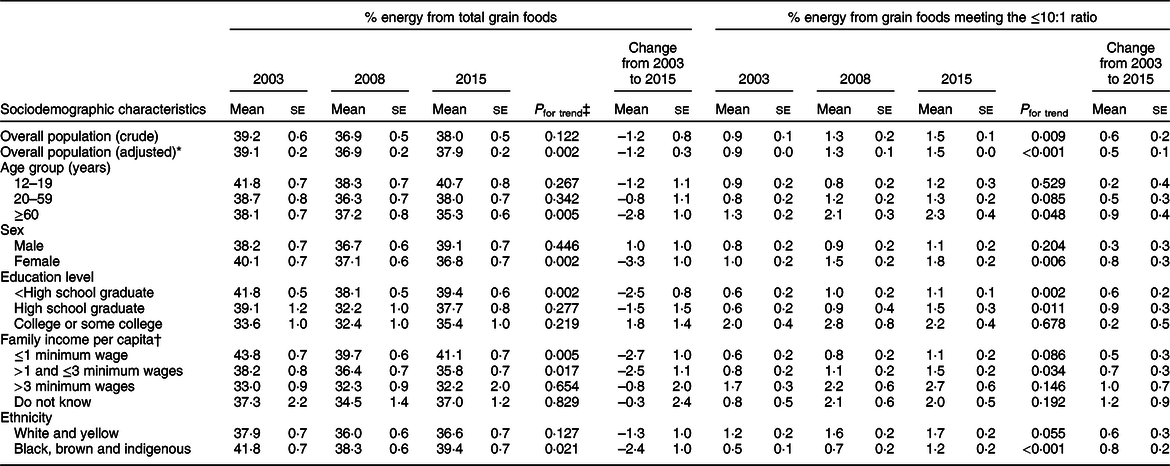
* Values obtained from multivariable linear regression models adjusted for age (12–19, 20–59 and ≥60 years), sex (male and female), education level (<high school graduate, high school graduate and college or some college), family income per capita (≤1 minimum wage, >1 and ≤3 minimum wages, >3 minimum wages and do not know) and ethnicity (‘white and yellow’, ‘black, brown and indigenous’).
† Minimum wage was Brazilian Reals (BRL) 480·77 (USD 119·28) in 2003, BRL 640·81 (USD 158·98) in 2008 and BRL 839·03 (USD 208·16) in 2015.
‡ P-values from linear regression models.
The intake of grain foods meeting the ≤10:1 ratio was only 0·9 % E in 2003, 1·3 %E in 2008 and 1·5 %E in 2015, and there was an increase during this time (+0·6 %E). Similar estimates were obtained after adjusting total population trends for socio-economic and demographic characteristics. A positive trend was also found among several population subgroups, including older individuals (+0·9 %E), females (+0·8 %E), those with educational level below high school graduate (+0·6 %E) and high school graduate (+0·9 %E), with family income per capita between 1 and 3 minimum wages (+0·7 %E) and those who self-reported black, brown or indigenous ethnicity (+0·8 %E) (Table 1).
From 2003 to 2015, foods contributing to energy intake from grain foods meeting the ≤10:1 ratio consumed by the population of São Paulo slightly changed (Table 2). Popcorn, wheat bread, oats and brown rice were among the main contributors to energy provided from grain foods meeting the ≤10:1 ratio, accounting for approximately 70 % of energy provided from these foods. Importantly, there were few food items meeting this criterion, the ten food items presented for each survey edition accounted for more than 80 % of energy provided from grain foods meeting the ≤10:1 ratio.
Table 2 Foods contributing to energy intake from grain foods meeting the ≤10:1 ratio in São Paulo population aged 12 years or more based on the Health Survey of São Paulo 2003, 2008 and 2015

n, number of participants who consumed the respective food item.
Trends in the proportion of grain food consumers
Nearly the entire population of São Paulo aged 12 years or more consumed at least one grain food from 2003 to 2015, 99·1 and 99·6 % of the population, respectively (online Supplementary Table S2). Among grain foods meeting the ≤10:1 ratio, only 8·7 % of the population consumed at least one food meeting this criterion in 2003, 11·8 % in 2008 and 15·8 % in 2015. However, a positive trend in the proportion of the population consuming these foods was found. The population was 100 % more likely to consume at least one grain food meeting the ≤10:1 ratio in 2015 compared with 2003 (Table 3). Similar estimates were obtained after adjusting total population trends for socio-economic and demographic characteristics. A positive trend was also found among several population subgroups, including individuals aged 20–59 years (+110 %), and 60 years or more (+100 %), males (+70 %), females (+130 %), those with educational level below high school graduate (+220 %) and high school graduate (+100 %), with family income per capita of 1 minimum wage or less (+170 %), between 1 and 3 minimum wages (+130 %), and more than 3 minimum wages (+120 %), those who self-reported white or yellow ethnicity (+80 %), and black, brown or indigenous ethnicity (+260 %).
Table 3 Trends in percentage of population consuming grain foods meeting the ≤10:1 ratio* according to demographic and socio-economic characteristics based on the Health Survey of São Paulo 2003, 2008 and 2015

* Participants who reported the intake of at least one grain food meeting the ≤10:1 carbohydrate:fibre ratio in the 24-h dietary recall.
† Values are mean probability obtained from multivariable logistic regression models adjusted for age (12–19, 20–59 and ≥60 years), sex (male and female), education level (<high school graduate, high school graduate and college or some college), family income per capita (≤1 minimum wage, >1 and ≤3 minimum wages, >3 minimum wages and do not know) and ethnicity (‘white and yellow’, ‘black, brown and indigenous’).
‡ Minimum wage was Brazilian Reals (BRL) 480·77 (USD 119·28) in 2003, BRL 640·81 (USD 158·98) in 2008 and BRL 839·03 (USD 208·16) in 2015.
§ P-values from logistic regression models.
Determinants of the consumption of grain foods meeting the ≤10:1 ratio
In multivariable logistic regression models, the population was 89 and 118 % more likely to consume grain foods meeting the ≤10:1 ratio in 2008 and 2015 compared with 2003, respectively (online Supplementary Table S3 and Fig. 1), and several features were associated with this consumption. Older individuals were 79 % more likely to consume grain foods meeting the ≤10:1 ratio, as well as females (+28 %), those with high school graduate (+59 %) and college or some college (+138 %), with family income more than 3 minimum wages (+135 %) and among those who reporting ‘not known’ for information about family income (+64 %). In contrast, participants who self-reported black, brown or indigenous ethnicity were less likely to consume these foods (–30 %). The OR for factors associated with the consumption of grain foods meeting the ≤10:1 ratio did not materially alter for most demographic and socio-economic variables further adjusting the multivariable model for energy intake (online Supplementary Table S3).

Fig. 1 OR and respective 95 % CI from survey-weighted multiple logistic regression models for demographic and socio-economic factors associated with consumption of grain foods meeting the ≤10:1 ratio by Health Survey of São Paulo edition (2003, 2008 and 2015) and overall. ![]() , 2003;
, 2003; ![]() , 2008;
, 2008; ![]() , 2015;
, 2015; ![]() , overall
, overall
Older individuals presented higher odds of consuming grain foods meeting the ≤10:1 ratio in all survey editions, OR = 1·51 (95 % CI 1·03, 2·19) in 2003, OR = 2·16 (95 % CI 1·33, 3·52) in 2008 and OR = 1·98 (95 % CI 1·25, 3·12) in 2015 (online Supplementary Table S4 and Fig. 1). In 2015, females had higher odds of consuming these foods compared with males (OR 1·44; 95 % CI 1·07, 1·93). High school graduates or those who had college or some college presented higher odds of consuming grain foods meeting the ≤10:1 ratio in 2003, OR = 2·23 (95 % CI 1·35, 3·67) and OR = 4·06 (95 % CI 2·42, 6·81), respectively, but only the highest level of education remained significantly associated with the consumption of grain foods meeting the ≤10:1 ratio in 2015 (OR 1·69; 95 % CI 1·14, 2·51). Higher income levels presented significantly higher odds of consuming these foods since 2008 (OR 2·46; 95 % CI 1·13, 5·39 in 2008 and OR 2·74; 95 % CI 1·45, 5·19 in 2015). Individuals who self-reported black, brown or indigenous ethnicity had lower odds of consuming grain foods meeting the ≤10:1 ratio in 2003 (OR 0·59; 95 % CI 0·37, 0·96) and 2008 (OR 0·56; 95 % CI 0·36, 0·87), but ethnicity was no longer associated with the intake of these foods in 2015.
Prediction for the coming years
Given the low proportion of the population of São Paulo consuming any grain foods meeting the ≤10:1 ratio, and on the other hand, the increase in the prevalence of consumption from 2003 to 2015, we estimated future consumption from recent trends (Fig. 2). In 2020, 20·1 % of the population would be consuming at least one grain food meeting the ≤10:1 ratio based on the univariate model, and this proportion would increase to 25·0 and 30·5 % in 2025 and 2030, respectively. However, the predictions were lower considering the multivariable model (11·7 % in 2020, 15·5 % in 2025 and 20·3 % in 2030) and even lower based on the multivariable model further adjusted for total energy intake (6·7 % in 2020, 9·0 % in 2025 and 11·9 % in 2030).

Fig. 2 Prevalence of the population consuming grain foods ≤10:1 predicted by survey-weighted logistic regression models for the population of São Paulo aged 12 years or more for 2020, 2025 and 2030, based on the Health Survey of São Paulo editions 2003, 2008 and 2015. ![]() , Population consuming grain foods ≤ 10:1 ratio (univariate model);
, Population consuming grain foods ≤ 10:1 ratio (univariate model); ![]() , population consuming grain foods ≤ 10:1 ratio (multivariate model*);
, population consuming grain foods ≤ 10:1 ratio (multivariate model*); ![]() , population consuming grain foods ≤ 10:1 ratio (multivariate model + energy†)
, population consuming grain foods ≤ 10:1 ratio (multivariate model + energy†)
*Multivariable model adjusted for: age group (12–19, 20–59 and 60 years or more), sex (male and female), education level (<high school graduate, high school graduate and college or some college), family income per capita (≤1 minimum wage, >1 and ≤3 minimum wages, >3 minimum wages and do not know) and ethnicity (white and yellow, or black, brown and indigenous).
†Multivariable model + energy (kJ/d)
Discussion
Based on dietary data collected from 2003 to 2015 in a representative sample of urban residents in São Paulo, a growing trend in the intake of grain foods containing per 10 g of carbohydrate of at least 1 g of fibre (≤10:1 ratio) was observed. However, the amounts consumed remained low, from 0·9 %E in 2003 to 1·5 %E in 2015, while total grain intake was approximately 40 %E during this time. The proportion of the population consuming at least one grain food meeting the ≤10:1 ratio also increased from 8·7 % in 2003 to 15·8 % in 2015. Nevertheless, the proportion of the population that would consume any grain food meeting the criterion in 2030 would still only be 20·3 % if we extrapolate trends from earlier surveys. Overall, younger individuals, males, those with lower education levels, lower family income, and who self-reported black, brown or indigenous ethnicity were less likely to consume grain foods meeting the ≤10:1 ratio from 2003 to 2015.
The grains group includes a large number of foods, for example, wheat, rice, and oats, and products derived from them such as bread and pasta. Many of them are staple foods for several populations worldwide, and as a result, the improvement in quality of grain foods could have a profound impact on a population’s diet(Reference Mattei, Malik and Wedick25). From 2003 to 2015, the consumption of total grain foods declined in the population of São Paulo (–1·2 %E) and decreasing trends were seen among older individuals, females, those with lower education and income levels and those who self-reported black, brown or indigenous ethnicity. These population subgroups also presented an increasing trend in the amount of grain foods meeting the ≤10:1 ratio consumed, except for individuals in the lowest income category (family income per capita less than 1 minimum wage), which reinforce the importance of affordability in order to improve the consumption of healthful grain foods. Prior study among low-income adults in the USA found the ability to correctly identify wholegrain foods and the perception of higher cost as the major barriers to increase the consumption of these foods(Reference Chea and Mobley9). Nevertheless, the proportion of the population consuming any grain food meeting the ≤10:1 ratio increased even among lower income categories, from 4 % in 2003 to 12 % in 2015, which points to an improvement during this time.
Price is a strong predictor of food choice and may be one reason for disparities in diet quality(Reference Mozaffarian, Angell and Lang26,Reference Jones, Conklin and Suhrcke27) . From 2002 to 2012, the price of healthier foods was greater than less healthy foods in the UK and the price gap between these food categories has increased(Reference Jones, Conklin and Suhrcke27). We did not assess price of foods meeting the ≤10:1 ratio in Brazil, but prior investigation observed slightly higher prices of foods meeting this criterion in the USA(Reference Mozaffarian, Lee and Kennedy11). Consistent with this, income was associated with the intake of grain foods meeting the ≤10:1 ratio since 2008, and individuals in the highest category of income in São Paulo were 146 and 174 % more likely to consume grain foods meeting the ≤10:1 ratio when compared with those in the lowest category in 2008 and 2015, respectively. Such a difference among income categories suggests the potential role of policies to improve diet quality of the population, but especially targeting low-income subgroups. The inclusion of grain foods meeting the ≤10:1 ratio in food assistance programmes is one option that may help to increase the intake of healthful grain foods and would also contribute to familiarising participants to their taste. Fiscal incentives for healthful grain foods could be an additional alternative to address health disparities accounting for health and possibly environmental impacts in the price of foods(Reference Mozaffarian, Angell and Lang26).
Other noteworthy aspect related to diet-related disparities and influencing the intake of healthful grain foods is ethnicity(Reference Rehm, Penalvo and Afshin5,Reference Mello, Sarti and Pereira6) . In general, individuals who self-reported black, brown or indigenous ethnicity were less likely to consume grain foods meeting the ≤10:1 ratio from 2003 to 2015. However, ethnicity was no longer associated with the intake of these foods in 2015, and there was an increasing trend of healthful grain foods consumption among black, brown and indigenous subgroups. We classified ethnic population subgroups according to the Brazilian law for admission to public universities (number 12 711)(23), an affirmative action that determines the number of public university vacancies that should be fulfilled by self-declared black, brown or indigenous population. By using this categorisation, we were able to account for historical social inequalities that probably influence diet intake and health outcomes(Reference Santos, Souza and Sasaki28).
Given the high prevalence of individuals not consuming any grain food meeting the ≤10:1 ratio (91 % in 2003, 88 % in 2008 and 84 % in 2015), and considering the potential benefits on cardiometabolic risk factors even when small amounts are consumed(Reference Fontanelli, Micha and Sales13), we assessed the prevalence of the population consuming these foods from 2003 to 2015, as well as determinants of this consumption. The proportion of the population consuming any grain food meeting the ≤10:1 ratio increased during this time, from 8·9 % in 2003 to 15·6 % in 2015. In addition, compared with 2003, the population of São Paulo was 89 and 118 % more likely to consume grain foods meeting the ≤10:1 ratio in 2008 and 2015, respectively. Consistent with this, most of the population subgroups presented a growing trend in the prevalence of intake of grain foods meeting the ≤10:1 ratio. Even though the intake of grain foods meeting the ≤10:1 ratio is still low, the rising trends suggest higher availability of these foods in São Paulo’s supermarkets and grocery stores, as found previously for whole grains in other localities. In addition, growing population awareness of their health benefits may have contributed to the observed trends(Reference Mancino, Kuchler and Leibtag29). Consistent with this, diet quality, measured by the Revised Brazilian Healthy Eating Index, improved over 12-years among São Paulo residents, and an increase in whole grains comsumption was also seen(Reference Mello, Sarti and Pereira6). Nevertheless, increasing trends were absent among adolescents, those with college or some college, and those who reported ‘not known’ for information about family income.
Based on previous evidence, the lack of increase of healthful grain foods among adolescents was expected. In general, adolescents and young adults present a poorer diet quality when compared with older age groups, and evidence points to some improvement along with ageing(Reference Mello, Sarti and Pereira6,Reference Imamura, Micha and Khatibzadeh30,Reference Christoph, Larson and Winkler31) . Therefore, interventions targeting this age group are required for long-term health. Schools are potential settings for nutrition policies with the purpose of promoting healthful grain foods(Reference Mozaffarian, Angell and Lang26). School food environment and school meals providing grain foods meeting the ≤10:1 ratio, and curricula focused on nutrition and culinary skills may contribute to increase the intake of these foods at younger ages(Reference Mozaffarian, Angell and Lang26). In Brazil, the National School Meal Program (Programa Nacional de Alimentação Escolar) is one of the largest and most comprehensive programmes in the world, covering the entire country and providing meals for free to students in public schools(32). Recently, foods such as brown rice, whole wheat pasta, wholegrain bread and wholegrain crackers have been included in the meals provided by the programme in the city of São Paulo(33). However, foods are included based on the presence of wholegrain ingredients in a food item, and healthful grain foods may not be selected. Grain products that list the word ‘whole’ or ‘whole grain’ before the name of a grain ingredient anywhere in the ingredient list were found to contain more fibre and less Na compared with food items without these words on the food label. On the other hand, these products also presented more sugars and energy per serving and performed less well when compared with the carbohydrate:fibre ≤10:1 ratio(Reference Mozaffarian, Lee and Kennedy11).
Nutritional knowledge is related to education and income(Reference Spronk, Kullen and Burdon34); however, income was the main factor contributing to diet quality since 2008 according to a previous study performed in São Paulo(Reference Mello, Sarti and Pereira6). Consistent with this, the population consuming grain foods meeting the ≤10:1 ratio in the highest education level presented stationary trends from 2003 to 2015, while the proportion of the population consuming these foods in the highest income category (more than 3 minimum wages) increased from 18·6 to 33·5 % during this time. Nevertheless, the highest level of education remained associated with the intake of grain foods meeting the ≤10:1 ratio in 2015, even accounting for income. Strategies that rely on individual’s characteristics to influence dietary intake, such as dietary guidelines, mass media campaigns and food label strategies could help to encourage the population to consume healthful grain foods(Reference Mozaffarian, Angell and Lang26). Food-based dietary guidelines are an example of government policy that influence food production and consumer decision, and the Brazilian document encourage the consumption of wholegrain foods since 2006(35,36) . However, such interventions should be complemented with different strategies aiming to impact on food choices(Reference Mozaffarian, Angell and Lang26). Refined grains are part of the Traditional Brazilian diet, as well as typical diets from several Latin Americans countries(Reference Cardoso Lde, Carvalho and Cruz37,Reference Kovalskys, Fisberg and Gomez38) . In order to change such a settled food habit, integrated multicomponent strategies are urgently needed. Promoting the ability to correctly identify these foods, accustoming the population to the taste of healthful grain foods, as well as developing cooking skills are pillars of dietary change(Reference Suthers, Broom and Beck39). In addition, interventions in the food system and supply chain with the purpose of changing food availability and affordability may contribute to tackling the low intake of healthful grain foods(Reference Hawkes, Jewell and Allen40).
To our knowledge, this was the first investigation that evaluated trends in healthful grains consumption using the carbohydrate:fibre ≤10:1 ratio. Importantly, this study was performed in a representative sample of residents in a large metropolis of a middle-income country, where the low intake of whole grains was the leading dietary risk for deaths and disability-adjusted life-years in 2017(4). Moreover, prior investigation conducted with the population of São Paulo found that both whole grains and Na consumption were associated with diet inequalities(Reference Mello, Sarti and Pereira6). In addition to previous investigations showing the ≤10:1 ratio as a criterion able to identify healthy grain foods(Reference Lloyd-Jones, Hong and Labarthe10,Reference Mozaffarian, Lee and Kennedy11) , and their intake of which was associated with cardiometabolic risk factors related to atherogenic dyslipidaemia and insulin resistance(Reference Fontanelli, Micha and Sales13). Altogether, evidence supports the need of detailed analysis concerning grain foods meeting the carbohydrate:fibre ≤10:1 ratio. Besides, we further advanced by extrapolating future consumption from recent trends, exposing a scenario where healthful grain food consumption would remain far away from optimal levels in coming years.
Our study has potential limitations that must be addressed. Dietary intake of grain foods meeting the ≤10:1 ratio was based on a single 24-h dietary recall, which does not account for day-to-day variation of intake(Reference Willett24). Population or subgroup mean intake can be estimated from a single 24-h recall administration, but the classification of participants according to their consumption of grain foods meeting the ≤10:1 ratio or not based on a single short-term dietary assessment method does not distinguish true nonconsumers from occasional nonconsumers(Reference Willett24,Reference Haubrock, Nothlings and Volatier41) . Nevertheless, the results found were similar to previous studies assessing whole grains using more than one 24-h dietary recall(Reference Rehm, Penalvo and Afshin5,Reference Tester, Leung and Leak42) . Notably, 24-h recalls were collected by trained interviewers using standardised methods, such as the multiple-pass method and a standardised procedure to detail reported food items(Reference Fisberg, Sales and Fontanelli16,Reference Raper, Perloff and Ingwersen17) . The limited number of foods meeting the ≤10:1 ratio prevented more detailed subgroup analysis by subtypes of grain products from 2003 to 2015. Also, the high number of participants who did not consume grain foods meeting the ≤10:1 ratio limited further analysis regarding the amount consumed. Finally, the HSSP cross-sectional design prevented the investigation on how demographic shifts influenced the evaluated trends.
In conclusion, there was an increasing trend in the consumption of grain foods meeting the ≤10:1 ratio among the population of São Paulo aged 12 years or more from 2003 to 2015. However, the amount consumed and the proportion of the population consuming these foods remained substantially low, with additional findings suggesting a small improvement in the coming years if patterns observed from the most recent surveys do not change. For that reason, complementary and synergetic food policies are urgently needed in order to increase the intake of healthful grain foods and decrease associated disease burden, especially among younger individuals, males, those with lower education levels, lower family income and among black, brown or indigenous ethnicity.
Acknowledgements
Acknowledgements: We would like to thank all fieldworkers and all study participants. We also acknowledge the work on dietary data performed by the Evaluation of Food Consumption Research Group (Grupo de Avaliação do Consumo Alimentar) at University of São Paulo. Financial support: The Health Survey of São Paulo was supported by the São Paulo Municipal Health Department (grant number 2013-0.235.936-0), São Paulo Research Foundation (grant numbers 98/14099-7, 2007/51488-2, 2009/15831–0 and 2012/22113-9), and National Council for Scientific and Technological Development (grant numbers 502948/2003-5, 481176/2008-0, 473100/2009–6, 472873/2012–1, 402674/2016–2 and 301597/2017–0). This work was supported by São Paulo Research Foundation (grant number 2016/18742-1). Conflict of interest: None. Authorship: M.M.F. contributed to conception and design of the study, analysis and interpretation of findings, and drafting the article. C.H.S. and M.A.C. contributed to interpretation of findings, and revising it critically for important intellectual content. R.M.F. contributed to conception and design of the study, data acquisition and revising it critically for important intellectual content. All authors approved the final version to be published. Ethics of human subject participation: This study was conducted according to the guidelines laid down in the Declaration of Helsinki, and all procedures involving study participants were approved by the School of Public Health, University of São Paulo, Brazil Institutional Review Board (certificate of presentation for ethical appreciation no. 32344014.3.3001.0086, no. 30848914.7.0000.5421 and no. 65484517.5.0000.5421). Written informed consent/assent was obtained from all participants.
Supplementary material
For supplementary material accompanying this paper visit https://doi.org/10.1017/S1368980020001342


