Adolescence is a transitional period where the brain matures to achieve its adult structure and functions( Reference Spear 1 ). During this period, a major transformation occurs in the prefrontal areas of the brain, where there is a decline in the grey matter and an increase in the white matter( Reference Steinberg 2 ). The prefrontal areas of the brain are associated with higher-order cognitive functioning which includes reasoning, planning, decision making and execution of goal-directed behaviour( Reference Fuster 3 ). Like any other organ, the brain is constructed from carbohydrate, protein, fat, vitamins and minerals( Reference Benton 4 ). These nutrients are supplied through the diet and account for both structure and functions of the brain( Reference Benton 4 ).
Previous studies have examined the effect of specific nutrients on cognition; for example, provision of glucose( Reference Benton and Stevens 5 ) and micronutrients( Reference Bruner, Joffe and Duggan 6 , Reference Schoenthaler, Bier and Young 7 ) in improving cognitive functioning of school-aged children. Although supplementation has been found to benefit cognition among undernourished children, the findings were inconsistent among well-nourished children( Reference Benton 8 ). This might be due to the complexity of diets and the interrelationships among nutrients and foods that complicate the effects of a single dietary component on health outcomes( Reference Schulze, Hoffmann and Kroke 9 ).
Typically, people do not consume isolated nutrients; instead they consume meals that consist of many foods with combinations of nutrients( Reference Hu 10 ). Dietary patterns describe how foods and nutrients are consumed in combination, and may be able to provide a comprehensive assessment between diet and health outcomes( Reference Hu 10 ). Thus, dietary pattern analysis has become a recent interest in relating diet as a whole rather than specific nutrients to health outcomes( Reference McNaughton, Ball and Mishra 11 ). Dietary patterns can be derived through statistical analysis that is based on the collinearity of nutrients and foods( Reference Hu 10 ). Factor analysis, cluster analysis and dietary indices are the most common methods used in deriving dietary patterns( Reference Hu 10 ). Dietary pattern scores represent the level of adherence to the pattern( Reference Cutler, Flood and Hannan 12 ). Dietary patterns also reflect individual preferences for foods, as more consumption of some foods may usually indicate less consumption of other foods( Reference Kant 13 ).
In the UK, results from the Southampton Women's Survey (SWS) and the Avon Longitudinal Study of Parents and Children (ALSPAC) have shown that dietary patterns in infancy tend to influence cognitive ability in childhood( Reference Gale, Martyn and Marriott 14 , Reference Smithers, Golley and Mittinty 15 ). Children whose diet in infancy was consistent with the infant dietary guidelines pattern, which was characterized by high consumption of fruits, vegetables and home-prepared foods, were found to have better cognitive ability at the age of 4 years than children whose diet in infancy followed the ‘adult foods’ pattern characterized by high consumption of bread, savoury snacks, biscuits, squash, breakfast cereals and chips( Reference Gale, Martyn and Marriott 14 ). Among adolescents, a Western pattern that was characterized by high intakes of takeaway foods, confectionery and red meat was found to be associated with higher behavioural problems( Reference Oddy, Robinson and Ambrosini 16 ). An unhealthful eating pattern characterized by high consumption of sweets and fried foods was found to be associated with poorer school performance( Reference Fu, Cheng and Tu 17 ).
Nutrition plays an important role in cognitive development in the rapid growth period during childhood as it provides the building blocks for neural formation and brain development( Reference Benton 18 ). Inadequate diet and malnutrition during this developmental stage may have lasting negative effects on cognitive development( Reference Benton 18 ). For example, in a longitudinal study in south-east Michigan in the USA, low-birth-weight children were found to have persistently lower cognitive ability throughout their childhood and adolescence than their normal-birth-weight counterparts regardless of socio-economic status( Reference Breslau, Dickens and Flynn 19 ). Nutrition continues to influence short-term cognition, through the provision of energy and nutrients to support cognitive functioning, throughout life( Reference Benton 18 ). Adolescence is an important period where physical and social changes influence eating behaviours and nutritional status( Reference Story, Neumark-Sztainer and French 20 ). Dietary practices during this period may have implications for health later in adult life( Reference Story, Neumark-Sztainer and French 20 ). For example, dietary patterns that developed during this period may lead to overweight and eating disorders in adulthood( Reference Neumark-Sztainer, Story and Hannan 21 ). In many countries, adolescents’ diets have been found to be inconsistent with the dietary guidelines( Reference McNaughton, Ball and Mishra 11 ). Although there are many studies on dietary intakes among adolescents in Malaysia, to our knowledge there is no publication on dietary patterns of adolescents in Malaysia derived from multivariate analysis. In other countries, only recently have studies started to examine the association between dietary patterns and cognitive ability, mostly among infants and children( Reference Gale, Martyn and Marriott 14 , Reference Smithers, Golley and Mittinty 15 , Reference Fu, Cheng and Tu 17 ). Therefore, in the present study we aimed to determine the dietary patterns of a group of Malaysian adolescents and the associations between dietary patterns and cognitive ability of the adolescents.
Methods
Participants and procedures
Adolescents aged 12 to 13 years (n 416; 161 males, 255 females) were recruited from five out of twenty-three urban secondary public schools in the district of Gombak in Selangor, Malaysia. The schools were randomly selected based on a list of public secondary schools registered in Selangor as of 31 January 2011( 22 ). Four out of ten or eleven Secondary 1 classrooms from each school were randomly selected and all students in the selected classes were invited to participate in the study. Permission to conduct the study was obtained from the Ministry of Education Malaysia and Selangor State Department of Education. Ethical approval was obtained from the Medical Research Ethics Committee, Faculty of Medicine and Health Sciences, Universiti Putra Malaysia. Informed consent was obtained from both parents and adolescents who agreed to participate in the study. Only Malay adolescents were included due to language barriers in explaining food consumption to adolescents of other ethnicities.
The population in Gombak District was 629 971 in the 2010 Population and Housing Census of Malaysia, consisting of 62·0 % Malay, 23·4 % Chinese, 12·2 % Indian and 2·4 % from other ethnicities( 23 ). By including only Malay adolescents in the study, about 38·0 % of the population was excluded. A total of 600 adolescents from five selected public secondary schools in the urban areas of Gombak, Selangor were invited to participate in the study. Initially there were 421 adolescents who signed up to participate; however, five did not complete the study. Thus only 416 adolescents participated, giving a response rate of 69·3 %.
A questionnaire on sociodemographic background was sent to parents and collected at each school a week before commencement of the study. Completion of the questionnaire was determined on the day that the questionnaire was collected and the information given was cross-checked with the school registry. Parents with incomplete forms were called to answer the questions by telephone. Data from the adolescents were collected in a counselling room of each of the schools from July 2011 to March 2012. Height and weight of the adolescents were measured using standard procedures on the same day. They were also interviewed on their intakes of ninety-six food items over the past month using a semi-quantitative FFQ. Cognitive assessment was then conducted in a one-to-one manner.
Sociodemographic background and characteristics of the sample
Sociodemographic background was obtained from parents through a questionnaire which sought information on their educational attainment and monthly household income, along with their child's date of birth, sex and ethnicity. Height and weight of the adolescents were measured using standard procedures at school. BMI (kg/m2) was calculated as weight/height2. Z-score for BMI-for-age was determined using WHO AnthroPlus Version 1·0·3 software( 24 ) and categorized using the WHO Growth Reference 2007( Reference de Onis, Onyango and Borghi 25 ).
Semi-quantitative FFQ
The semi-quantitative FFQ was adapted from the Malaysian Adult Nutrition Survey 2003( 26 ). The semi-quantitative FFQ includes ninety-six food items with standardized serving sizes described using natural portions (e.g. 1 whole apple, 1 piece of chicken and 1 slice of pizza) or usual household measurements (e.g. 1 plate of rice, 1 medium bowl of porridge and 1 glass of ultra heat-treated milk). Adolescents were asked the frequency of intake of each food item over the past month and the number of servings per intake.
The frequency of intake of each food item was then converted into servings per day by multiplying the conversion factor of the frequency of intake( Reference Norimah, Safiah and Jamal 27 ) with the number of servings per intake. For example, if an adolescent consumed pizza twice weekly and one piece each time, the servings per day would be 2/7 or 0·29 multiplied by 1, which is equal to 0·29 servings/d. The servings per day of each of the food items were used in the construction of the dietary patterns.
Food grouping
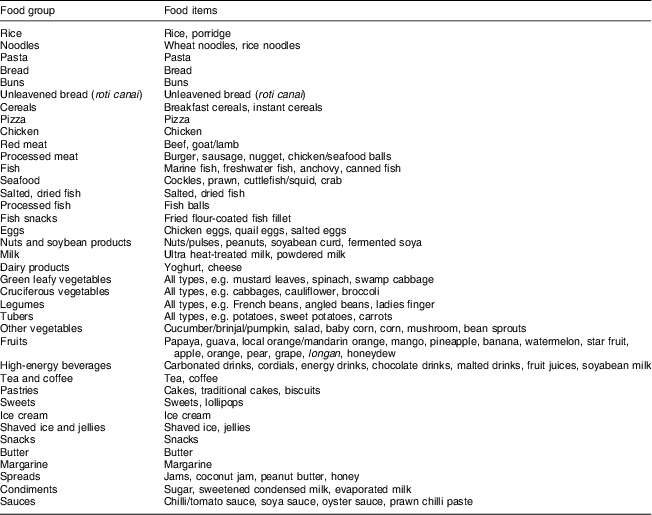
The ninety-six food items in the semi-quantitative FFQ were grouped into thirty-eight food groups based on their nutrient profile similarities and the socio-cultural context of the way the foods are usually consumed (Table 1). Some of the food items were retained due to their distinct characteristics or importance in describing adolescents’ diet. Food grouping is useful in minimizing within-person variations in intake for each of the food items( Reference Hu, Rimm and Stampfer 28 ).
Table 1 Food groupings for construction of the dietary patterns

Cognitive ability
Cognitive ability was assessed using the Wechsler Nonverbal Scale of Ability( Reference Wechsler and Naglieri 29 ). This instrument measures general cognitive ability non-verbally and is therefore useful in assessing children and adolescents of the non-English speaking community( Reference Wechsler and Naglieri 29 ). There are four subtests in the Wechsler Nonverbal Scale of Ability, which are matrices, coding, spatial span and picture arrangement.
The matrices assessed perceptual reasoning. In this task the adolescents were asked to look at an incomplete matrix figure and identify the missing portion from the options provided. Altogether there are forty-one items in the matrices and the difficulty level increases in a progressive manner. Each correct answer is given a score of 1.
The coding task assessed processing speed by asking the adolescent to rewrite a set of numbers in their given symbols within 120 s. A score of 1 is given for each correct answer. The maximum possible score is 144.
The spatial span test assessed working memory. In this test, the adolescent was asked to repeat a sequence of block tapping performed by the researcher in both forward and backward manners. The number of blocks being tapped increases progressively. There are sixteen items in this test, eight items to be tapped forwards and eight items to be tapped backwards. Each item consists of two trials, and each correct trial is given a score of 1.
Picture arrangement assessed perceptual organization. This test requires the adolescent to rearrange a set of pictures so as to tell a logical story within a stipulated time( Reference Naglieri and Brunnert 30 ). There are thirteen items in this test and the level of difficulty increases in a progressive manner. Each correct item is given a score of 2, except for item numbers 11 and 12, which might be given a score of either 1 or 2 according to the response.
For each of the subtests, the raw score is converted into a standardized score that is adjusted for age using a conversion table provided by the test provider. The general cognitive ability score is a composite score of the standardized subtest scores, which include scores on matrices, coding, spatial span and picture arrangement. The standardized score for each of the subtests has a mean of 50 and an sd of 10, whereas the general cognitive ability standardized score has a mean of 100 and an sd of 15( Reference Wechsler and Naglieri 29 ). The internal consistencies (Cronbach's α) for matrices, coding, spatial span, picture arrangement and the general cognitive ability score in the present study were 0·96, 0·85, 0·75, 0·64 and 0·93, respectively.
Data analysis
Data were analysed using the statistical software package IBM SPSS Statistics version 19. Dietary patterns were constructed using principal component analysis. Servings per day of each of the thirty-eight food groups were used in the analysis of the dietary patterns. The factors were rotated by an orthogonal transformation using Varimax rotation in IBM SPSS Statistics. The factors were extracted and retained based on eigenvalues >1, break-point in the scree plot and interpretability of the factors. Food groups with factor loadings less than the absolute value of 0·30 were excluded. The Kaiser–Meyer–Olkin measure of sampling adequacy was 0·76 (Bartlett's test of sphericity, P < 0·001). Dietary pattern scores were calculated by summing the servings per day intake of each food group weighted by the loading of the food groups. Adolescents were given a score for each of the patterns.
The associations between continuous variables and cognitive ability were determined using Pearson product-moment correlation. The mean differences in cognitive ability according to sex and parents’ educational attainment were determined using independent-sample t tests. Comparison between parents’ educational attainment and dietary pattern scores was conducted using the Mann–Whitney U test. A multiple linear regression analysis was conducted using the hierarchical method. Indicators of socio-economic status including monthly household income and parents’ educational attainment were entered in the first block. A dietary pattern that was found to have a significant association with general cognitive ability score at the bivariate level was entered in the second block. The level of significance was set at P < 0·05.
Results
Sociodemographic background, sample characteristics and cognitive ability
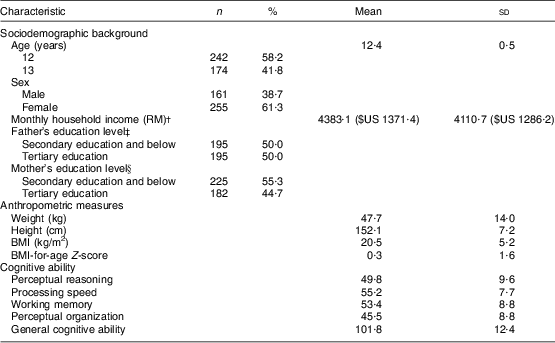
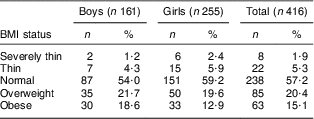
The total number of adolescents who participated in the study was 416, where 38·7 % of them were boys and 61·3 % were girls. The mean age was 12·4 (sd 0·49) years. Most of their fathers attained tertiary education (50·0 %), while most of their mothers attained secondary education (47·2 %). The mean monthly household income in Malaysian Ringgit was RM4383·1 (sd 4110·7), which is equivalent to $US 1371·4 (sd 1286·2). For cognitive ability, the mean general cognitive ability score was 101·8 (sd 12·4). The mean score for perceptual organization was the lowest (mean = 45·5, sd = 8·7) compared with the mean scores of the other cognitive domains (Table 2). The prevalence of overweight and obesity in the total sample was 20·4 % and 15·1 %, respectively. Among girls, 19·6 % were overweight and 12·9 % were obese, while the prevalence of overweight and obesity for boys was 21·7 % and 18·6 %, respectively (Table 3).
Table 2 Study characteristics of the urban adolescents (n 416), Gombak District, Selangor, Malaysia, July 2011–March 2012
RM, Malaysian Ringgit.
†Monthly household income, n 393.
‡Father's education level, n 390.
§Mother's education level, n 407.
Table 3 Distribution of BMI status among the urban adolescents (n 416) aged 12 to 13 years, Gombak District, Selangor, Malaysia, July 2011–March 2012
Dietary patterns
Four major factors were extracted from the principal component analysis and labelled as ‘refined-grain pattern’, ‘snack-food pattern’, ‘plant-based food pattern’ and ‘high-energy food pattern’. These patterns explained 17·8 %, 8·8 %, 6·5 % and 6·0 % of the variance in habitual dietary intakes, respectively. The internal consistencies (Cronbach's α) for the patterns were 0·68, 0·76, 0·63 and 0·51, respectively. Foods that loaded highly on the refined-grain pattern were unleavened bread (roti canai), buns, pizza, pasta and rice. Dairy products, pastries, bread, cereals, fruits, chicken and milk loaded highly on the snack-food pattern. Green leafy vegetables, other vegetables, cruciferous vegetables, nuts and soyabean products, legumes and tubers loaded highly on the plant-based food pattern. The high-energy food pattern was highly loaded with noodles, eggs, processed meat and fish snacks (Table 4).
Table 4 Factor-loading matrix† for the dietary patterns identified (n 416)

†Only food groups with absolute factor loadings >0·30 were retained in each pattern.
Sociodemographic background and cognitive ability
Monthly household income was found to be positively correlated with general cognitive ability (r = 0·24, P < 0·01) and all four domains of cognitive ability (Table 5). Adolescents whose fathers had a tertiary education performed significantly better (mean = 104·6, sd = 12·1) on the cognitive tasks compared with those whose fathers had secondary education or less (mean = 98·6, sd = 11·8). Adolescents whose mothers attained tertiary education also obtained significantly higher cognitive scores (mean = 104·6, sd = 12·7) compared with those whose mothers had secondary education or less (mean = 99·6, sd = 11·7). Girls scored significantly higher (mean = 57·0, sd = 6·8) in processing speed compared with boys (mean = 52·3, sd = 8·1). However, boys had significantly better (mean = 48·4, sd = 8·3) perceptual organization than girls (mean = 43·8, sd = 8·6; Table 6).
Table 5 Correlation (Pearson r) between monthly household income and cognitive ability among the urban adolescents (n 393) aged 12 to 13 years, Gombak District, Selangor, Malaysia, July 2011–March 2012

RM, Malaysian Ringgit.
*P < 0·05; **P < 0·01.
Table 6 Differences (t test) in cognitive ability according to sex and parents’ educational attainment among the urban adolescents aged 12 to 13 years, Gombak District, Selangor, Malaysia, July 2011–March 2012
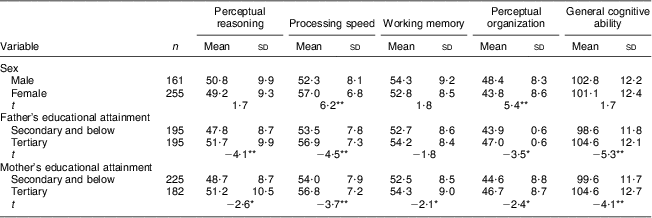
*P < 0·05; **P < 0·01.
Dietary patterns and cognitive ability
The refined-grain pattern was found to be negatively associated with processing speed (r = −0·11, P < 0·05). Scores on the high-energy food pattern were negatively associated with perceptual reasoning (r = −0·11, P < 0·05), processing speed (r = −0·12, P < 0·05) and general cognitive ability (r = −0·15, P < 0·01). The snack-food pattern and plant-based pattern were negatively associated with general cognitive ability; however, the associations were insignificant (Table 7).
Table 7 Correlation (Pearson r) between dietary patterns and cognitive ability among the urban adolescents (n 397) aged 12 to 13 years, Gombak District, Selangor, Malaysia, July 2011–March 2012

*P < 0·05; **P < 0·01.
Parents’ educational attainment and dietary patterns
It was found that adolescents whose mothers had tertiary education had significantly lower scores for the high-energy food pattern (mean rank = 180·1) compared with those whose mothers had secondary education or less (mean rank = 207·6; Table 8).
Table 8 Differences (Mann–Whitney U test) in dietary pattern scores according to parents’ educational attainment among the urban adolescents aged 12 to 13 years, Gombak District, Selangor, Malaysia, July 2011–March 2012

*P < 0·05.
Factors contributing towards general cognitive ability
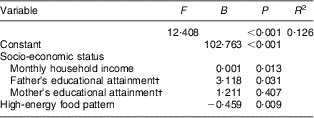
Socio-economic status as indicated by monthly household income, father's educational attainment and mother's educational attainment were found to contribute significantly towards general cognitive ability (R 2 = 0·108, F = 14·024, P < 0·001). The high-energy food pattern was also found to contribute significantly towards general cognitive ability (ΔR 2 = 0·017, ΔF = 6·849, P < 0·01) after controlling for socio-economic status, which included monthly household income, father's educational attainment and mother's educational attainment (Table 9). Overall, socio-economic status and the high-energy food pattern explained about 12·6 % of the variance in general cognitive ability.
Table 9 Multiple linear regression analysis (hierarchical) of factors contributing towards general cognitive ability among the urban adolescents (n 350) aged 12 to 13 years, Gombak District, Selangor, Malaysia, July 2011–March 2012
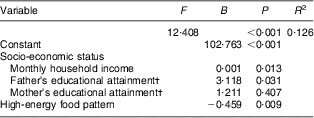
†Reference group for father and mother's educational attainment is secondary education and below.
Discussion
In the present study we have identified four major dietary patterns among the adolescents, which are refined-grain pattern, snack-food pattern, plant-based food pattern and high-energy food pattern. Foods in the refined-grain pattern showed a combination of traditional Malaysian diets and Westernized diets. The snack-food pattern found in the study consists of foods that are commonly found in school cafeterias in Malaysia, which include bread, pastries and fruits. The plant-based food pattern includes vegetables as well as nuts and soyabean products, whereas the high-energy food pattern is characterized by the high loading of noodles, eggs, processed meats and fish snacks. These foods require minimal preparation, where they are usually fried and contain high amounts of fat.
Adolescents who had higher scores for the high-energy pattern in the present study were found to have lower general cognitive ability as well as perceptual reasoning and processing speed. The types of meals in this pattern possess high energy and sodium content and low nutritional value( Reference Von Stumm 31 ). In the Growing Up in Scotland (GUS) study, Von Stumm( Reference Von Stumm 31 ) found that consumption of slow-food meals in contrast with fast-food meals was associated with better cognitive ability among Scottish children. However, the author also found that children from higher socio-economic status performed better in the cognitive tests and that the frequency of consumption of slow-food meals was also higher among them( Reference Von Stumm 31 ). In the present study, monthly household income, which is an indicator of socio-economic status, was also found to have a positive correlation with general cognitive ability. Socio-economic status plays an important role in the cognitive development of an individual( Reference Hackman, Farah and Meaney 32 ). Children from families with low socio-economic status tend to have inadequate nutrient intakes, poorer health status and lack a cognitively stimulating environment( Reference Rosale, Reznick and Zeisel 33 ). However, after controlling for socio-economic status, which includes monthly household income, father's educational attainment and mother's educational attainment in the multivariate analysis, the high-energy food pattern in the present study remained significantly contributing towards general cognitive ability.
Fu et al. ( Reference Fu, Cheng and Tu 17 ) have found that an unhealthful eating pattern, which was described as a high intake of low-quality foods such as sweets and fried foods, was associated with lower school performance among Taiwanese children. Higher parental education level was also found to be negatively associated with unhealthful eating pattern among the children( Reference Fu, Cheng and Tu 17 ). In the present study, we have also found that adolescents whose mothers had tertiary education had lower scores for the high-energy food pattern compared with those whose mothers had secondary education or less. Adolescents whose parents had attained tertiary education also tended to have higher general cognitive ability compared with those whose parents had secondary education or less.
In the 1970 British Cohort Study, Batty et al. ( Reference Batty, Deary and Schoon 34 ) found that higher mental ability of a cohort of children at the age of 10 years was associated with healthier eating habits as adults at the age of 30 years among the cohort. Therefore, it is also possible that adolescents with higher cognitive ability tend to eat more healthily than those with lower cognitive ability.
High consumption of foods in the refined-grain pattern was found to be associated with lower processing speed. The foods in this pattern are carbohydrate-based foods with high glycaemic index (GI). Studies on different types of carbohydrate have found that foods with low GI tend to be more beneficial towards cognitive functioning in children compared with foods with high GI( Reference Wesnes, Pincock and Richardson 35 – Reference Mohd Taib, Mohd Shariff and Wesnes 38 ). This is because high-GI foods contain carbohydrates that break down quickly resulting in a rapid rise of blood glucose levels, while foods with low GI have slower carbohydrate conversion resulting in a more gradual and steady increase of blood glucose levels, thus sustenance of energy to the brain( Reference Schakel, Schauer and Himes 39 ).
It is worth noting that the internal consistencies for the spatial span test, picture arrangement test and most of the dietary patterns were low in our study. Therefore, the results should be interpreted with caution, especially when considering the relationship between the subtests scores of cognitive ability and dietary patterns. The results should not be generalized to the population since there may be other factors that influence the relationship observed between the dietary patterns and cognitive ability among the adolescents.
One of the factors might be breakfast consumption. Previous studies have shown that breakfast consumption improves cognitive ability among children and adolescents( Reference Wesnes, Pincock and Richardson 35 – Reference Ingwersen, Defeyter and Kennedy 37 , Reference Rampersaud, Pereira and Girard 40 ). For example, in a study by Wesnes et al.( Reference Wesnes, Pincock and Richardson 35 ), consumption of breakfast cereals was found to improve memory and processing speed of children aged 9 to 16 years. It has also been found that children who eat breakfast consistently tend to have superior nutritional profiles than those who skip breakfast( Reference Rampersaud, Pereira and Girard 40 ). Children who skip breakfast were also found to be adopting unhealthy dietary habits( Reference Utter, Scragg and Mnurchu 41 ).
Another factor that might influence the relationship between dietary patterns and cognitive ability among the adolescents might be the Fe status of the adolescents. Fe is an essential micronutrient that plays a major role in oxidation–reduction reactions, synthesis and catabolism of neurotransmitters as well as production of myelin( Reference Hulthén 42 ). Fe-deficiency anaemia was found to be associated with poor cognitive and motor development in children as well as behavioural problems in middle childhood( Reference Grantham-McGregor and Ani 43 ). In a local study by Hamid Jan et al.( Reference Hamid Jan, Amal and Rohani 44 ), Fe-deficient children with and without anaemia were found to score significantly lower in problem-solving tests and had a lower general cognitive ability score compared with their healthy counterparts. Fe status was not measured in the present study, however.
Limitations
One of the limitations of the present study is the inclusion of only one ethnic group in Malaysia, namely Malay. This was mainly due to language barriers, where in the pre-test of our study we found that adolescents of other ethnicities had difficulties in naming and explaining the foods that they consumed in the national language, which is Bahasa Malaysia. The variation of diets across ethnicity might also complicate the analysis, thus we decided to include only one ethnic group. Although maternal intelligence was not measured in the study, mother's educational attainment can be used as a proxy for maternal intelligence and this factor was controlled for in the multivariate analysis. However home environment, which may plays an important role in cognitive stimulation, was not measured in our study. Another limitation is the small number of similar studies with which to compare. To our knowledge, there is no publication locally that has examined the dietary patterns of Malaysian adolescents. Thus, the present study's findings might provide an insight into the dietary patterns of adolescents in Malaysia and their associations with cognitive ability among adolescents.
Conclusion
Four major dietary patterns were identified among the urban Malay adolescents in the district of Gombak in Selangor, Malaysia. The major dietary patterns included refined-grain pattern, snack-food pattern, plant-based food pattern and high-energy food pattern. High consumption of foods in the high-energy food pattern was found to be associated with lower scores on general cognitive ability as well as perceptual reasoning and processing speed. The association between the high-energy food pattern and general cognitive ability remained significant even after controlling for socio-economic status, which included monthly household income, father's education attainment and mother's education attainment.
Acknowledgements
Sources of funding: This study was funded by the Research University Grant Scheme (Project number: 04-02-11-1382RU). The Research University Grant Scheme had no role in the design, analysis or writing of this article. Conflict of interest: The authors have no conflicts of interest. Authors’ contributions: A.R.N. conducted the study, performed the data analysis and wrote the manuscript; M.T.M.N. supervised the study and edited the manuscript; M.S.Z. consulted on the dietary pattern analysis; A.R. provided the instrument and training for the cognitive testing.


