Over the past decade in the USA, where obesity has reached epidemic proportionsReference Flegal1, Reference Hedley, Ogden, Johnson, Carroll, Curtin and Flegal2, there has been increasing interest in the role of the neighbourhood environment in influencing dietary behaviour. Neighbourhood socio-economic and racial composition characteristics have been observed to be associated with the location of type of food storesReference Morland, Wing, Diez-Roux and Poole3, Reference Zenk, Schulz, Israel, James, Bao and Wilson4 and access to fresh produceReference Zenk, Schulz, Israel, James, Bao and Wilson5, as well as diet-related health conditions such as coronary heart disease and obesityReference Morland, Diez Roux and Wing6–Reference Diez-Roux, Merkin, Arnett, Chambless, Massing and Nieto8. Location of type of food stores may influence the types of food readily accessible. For example, chain supermarkets invariably carry fresh produce and meats while independent small corner markets and chain convenience stores tend to carry less healthy processed foodsReference Sloane, Diamant, Lewis, Yancey, Flynn and Nascimento9, Reference Block and Kouba10.
Reports of Americans not having access to healthy foods because they live in neighbourhoods where there are few or no food stores that sell affordable fresh produceReference Zenk, Schulz, Israel, James, Bao and Wilson4–Reference Wang, Kim, Gonzalez, MacLeod and Winkleby7 have raised questions about social inequities with regard to the promotion of nutrition and health. The lack of neighbourhood accessibility to healthy foods particularly affects low-income residents, who may be limited by transportation and financial constraints in their ability to obtain fresh produce and healthy foods11. In the USA, most of the studies that have documented a lack of access to fresh produce have related to residents of inner-city neighbourhoods; many of these neighbourhoods have lost chain supermarkets that moved to suburban areas. Over the past two to three decades, small corner markets and chain convenience stores established themselves in these low-income neighbourhoodsReference Kolodinsky and Cranwell12, Reference Pothukuchi13. Further, fast-food restaurants began to mark the American landscape. These changes in the distribution of retail food stores and accessibility of fast-food restaurants paralleled rapid increases in processed food production and fast-food expenditures in the USA. Between 1972 and 1992, total processed food production increased by 40%Reference Schluter and Lee14 while fast-food expenditures increased by more than 130%Reference Jekanowski15.
Processed and fast foods have been implicated in the obesity epidemic. These foods are generally higher in energy density than traditional foods prepared from fresh ingredientsReference Prentice and Jebb16, and energy-dense diets have been shown to undermine normal appetite regulation processes in humansReference Prentice and Poppitt17. Processed and fast foods tend to also be high in fat, salt and/or sugar and low in fibre. In addition, fast food is often consumed with highly sweetened beverages and served in large portionsReference Prentice and Jebb16, Reference Raben, Vasilaras, Moller and Astrup18, Reference Nielsen and Popkin19.
Clearly, on a national level in the USA, the neighbourhood food store environment has been changing. However, it is not clear whether changes in the neighbourhood food store environment have been experienced in all regions in the country, and mirror trends in food consumption behaviour or body mass index (BMI; kg m−2), an established indicator of obesity risk. In particular, while there have been reports on the exodus of supermarkets from lower-income inner-city neighbourhoods starting in the 1960sReference Pothukuchi13, there are few studies on secular changes in the neighbourhood food store environment in less urban areas.
The present paper uses data gathered from 5779 men and women who resided in four mid-sized cities in agricultural regions of California to describe trends in the neighbourhood food store environment (defined by the number and geographic density of food stores of each type in a neighbourhood), as well as food consumption behaviour and overweight risk.
Methods
Data sources
The study used: (1) individual-level food behaviour and sociodemographic data gathered from 3154 women and 2625 men, aged 25–74 years, who had participated in one of four cross-sectional surveys carried out between 1981 and 1990 in four mid-sized cities in California, conducted by the Stanford Heart Disease Prevention Program (SHDPP)Reference Farquhar, Fortmann, Flora, Taylor, Haskell and Williams20–Reference Fortmann and Varady22 and (2) neighbourhood-level food store data obtained from government and commercial sources to describe physical characteristics of the neighbourhood at the time the surveys were conducted. The research protocols were approved by the ethics committees at Stanford University School of Medicine and/or the University of California at Berkeley, and conformed to the principles of the Declaration of Helsinki.
Individual-level data
The SHDPP conducted five cross-sectional surveys from 1979 to 1990 to evaluate the effectiveness of a six-year community-based cardiovascular disease risk intervention. Only data from the second to fifth surveys (1981/82, 1983/84, 1985/86 and 1989/90) were used in the present study because relevant food behaviour data were not collected in the first survey (1979/80). Persons aged 12–74 years who resided in randomly selected households in four California cities – Monterey, Salinas, Modesto and San Luis Obispo (the first two of which received the intervention) – and were English- or Spanish-speaking were eligible to participate in the surveysReference Farquhar, Fortmann, Flora, Taylor, Haskell and Williams20, Reference Fortmann and Varady22. To avoid clustering of risk factors by household, no more than one female and/or one male was randomly selected from each household; the data were stratified by gender. The sample size for each survey averaged 1684 individuals with response rates ranging from 56% to 69%. The respondents represented a stable population who mostly had lived in their communities for a relatively long period of time: 74% for 5 years or longer and only 7% for less than 1 yearReference Nielsen and Popkin19. Since few significant changes in risk factors, morbidity and mortality were found between intervention and control citiesReference Farquhar, Fortmann, Flora, Taylor, Haskell and Williams20–Reference Fortmann and Varady22, data from all cities were combined for this analysis.
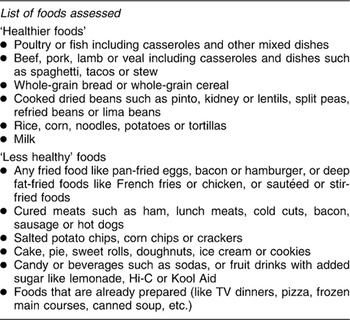
Survey and clinical data were collected during a two-hour examination by nurses and other research staff trained in diet assessment, height and weight measurement, and other clinical and survey procedures. Food behaviour information was obtained by assessing the eating habits and frequency of consumption of selected foods using an interviewer-administered questionnaire. The questions asked sought to determine how often or whether the respondents ate selected foods (see list in Table 1). Most of these questions determined whether the food was eaten the day before the interview. Height and weight were measured using standardised protocols. In addition, sociodemographic information (age, race/ethnicity, education, household income) was obtained by questionnaire.
Table 1 Assessment of food behaviour
A brief non-respondent questionnaire was administered with individuals who declined to participate (75% of whom responded). There were no significant differences in age, sex and BMI (all P ≥ 0.20), and only slight differences in educational level (mean: 13 vs. 12 years of education) for respondents vs. non-respondentsReference Farquhar, Fortmann, Flora, Taylor, Haskell and Williams20.
Neighbourhood-level data
Relevant data on retail food stores (including fast-food restaurants) were obtained from the California State Board of Equalization (SBOE) and telephone business directories for the years in which the SHDPP cross-sectional surveys were conducted. The SBOE is a government agency that licenses retail businesses that sell any taxable item (such as soda or beverages); its database can be expected to include small grocery stores but not vendors that exclusively carry fresh produce and meats (non-taxable items). In a methodological study, we found it necessary to supplement the SBOE database with stores listings from the telephone directories. Use of telephone directories alone can be problematic because the same store may be listed several times under different store names, store addresses may be omitted or incorrect, and stores may be listed even after they have moved or closedReference Wang, Gonzalez, Ritchie and Winkleby23.
The food store data we obtained included store names and street addresses and dates of operation; the street addresses were geocoded into neighbourhoods, which were defined by a combination of census tracts and/or block groups. These census-defined boundaries were verified against archival neighbourhood maps and with city planners to ensure that they corresponded with actual neighbourhood boundaries. Using these definitions, a total of 82 neighbourhoods were identified in the four cities; 70 neighbourhoods had boundaries that corresponded with individual census tracts or block groups, while the remaining 12 neighbourhoods had boundaries that reflected a combination of census tracts or block groupsReference Pollack, Cubbin, Ahn and Winkleby24–Reference Winkleby, Cubbin and Ahn27.
The neighbourhood food store environment was defined by the number and geographic density of food stores of each type in a neighbourhood. The number of food stores of each type is the count in the neighbourhood and a surrounding 0.5-mile buffer zone. The geographic store density is calculated by dividing the number of stores by the area of the neighbourhood. The creation of a buffer zone allows the inclusion of stores that lie just outside neighbourhood boundaries.
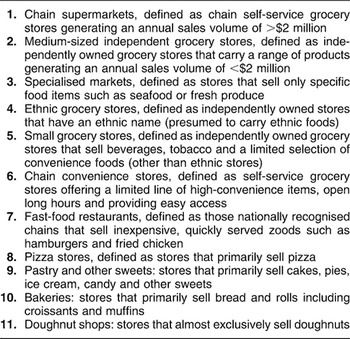
The North American Industry Classification System28 and the Food Marketing Institute29 definitions of retail food stores were adapted to create 11 food store categories (see Table 2). Most stores were assigned to a category based on name recognition. Store names that were vague were assigned to a category after checking the business pages of the telephone directory or making inquiries with managers/owners of existing stores or long-term residents of the neighbourhood; these were mostly small independent grocery stores, which comprised about 20% of all stores.
Table 2 Store type definitions
Data analysis
Means and standard deviations or frequency distributions of relevant sociodemographic variables were derived to provide summary descriptive characteristics of the participants and the neighbourhoods in which they lived.
To examine trends in the food store environment, the mean neighbourhood store count and store density were computed for each store type in each survey year. Medium-sized independent grocery stores were omitted from the analysis, because only 1% of SHDPP participants lived in neighbourhoods with a medium-sized independent grocery store.
To examine trends in food behaviour, the percentage of participants consuming a list of selected foods for each survey year was calculated; these foods were then categorised as ‘healthier foods’ or ‘less healthy foods’. Specifically, foods that were generally high in fat, sugar or salt were considered less healthy foods – fried foods, cured meats, salted chips, cake/pie, candy and other sweets (‘sweets’) and TV dinners or pre-prepared foods – while fresh meat including poultry, whole-grain fibre, rice/corn/noodles, beans and milk were considered healthier foods. All categorical variables (expressed as percentages) were examined for trend using the Cochran–Armitage trend test, while continuous variables were examined for trend using a Poisson regression model with survey as the time effect.
Results
Across all four surveys, participants had a mean age of 45 years and were primarily non-Hispanic White (83%) and married (68%) (Table 3). Approximately 60% had more than 12 years of education, and 43% had household incomes that were greater than 400% of the Federal Poverty Level30.
Table 3 Sociodemographic profile of study participants, aged 25–74 years (1981–1990)Footnote *
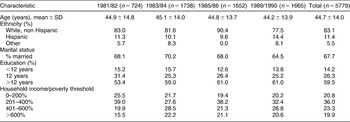
SD – standard deviation.
* Data gathered in four cross-sectional surveys conducted from 1981 to 1990. Sample includes one woman per household and/or one man per household.
Socio-economic characteristics of the neighbourhoods for each of the four cities for the years 1980 and 1990 (when the US Census was conducted) are shown in Table 4. From 1980 to 1990, the populations of all four cities grew more than 10-fold from 363 000 to 4.3 million; median household income increased by 87% from $16 000 to $30 000; the percentage with less than 12 years of education decreased from 28% to 23%; and the percentage unemployed dropped from 8.6% to 6.8%. The Hispanic population in all four cities also increased from 10% of the total population to 13%.
Table 4 Neighbourhood characteristics over time by city, 1980 and 1990 Census
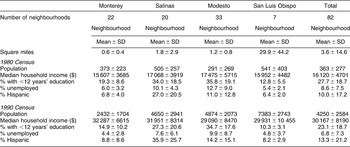
SD – standard deviation.
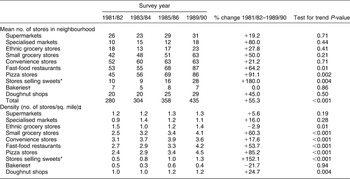
Changes in neighbourhood food store environment from 1981 to 1990 are shown in Table 5. In terms of both neighbourhood count of stores and store density, stores selling sweets, pizza stores, small grocery stores and fast-food restaurants showed large increases from 1981 to 1990. For example, the mean count per neighbourhood and density of stores that sold pastries and other sweets increased by 180% and 152%, respectively. Chain supermarkets and chain convenience stores showed more modest increases.
Table 5 Neighbourhood food store patterns, 1981–1990
*Including ice-cream, candy, cake and pie.
† Primarily sells bread, muffins, croissants and/or bagels.
‡ Includes 0.5-mile buffer zone.
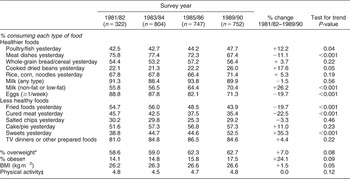
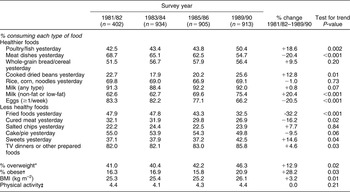
Changes in individual food behaviour over the period 1981–1990 are indicated by the percentage of participants who consumed selected foods the day previous to the interview. There were notable increases among both men and women in the percentage consuming what are generally considered ‘healthy’ foods. The percentage reporting consumption of poultry/fish, cooked dried beans and reduced-fat milk increased by 12–26% in men and 13–20% in women. However, over the same period, while there were significant decreases in the percentage reporting consumption of fried foods (men: 20% decrease, women: 32% decrease) and cured meats (men: 23% decrease, women: 16% decrease), the percentage reporting consumption of other less healthy foods increased: sweets by 35% in men and 15% in women, and TV dinners and other pre-prepared foods by 4–5% among both men and women (Tables 6 and 7).
Table 7 Individual dietary habits and BMI over time: women aged 25–74 years
BMI – body mass index.
* BMI = 25.0–29.99 kg m−2.
† BMI ≥ 30.0 kg m−2.
‡ Physical activity was rated using a 1–7 scale with 7 being the most active.
Table 6 Individual dietary habits and BMI over time: men aged 25–74 years
BMI – body mass index.
*BMI = 25.0–29.99 kg m−2.
† BMI ≥ 30.0 kg m−2.
‡ Physical activity was rated using a 1–7 scale with 7 being the most active.
Changes in BMI over 1981–1990 reflected nationwide trends, with mean BMI increasing by 1.5% in men and 3.2% in women, and the percentage of men and women who were obese (BMI ≥ 30.0 kg m–2) increasing rapidly, from 14.1% to 17.5% in men and from 16.3% to 20.9% in women (Tables 6 and 7).
Discussion
This analysis of data from four mid-sized cities in California found increases in the number and density of all types of stores, except bakeries. The stores that showed the greatest increases in absolute counts per neighbourhood, and also statistically significant increasing trends, were stores that sold sweets, pizza stores and fast-food restaurants. The stores that showed the greatest increases in density were stores selling sweets, pizza stores, small grocery stores, fast-food restaurants, doughnut shops and convenience stores.
Changes in individual food behaviour were not entirely consistent with these trends. The increases in the number and/or density of stores that sold sweets, doughnut shops, small grocery stores and convenience stores paralleled increases in the percentage of participants reporting consumption of sweets and TV dinners and other pre-prepared foods. However, increases in fast-food restaurants did not correspond with an increase in the percentage of participants reporting consumption of fried foods (defined to include hamburgers), which actually showed a decrease of 32% for women and 20% for men, from 1981 to 1990. The percentage of participants who consumed healthier choices of selected protein foods (poultry/fish, cooked dried beans, reduced-fat milk) increased by 12–26%. However, the percentage who consumed less healthy foods also increased: sweet foods by 15% in women and 35% in men, and TV dinners and other pre-prepared foods by about 4% in both women and men. During the same period, the percentage of participants who were overweight increased significantly by 13% for women and 7% for men. Obesity prevalences increased more rapidly, by 28% for women and 24% for men.
These observations of individual dietary behaviour and overweight risk are consistent with findings from national surveys. Using data from the 1965 Nationwide Food Consumption Survey and the 1994–1996 Continuing Survey of Food Intake of Individuals, Popkin et al. found that diet quality, with the exception of calcium intake, had improved across racial/ethnic groups and socio-economic groups. However, they noted that despite the increase in diet quality, the average energy intake of Americans has also increasedReference Popkin, Zizza and Siega-Riz31. The increase in the percentage of SHDPP participants consuming sweets and TV dinners and pre-prepared foods is consistent with the increase in energy intake observed in the general US population. Similarly, the increases in the percentage consuming healthier choices of protein foods (poultry/fish, cooked dried beans, reduced-fat milk) and the decrease in the percentage consuming fried foods are consistent with the finding of improved diet quality.
There are several limitations to this study. The assessment of food behaviour used by the SHDPP did not include fruits and vegetables, which at the time (1980s) were not the primary focus of most nutrition interventions32. Fast-food items were not asked about specifically; instead, they were classified as fried foods together with non-fast-food fried items. Further, the assessment of consumption of selected foods did not seek information on portion size. It is likely, for example, that while the percentage of individuals consuming fried foods decreased, the average portion size among consumers increased over time33.
Store data were archival so it was not possible to physically observe the types of foods carried by the stores at the time of the surveys. Further, categorisation of the stores was based on name recognition, and made with the help of current store owners/managers and long-term residents. There is likely to be error in categorisation of the stores, especially older stores that no longer existed at the time of this study.
The analysis was limited to data gathered from adults only, and the apparent inconsistency between the increasing trend of fast-food restaurants and the decreasing percentage of SHDPP participants consuming fried foods may reflect differences in preference for fast food between adults and children. Finally, the cross-sectional nature of the survey data prevented the use of more rigorous analytical techniques to prospectively examine changes in individual-level behaviour in relation to changes in the neighbourhood food store environment over time.
In conclusion, this study has documented increases in all types of food stores, with the exception of bakeries, in four mid-sized cities in agricultural regions of California; stores that usually carry less healthy foods (stores selling sweets, pizza stores, small grocery stores, fast-food restaurants, doughnut shops and convenience stores) showed the greatest increases. This observation echoes the trends observed in more urban regions. Many efforts are being made throughout the nation to address obesity by intervening at the environmental level. For example, in California, the California Endowment established the Healthy Eating, Active Communities Initiative, a $26 million four-year initiative, to improve the food and physical activity environments of school-aged children34. Findings from evaluation studies of such environmentally focused programmes will direct future research and intervention efforts. Meanwhile, it is important to conduct more definitive studies to delineate the role of the environment in determining food behaviour. While the types of retail food stores in a neighbourhood clearly affect the availability and accessibility of various types of foodsReference Sloane, Diamant, Lewis, Yancey, Flynn and Nascimento9, other factors such as knowledge, social and cultural norms and values, and financial resources (including ownership of a vehicle) also determine food purchasing and consumption behaviour in the USAReference Wang, Kim, Gonzalez, MacLeod and Winkleby7, 11. The weight of these factors in their influences on individuals and families will shape the design of effective interventions.
Acknowledgements
Authors’ contributions: M.C.W. conceived of and led the study, and drafted the manuscript. C.C. assisted with the data management, analysis and interpretation, and with drafting the manuscript. D.A. advised on the use of appropriate statistical methods, performed the statistical analysis, and assisted with data interpretation. M.A.W. provided guidance on the study design, and data analysis and interpretation, and contributed to the manuscript. All authors read and approved the final manuscript.
Conflict of interests: None.
Acknowledgments: This study was supported by the American Heart Association through an Established Investigator Award 0240102N (Principal Investigator: M.C.W.) and a RO1 Award HL67731 from the National Institute of Environmental Health Sciences and the National Heart, Lung, and Blood Institute (Principal Investigator: M.A.W.). We also wish to thank Patrick McCabe for assisting us with the literature search.


