Folate deficiency during the periconceptional period has been strongly confirmed as a risk factor for many adverse pregnancy outcomes, especially neural tube defects (NTD)(Reference Geisel1,Reference Czeizel, Dudas and Vereczkey2) . Therefore, any factors affecting folate levels may be associated with NTD.
Tea is the most popular beverage worldwide. It is consumed by two-thirds of the world’s population, and drinking tea has been considered a health-promoting habit since ancient times(Reference Khan and Mukhtar3). However, several studies have found that drinking tea was associated with an increased risk for NTD under the condition with no consideration of dietary folate intake. A case–control study conducted in northern China showed that women who drank tea every day were over three times more likely to have an NTD-affected pregnancy compared with those who did not drink tea(Reference Ye, Ren and Zhang4), and another case–control study conducted in America found an increased risk of spina bifida associated with daily consumption of tea(Reference Correa, Stolley and Liu5). A hypothesised mechanism for this association was that tea intake may affect the absorption and metabolism of folate(Reference Ren6). In addition, Yazdy et al. studied the relationship between tea consumption and spina bifida after adjusting for dietary folic acid (FA) intake after 1988, and they think there is a suggestion of a possible interaction between higher levels of FA intake and tea consumption. However, the results of these interactions were not statistically significant (OR range contained 1·00), which may be due to the small sample size of each group after stratification(Reference Yazdy, Tinker and Mitchell7). Animal experiment shows that high levels of green tea catechins can decrease serum 5-methyltetrahydrofolate concentrations of rats(Reference Augustin, Frank and Augustin8).
Previous epidemiological studies have investigated the association between tea consumption and blood folate levels, but results have been inconsistent. An open-label randomised crossover study revealed that consumption of green or black tea was associated with a low serum folate level for healthy volunteers(Reference Alemdaroglu, Dietz and Wolffram9). A cross-sectional survey showed no association between tea drinking and plasma folate concentrations in pregnant Chinese women with high and low prevalence of NTD(Reference Liu, Jin and Zhang10). However, most studies did not take into account the effects of dietary folate intake, despite its being the most important factor for folate levels in the body other than FA supplement. Therefore, the aim of this study was to determine whether tea drinking was associated with plasma folate concentration in women aged 18–30 years in China after adjusting for confounding variables including dietary folate intake, FA supplement and BMI. Moreover, China is a multi-ethnic country, and different ethnic groups have its own tea drinking characteristics, especially tea types, so, we further analysed the relationship between tea drinking and plasma folate concentration after stratifying by ethnics and tea types.
Materials and methods
Study design and selection of participants
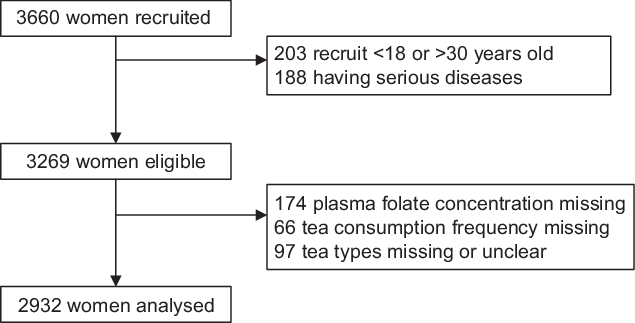
This study was based on a nationwide cross-sectional study designed to investigate the nutritional status of women aged 18–30 years in areas with different levels of economic development in China; this study was partly described elsewhere(Reference Zhao, Hao and Zhang11). It was conducted in nine provinces or autonomous regions in China, including Inner Mongolia, Gansu, Liaoning, Shandong, Sichuan, Guangdong, Xinjiang Uygur, Guangxi and Hubei; in each province, one city and one county were selected as project sites. The study was conducted during two periods (April to May 2005 and October 2005 to April 2006). One hundred women were planned to be recruited in each city or county during each period. The inclusion criteria were (1) 18–30 years of age, (2) not pregnant or breast-feeding, (3) living in the area for more than 1 year and (4) free from hypertension, diabetes, cancers, and heart, liver, renal and gastrointestinal diseases, as well as other serious diseases. A total of 3660 women were recruited from 2005 to 2006, of whom 3269 women were eligible, 203 (5·55 %) were excluded because of age and 188 (5·14 %) were excluded because of the diseases mentioned above.
We conducted the present study using data collected in the study described above. Of 3269 eligible women, we excluded 174 (5·32 %) with missing data on plasma folate concentration, 66 (2·02 %) with missing data on tea consumption frequency and 97 (2·97 %) with missing or unclear information on tea types. After these exclusions, 2932 targeted participants (89·69 % of eligible women) were included in the final analysis. The flow chart of participants in this study was presented in Fig. 1.

Fig. 1 The flow chart of participants in this study
Measurements and definitions of major variables
At the community health centre, a trained interviewer administered a structured questionnaire to subjects to collect data on socio-demographic and personal characteristics, including age, ethnicity, educational level, current cigarette and alcohol use, use of oral contraception, and use of FA supplements or multivitamins containing FA. FA supplement was defined as a self-report of having taken FA supplements or multivitamins containing FA in the past 3 months. Dietary data were collected using 24-h recall through face-to-face interview by trained nurses for one time, with two-dimensional drawings of bowls and plates to estimate portion sizes. Dietary folate intake levels were calculated based on Chinese Food Composition(Reference Yang12). Dietary folate concentrations were adjusted by energy intake to minimise the influence of dietary false reporting(Reference Shiraishi, Haruna and Matsuzaki13), calculating through 1000*dietary folate concentrations (μg)/energy intake (kcal). Dietary folate was divided into three groups according to the 25th and 75th percentiles of its natural logarithm (low: 3·07–4·46, medium: 4·47–5·08 and high: 5·09–7·43). It is worth noting that there was no promotion and use of folate-fortified foods in China. Therefore, the folate intake of the study population was mainly derived from dietary folate intake.
Body weight in light clothing and height without shoes were measured to the nearest 0·1 kg and 0·1 cm with a beam weighing scale and a height scale, respectively. BMI was calculated as weight (kg)/height (m)2. Underweight, normal weight, overweight and obese were defined according to the standards recommended by the Working Group on Obesity in China(Reference Chen and Lu14) (underweight: BMI < 18·5 kg/m2; normal weight: BMI = 18·5–23·9 kg/m2; overweight: BMI = 24·0–27·9 kg/m2 and obese: BMI > 28·0 kg/m2).
Subjects were asked ‘how many days have you drunk tea each week over the past three months?’ If the answer was one to seven (not zero), they were further asked what type of tea they usually drank. We defined 0 d a week as no tea consumption, while 1–7 d(s)/week as tea consumption. The type of tea was divided into two categories according to different production processes: fully fermented tea (black tea and compressed tea) and unfermented tea (green tea and scented tea)(Reference Stahl15). Smoking was defined as smoking at least one cigarette per day for six consecutive or cumulatively months and above. And drinking alcoholic beverage was defined as drinking alcohol more than once a month in the last year.
Overnight fasting blood (9 ml) was collected from each subject by venepuncture by a qualified nurse. Blood samples were drawn into K3EDTA-containing Vacutainer tubes (Becton Dickinson) and centrifuged within 1 h of collection. Plasma and erythrocytes were separated and frozen at –20 °C. All specimens were transported on dry ice to the central laboratory of the Institute of Reproductive and Child Health, Peking University, and stored at –70 °C before nutritional analyses. Plasma folate concentrations were determined by a microbiological assay(Reference O’Broin and Kelleher16). The intra- and inter-assay coefficients of variation were less than 9 % across the full range of folate concentrations.
Statistical analysis
Sample size was determined based on a cross-sectional study conducted in China, which geometric mean concentrations of plasma folate acid for women were 23·0 ± 11·8 and 18·2 ± 9·3 nmol/l in spring and fall, respectively(Reference Hao, Ma and Stampfer17). Then, statistical power and the two-sided significance level were set to be 90 % and 0·05. For the original research, the minimum sample size should be 208 women. However, for this research, we calculated that under the condition of a sample size of 2932, the test power was 1·00, which can meet the research requirement.
The Little’s MCAR test was done to test whether the missingness was completely at random. The basic characteristics of participants in the different study groups were compared using Student’s t test for quantitative variables, the χ2 test for non-ordered categorical variables and the Kruskal–Wallis test for ordered categorical variables. The distributions of dietary folate intake and plasma folate concentrations adjusted by energy were positively skewed, so geometric means and interquartile range were used to describe their distributions, and values were log-transformed before further analysis, including t tests. We used multiple linear regression to evaluate the partial correlation coefficients with 95 % CI after adjusting for confounding factors. These factors include mentioned in previous studies (age, education, delivery status, FA supplement, smoking, BMI and concentration of dietary folate adjusted by energy)(Reference Liu, Jin and Zhang10,Reference Zhao, Hao and Zhang11,Reference Shiraishi, Haruna and Matsuzaki13) , imbalanced between tea consumption and no tea consumption group (ethnicity, delivery status and drinking), and other factor we are interested in may affect plasma folate levels (oral contraceptives). Then, we conducted a stratified analysis of the subjects according to ethnic groups and tea types, and we performed the same multiple linear regression analysis in each group, after adjusting for confounding factors mentioned above.
SPSS for Windows software (ver.20.0; SPSS, Inc.) was used for statistical analyses, and two-sided P < 0·05 was considered significant.
Results
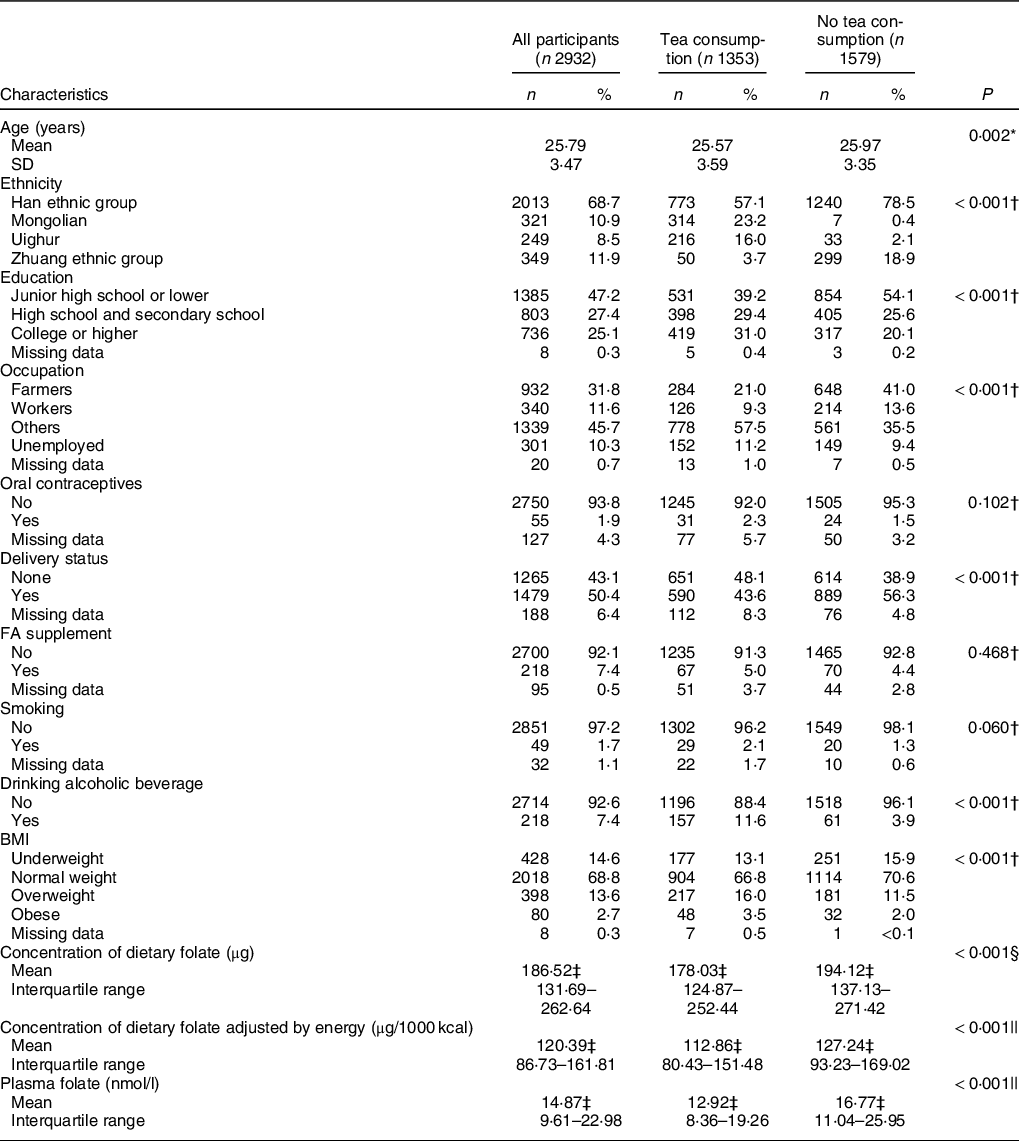
Basic characteristics of targeted participants are shown in Table 1. Approximately 46·1 % (1353) of these women reported that they drank tea in the past 3 months; these women were more likely to be Mongolian or Uighur (23·2 % or 16·0 % v. 0·4 % or 2·1 %), educated through high school or higher (60·4 % v. 45·7 %), occupation type was others or unemployed (57·5 % or 11·2 % v. 35·5 % or 9·4 %), primiparous (48·1 % v. 38·9 %), drinking alcoholic beverage (11·6 % v. 3·9 %) and overweight or obese (16·0 % or 3·5 % v. 11·5 % or 2·0 %) compared with the no tea drinking group. Women who consumed tea had significantly lower geometric mean dietary folate adjusted by energy (112·86 μg/1000 kcal) and plasma folate levels (12·92 nmol/l) compared to women who did not consume tea (127·24 μg/1000 kcal and 16·77 nmol/l, respectively). However, there were no significant differences between the two groups in oral contraceptive use, FA supplement use and smoking.
Table 1 Characteristics of Chinese women aged 18 to 30 years in the study

No tea consumption group: 0 d/week; tea consumption group: 1–7 d/week.
* Student’s t test.
† χ 2 test.
‡ Geometric mean (interquartile range).
§ Mann–Whitney test.
|| Student’s t test was performed after computing natural logarithm of folate levels.
The Little’s MCAR test was used in SPSS for the missing data, when quantitative variable was log-transformed plasma folate levels, and categorical variables were education, occupation, oral contraceptives, delivery status, FA supplement, smoking and BMI. χ 2 = 0·103, and P = 0·749. So the missingness was completely at random.
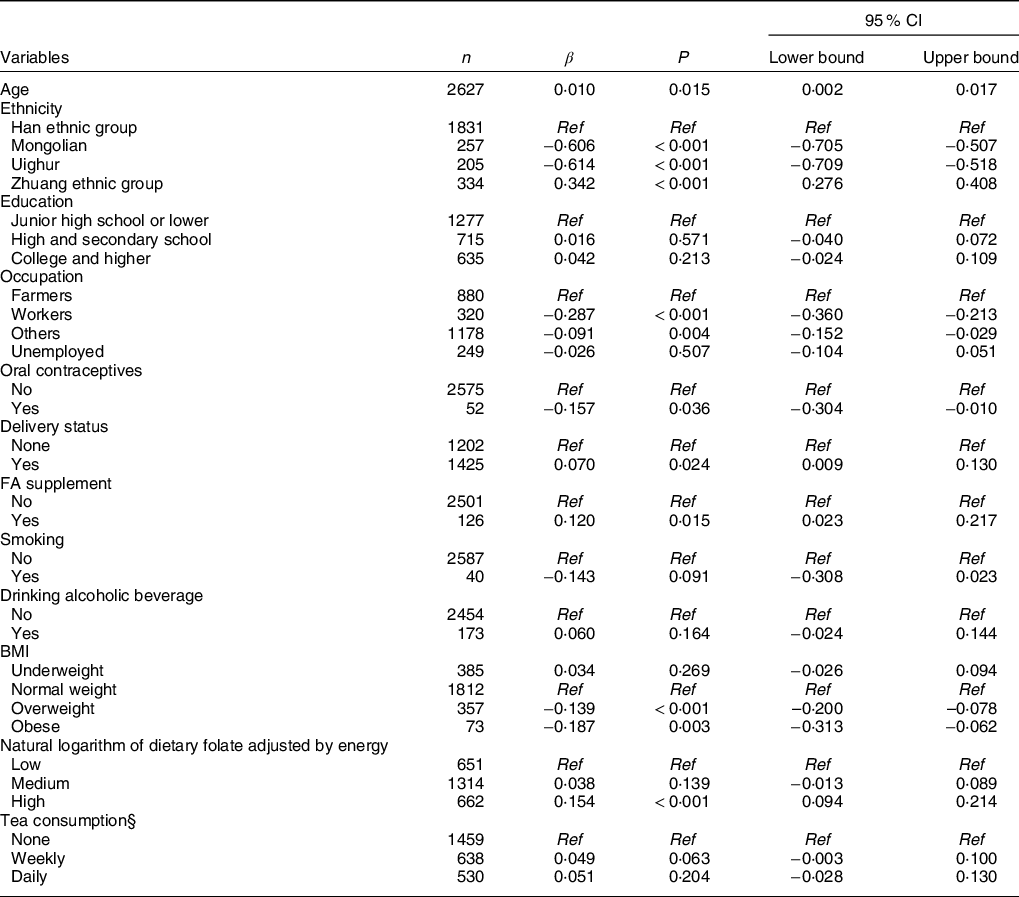
Table 2 shows the relationship between log-transformed plasma folate concentrations and concerned factors. Ethnicity was a significant predictor of log-transformed plasma folate levels. When the Han ethnic group was used as the reference group, Mongolian and Uygur women had lower folate levels (β = –0·606 and –0·614), and Zhuang women had higher folate levels (β = 0·342). High dietary folate intake was associated with increased log-transformed plasma folate levels (β = 0·154, P < 0·001), and high BMI was inversely correlated with log-transformed plasma folate. Tea drinking frequency had no statistical association with log-transformed plasma folate levels after adjusting for confounding variables (weekly and daily tea drinking, P = 0·063 and 0·204, respectively).
Table 2 Multiple linear regression model on plasma folate concentration and related factors in Chinese women aged 18–30 years*,†,‡

* The number of valid observations in final model is 2627.
† All of the variables in the table were included in the regression model.
‡ β values are per unit increase in log-transformed plasma folate levels.
§ None = 0 d/week; Weekly: 1–6 d/week; Daily: 7 d/week.
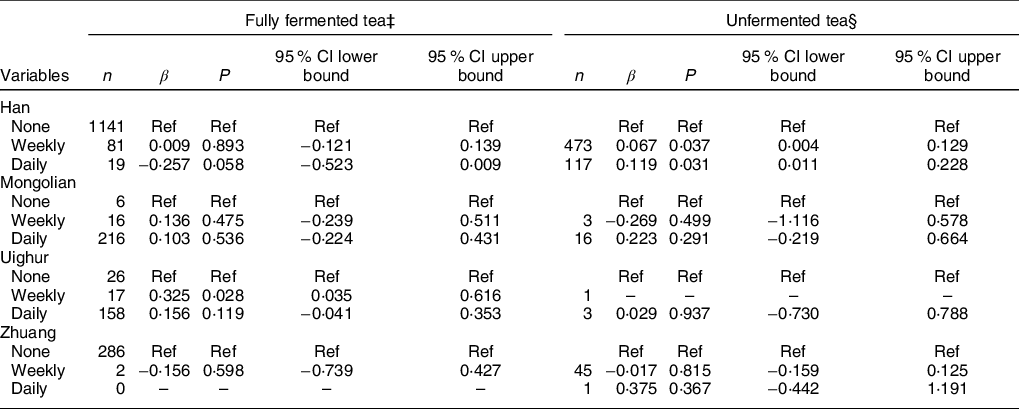
Further analyses were conducted to examine the relationship between tea drinking frequency and log-transformed plasma folate concentrations stratified by ethnicity and tea types (Table 3). The results showed that in women of Han ethnicity, consuming unfermented tea weekly (β = 0·067, P = 0·037) or daily (β = 0·119, P = 0·031) was significantly associated with a higher log-transformed plasma folate level after adjusting for confounding variables. We further transformed β of the unfermented tea drinking group in Han ethnicity (the geometric mean of plasma folate concentration for those who did not drink tea in Han ethnicity was 15·79 nmol/l), and the results showed that when compared with no tea drinkers, weekly tea drinkers and daily tea drinkers had 6·77 % (95 % CI: 6·36 %, 7·21 %) and 7·13 % (95 % CI:6·40 %, 7·96 %) increase in plasma folate concentration, as shown in Supplemental Table S1.
Table 3 Multiple linear regression model on plasma folate concentration and tea consumption in Chinese women aged 18–30 years stratified by ethnicity and types of tea*,†

* Adjusted for age (continuous), education, occupation, oral contraceptives, delivery status, FA supplement, smoking, alcoholic beverage drinking, BMI and dietary folate intake adjusted by energy.
† There were no or few objects in this group.
‡ Fully fermented tea: including black tea and compressed tea.
§ Unfermented tea: including green tea and scented tea.
In women of Uighur ethnicity, drinking fully fermented tea weekly was also positively associated with elevated plasma folate levels. However, no statistically significant correlation was found in other groups in this study.
Discussion
In this cross-sectional study, we examined the association between tea drinking and plasma folate concentrations among women aged 18–30 years in China. A total of 2932 women from four ethnic groups (Han and three national minorities) were included in this study. When we stratified by ethnicity and tea type, we found that tea consumption was positively correlated with plasma folate concentrations in Han women who drank unfermented tea weekly or daily and in Uighur women who drank fully fermented tea weekly. And for women who drank unfermented tea in Han ethnicity, weekly and daily tea drinkers had 6·77 % (95 % CI: 6·36 %, 7·21 %) and 7·13 % (95 % CI: 6·40 %, 7·96 %) increase in plasma folate concentration compared with no tea drinkers. This is a suggestion of possible positive association between tea drinking and plasma folate concentrations.
Tea is second only to water as the most commonly consumed beverage (3), and regular tea consumption has been reported to have beneficial health, including cancer prevention(Reference Adhami, Ahmad and Mukhtar18,Reference Thakur, Gupta and Gupta19) , cardiovascular benefits(Reference Arab, Khan and Lam20,Reference Zhang, Qin and Wei21) and neuronal disease prevention(Reference Dutta and Mohanakumar22). This study revealed that 46·1% (1353/2932) of Chinese women aged 18–30 years drank tea at least once a week in the 3 months prior to the survey. This was higher than the 21·3 % of Chinese women aged 30–79 years who consumed tea weekly as reported by Li X(Reference Li, Lyu and Guo23). This difference may be due to inclusion in our study of minorities with high tea consumption rates, such as Mongolian and Uighur women. Our results also showed that the dietary intake of folate adjusted by energy in this population (geometric mean = 120·39 μg/1000 kcal (interquartile range: 86·73–161·81)) was higher than that of pregnant women in Japan (median = 110 μg/1000 kcal (interquartile range: 91–139)) and that the plasma folate concentration (geometric mean = 14·87 nmol/l (interquartile range: 9·61–22·98)) was higher than that of Japanese women (median = 11·2 nmol/l (95% CI: 8·6, 19·5))(Reference Zhao, Hao and Zhang11) but lower than that of women of childbearing age in the USA before cereal grain was fortified with 140 mg/100 g of FA during 1988–1994 (median = 15·3 nmol/l (95% CI: 14·3, 16·8))(24).
Only a few studies have explored the relationship between tea consumption and folate levels. Alemdaroglu et al. (Reference Alemdaroglu, Dietz and Wolffram9) found that consumption of green or black tea was associated with a low serum folate level in healthy volunteers, and Shiraishi et al. (Reference Shiraishi, Haruna and Matsuzaki13) found that high consumption of green tea or oolong tea was associated with low serum folate levels during pregnancy. The probable mechanism for such a relationship is that catechins in tea are similar to folate in structure and competitively bind to dihydrofolate reductase, affecting folate metabolism(Reference Ren6). These catechins include epigallocatechin 3-gallate (constituting about 59 % of total catechins), epigallocatechin, epicatechin-3-gallate and epicatechin(Reference McKay and Blumberg25). However, Augustin et al. (Reference Augustin, Frank and Augustin8) pointed out that normal tea consumption levels did not reduce plasma folate concentrations, and a 70-kg human would have to drink almost 100 cups of green tea infusion per day to decrease serum folate concentrations via this mechanism. Moreover, few studies have controlled dietary folate intake, as stated above, which is an important factor that is significantly associated with plasma folate levels(Reference Lin and Wang26).
No association was found between tea drinking frequency and plasma folate concentrations when we adjusted for BMI and dietary folate adjusted by energy. However, when we stratified our analysis by ethnicity and tea types, we found that Han women drinking unfermented tea and Uighur women drinking fully fermented tea had higher plasma folate levels after adjusting for dietary folate intake. This may be due to the relatively large amount of folate in tea. Chen et al. (Reference Chen, Lui and Smith27) found that, of the three major types of tea (green, black and oolong), green tea leaves possessed the highest total FA (TFA) content, with an average of 1·12 mg/100 g, and black tea leaves had a moderate amount of 0·73 mg/100 g. They also found that brewed green tea had the highest total FA content (6·92 μg/100 ml), followed by black tea (5·16 μg/100 ml). For these measurements, researchers used a standard procedure of adding boiling water to tea leaves at a ratio of 100:1 (w/w) and allowing an infusion time of 5 min(Reference Stagg and Millin28). Meanwhile, the result of the China Kadoorie Biobank (CKB) survey revealed that Chinese women drank an average of 3·4 cups of tea each day(Reference Li, Lyu and Guo23). According to the standard cup volume of 300 ml, the daily intake of folate from drinking tea was about 70·6 μg and 52·6 μg from green tea and black tea, respectively. Similarly, Stagg et al. (Reference Stagg and Millin28) considered that if five cups of tea were consumed daily, 6–13 % of the RDA (400 μg) for folate would be obtained. Therefore, tea leaves and tea brews could be regarded as a good source of folate(Reference Chen, Lui and Smith27). Moreover, some cross-sectional population studies have found that a higher intake of tea was associated with lower total homocysteine (Reference Rasmussen, Ovesen and Bulow29), and they considered the folate in tea may contribute to lower total homocysteine(Reference Hodgson, Devine and Puddey30). These studies provide some support for that drinking tea could increase plasma folate levels, but specific mechanisms remain to be identified.
Our result that different types of tea were correlated with plasma folate concentrations in different ethnicities may be due to differences in typical tea type consumption among ethnicities. The lack of relationship between tea consumption and plasma folate concentrations in Mongolian and Zhuang women may be that there were too few women who did not drink tea in Mongolian or drank tea in Zhuang nationality, respectively. Therefore, the correlation between tea consumption and plasma folate concentration in minorities requires further research to confirm. And the different relationship in different ethnicities may be due to differences in tea-making process, brewing methods and even different genetic information, especially methylenetetrahydrofolate reductase. Further research is needed to collect more comprehensive information, including methylenetetrahydrofolate reductase in different ethnicities, to investigate the exact influencing factors behind ethnic groups.
This study has several limitations. First, we used ‘days/week’ to measure the frequency of tea consumption, which may not be accurate enough compared to ‘cups/week’ or ‘ml/week’. And we did not collect information on the tea-making process, brewing methods, and so on, and these factors affect tea composition. Second, we did not measure erythrocyte folate concentrations in this study. Erythrocyte folate is stable in the human body for 3–4 months and would provide a better summary of folate status(Reference Chen and Pan31,Reference Neuhouser, Cheng and Beresford32) . Then, we used a 24-h recall method to collect dietary intake from the women, but this method was relied on personal memories and there may be exposure misclassification. However, we used two-dimensional drawings of bowls and plates to estimate portion sizes, which may improve the accuracy as much as possible. What needs to be mentioned is there may be some noise of energy-adjusted folate intake because it relies on 1-d folate and 1-d energy. But it is approximately normal distribution after natural logarithmic transformation, which means a very small noise effect in this study. Finally, the number in each group was very few after stratification by ethnicity and types of tea, so the relationship in other ethnic groups other than Han still needs a large sample size research to be identified.
Our study also has several strengths. First, we controlled for the level of dietary folate intake, which strengthened our results. Most existing studies have not made this adjustment. Additionally, this study included populations in different areas of China, and diverse ethnicities and tea types were taken into account. This makes our result more comprehensive than most.
Conclusions
In conclusion, after stratifying by ethnic group and tea type, we found that Han women drinking unfermented tea and Uighur women drinking fully fermented tea had higher plasma folate levels. There is a suggestion of a possible positive association between tea drinking and plasma folate concentrations.
The English in this document has been checked by at least two professional editors, both native speakers of English. For a certificate, please see http://www.textcheck.com/certificate/wHiXXd
Acknowledgements
Acknowledgements: The authors would like to thank the official support from the Department of Maternal and Child Health of National health commission of People’s Republic of China. We are grateful to all study participants and the many health care workers involved from project sites in Inner Mongolia, Gansu, Liaoning, Shandong, Sichuan, Guangdong, Xinjiang, Uygur, Guangxi and Hubei in China. The authors also thank all other staff who participated in the project at the Peking University Health Science Center. The authors would like to express gratitude to Dr Bin Wang, who has provided suggestions and revising language for this manuscript. Financial support: This work was supported by WHO – Ministry Of Health (MOH) 2004–2005 Cooperation Project [grant number WP/2004/CHN/RPH/3·4/001] and the National Natural Science Foundation of China [Grant 81673177]. Conflict of interest: None. Authorship: All authors accept responsibility for the paper as published. XJ wrote the manuscript. XJ and MR both contributed to the statistical analysis discussion and reviewed/edited the manuscript. YZ and BW contributed to discussion and reviewed/edited the manuscript. RY and LZ were involved in the study design, data collection and contributed to discussion. LZ and ZL contributed to discussion and reviewed the manuscript. LZ and XJ were mainly responsible for the revise of this article. Ethical Standards Disclosure: This study was conducted according to the guidelines laid down in the Declaration of Helsinki and all procedures involving research study participants were approved by the Institutional Review Board of Peking University Health Science Center. Written informed consent was obtained from all subjects.
Supplementary material
For supplementary material accompanying this paper visit https://doi.org/10.1017/S1368980020004851


