


Economic self-interest forms the cornerstone of political economy theories of social policy and income redistribution. Individuals are expected to support policies that increase their material well-being and oppose those that reduce it. It is practically common sense to assume that low-income, low-skill, and economically insecure individuals will demand more redistribution than their high-income, high-skill, and economically secure counterparts (Iversen and Soskice Reference Iversen and Soskice2001; Cavaillé and Trump 2015). Despite their substantial disagreements, the two dominant theories on the matter—the median voter theory of redistribution (Meltzer and Richard Reference Meltzer and Richard1981) and the class-based power resource theory of the welfare state (Huber and Stephens Reference Huber and Stephens2001)—take economic self-interest as their starting points.
Income is a robust predictor of individual support for redistribution in the industrialized world. It has, however, proven less useful at explaining attitudes in less developed and highly unequal countries (Dion and Birchfield Reference Dion and Birchfield2010, 330). Specifically, research has failed to find a relationship between income and support for redistribution in the world’s most unequal region, Latin America (Kaufman Reference Kaufman2009; Blofield and Luna Reference Blofield and Pablo Luna2011). The absence of a clear relationship in the place where conventional wisdom would predict the most demand for redistribution presents a puzzle. If not self-interest, what explains support for redistribution in Latin America and developing countries more generally?
A rival of set of explanations posit that attitudes toward redistribution are less a function of economic self-interest than of affinity toward other groups in society, particularly those at the bottom of the income distribution (Cavaillé and Trump 2015; Alt and Iversen Reference Alt and Iversen2017). Put succinctly, these explanations predict that individuals will be more supportive of redistribution when they perceive themselves to be similar to and feel affinity toward the people who (they believe) benefit from redistribution.
At their core, welfare states impose compulsory solidarity between individuals, requiring them to forgo part of their incomes, knowing that the beneficiaries from subsequent government transfers will probably be people other than themselves (De Beer and Koster Reference Córdova2009). The less contributors perceive they have in common with the expected beneficiaries of redistribution, the less solidarity they will feel toward them and the less they will support redistribution. Weak solidarity between groups in a society explains the robust negative correlation between cultural (i.e., ethnic, racial, religious, and even nationality) divisions within a society and individual attitudes toward redistribution (Luttmer Reference Huber and Stephens2001; Finseraas Reference Finseraas2012). Such divisions may even prompt the poor to oppose policies that are in their own economic self-interest.
Cultural divisions, however, are not the only cleavages that influence societal solidarity and thus attitudes toward redistribution. A society can also be polarized along socioeconomic class lines. Lupu and Pontusson (Reference Blofield and Pablo Luna2011) find that the economic distance between middle-income groups, which include the decisive median voter, and the other social classes is an important predictor of redistribution and social spending among industrialized countries (see also Kristov et al. Reference Kristov, Lindert and McClelland1992). In a nutshell, when the distance between the incomes of those in the middle and the wealthy is large, the former develop affinity toward the poor and side with them in favor of redistribution. Conversely, when the distance between the middle and poor is large, the former align with the rich against redistribution.
To arbitrate between these “self-interest” and “social affinity” explanations, this article conducts a multilevel regression analysis of individual-level public opinion data and country-level data covering 18 Latin American countries during the period 2008–2016. The statistical analysis yields robust support for both cultural and income-based social affinity explanations. Support for explanations centered on economic self-interest is mixed.
With regard to social affinity, individuals living in culturally and ethnically divided countries are found to be less supportive of redistribution than their counterparts in more homogenous countries. Seemingly counter to economic self-interest, low-income individuals become less likely to support redistribution as these types of divisions intensify. This effect is driven primarily by self-described whites and, to a lesser extent, nonmestizo minorities. With regard to income-based social affinity, the more skewed a country’s income distribution is in favor of the rich relative to those in the middle of the income distribution, the more likely its citizens are to support redistribution. However, support for redistribution decreases as the distance between the incomes of those in the middle and the bottom expands.
In contrast, evidence in support of economic self-interest as a determinant of support for redistribution is less robust. In line with the median voter theory, the more unequal a country is, the more likely people are to support redistribution. However, the magnitude of this effect changes significantly depending on model specification and is not always statistically significant. Poorer individuals are more likely to support redistribution, though this effect is small. Counter to self-interest, less educated and economically insecure individuals are no more supportive of redistribution than the rest of the population.
This article proceeds to contrast economic self-interest and social affinity explanations and outlines the main hypotheses that will be tested. Then it focuses on issues pertaining to data and estimation technique. This is followed by a section presenting the findings of the statistical analyses. The article concludes by discussing the significance of these results for the study of social policy in developing countries and proposing avenues for future research.
Attitudes Toward Redistribution: Economic Self-Interest versus Social Affinity
This article arbitrates between two rival explanations of public support for redistribution and welfare states more broadly: traditional approaches that attribute preferences to economic self-interest, and alternative approaches centered on an individual’s affinity toward other groups in society. Whereas redistributive preferences in the former are self-oriented, preferences in the latter are other-oriented (Alt and Iversen 2015; Cavaillé and Trump 2015).
Economic Self-Interest Explanations
Traditional explanations assume that economic self-interest is the main driver of attitudes toward redistribution. As an individual’s economic situation improves, the likelihood that they will need government assistance in the future decreases, while the amount they will be required to contribute to fund government programs increases. Income levels also tend to correlate with levels of education and economic security.
Economic self-interest is a central assumption of both the median voter theory (MVT, Meltzer and Richard 1981) and power resource theory (PRT, Huber and Stephens Reference Huber and Stephens2001). MVT argues that the more unequal a democracy is, the lower the median voter’s income will be relative to that society’s mean income level and the more that median voter stands to gain from redistribution. Single-mindedly focused on reelection, politicians will aim to please this pivotal voter through redistribution. Thus, highly unequal democracies should engage in more aggressive redistribution than less unequal ones. PRT, the dominant explanation for the emergence of welfare states in industrialized countries and Latin America (Huber and Stephens 2012), argues that supporters of redistribution must overcome collective action problems to turn their interests into policies. It is not enough, as in MVT, for voters to want redistribution. To achieve redistribution they must organize through labor unions and elect left-wing parties. Regardless, in both theories, economic self-interest determines attitudes toward redistribution.
A voluminous empirical literature fails to provide conclusive evidence supporting the MVT (see Acemoglu et al. Reference Acemoglu, Naidu, Restrepo, Robinson, Atkinson and Bourguignon2015). A cursory look at income distribution among industrialized countries reveals a “Robin Hood paradox”: the most egalitarian countries engage in the most redistribution (Lindert Reference Lindert2004). Research on individual-level support for redistribution also fails to find conclusive support for MVT’s predictions (Lübker Reference Lübker2007; Haggard et al. Reference Haggard, Kaufman and Long2013). Morgan and Kelly (2017) do find a positive relationship among Latin Americans, but only when controlling for inequality between ethnic groups and programmatic competition between political parties.
Research on Latin America does not support the most basic assumption of MVT (and PRT for that matter), let alone its predictions regarding levels of redistribution. Although some studies do find a negative relationship between individual income and support for redistribution (Gaviria Reference Gaviria2007; Morgan and Kelly Reference Morgan and Kelly2010; Haggard et al. Reference Haggard, Kaufman and Long2013), they are outnumbered by those that find no relationship (Kaufman Reference Kaufman2009; Dion and Birchfield Reference Dion and Birchfield2010, 330; Cramer and Kaufman Reference Cramer and Kaufman2011) or an inconsistent one (Blofield and Luna Reference Blofield and Pablo Luna2011). Beyond income, Kaufman (Reference Kaufman2009) finds that Latin America’s poor are no more likely than other groups to support higher taxes, consider income distribution unfair, or vote for the left.
Holland (Reference Holland2018) attributes this nonexistent relationship to the region’s truncated welfare regimes, whose employment-based social insurance programs exclude informal sector workers and thus, most of the poor. Under these conditions, the self-interested poor should have little incentive to support government-funded social policy. Along these lines, a side-by-side analysis of redistribution preferences among formal and informal sector workers in the region finds that income matters only for the former (Berens Reference Berens2015).
Cultural Social Affinity Explanations
Social affinity approaches posit that support for redistribution is influenced by (if not conditional on) empathy and solidarity toward the perceived beneficiaries of government policies. Following this logic, support for, and ultimately provision of, pro-poor policies should be lower in countries where a minority group perceived as an “other” by the majority group makes up a disproportionate share of the poor. A substantial body of research finds that societal heterogeneity reduces solidarity within societies, and with it, support for redistribution (Luttmer Reference Luttmer2001; Finseraas Reference Finseraas2012), as well as provision of social policy (Alesina and Glaeser Reference Alesina and Glaeser2004) and even nonexcludable public goods (Alesina et al. Reference Alesina, Baqir and Easterly1999; Baldwin and Huber Reference Baldwin and Huber2010). Alesina and Glaeser (Reference Alesina and Glaeser2004) go so far as to attribute much of the difference between U.S. and European welfare states to the former’s higher levels of racial diversity.
These arguments are consistent with the experience of Latin America, where countries with large indigenous populations, most notably Bolivia and Guatemala, possess comparatively weak safety nets while more homogenous states, such as Costa Rica and Argentina, have enacted some of the developing world’s most ambitious social policies. Income disparities between ethnic groups are associated with reduced support for redistribution among Latin Americans (Morgan and Kelly 2017). Ethnic diversity is also associated with lower healthcare spending, as well as higher poverty and inequality in the region (Huber and Stephens 2012, ch. 5).
Anti-Solidarity vs. Low Credibility
Cultural divisions within a society may interact with an individual’s economic situation to influence support for redistribution. The low levels of societal solidarity associated with divided societies may make low-income individuals less supportive of redistribution than their economic situation would otherwise predict. This phenomenon has been explained through two rival, though not mutually exclusive, mechanisms: the anti-solidarity motive and what will be referred to as the low credibility motive.
The anti-solidarity motive describes a situation in which low-income people from the majority group oppose redistribution because of its association with a minority group (Roemer et al. Reference Roemer, Lee and Van der Straeten2007). Shayo (Reference Shayo2009) argues that low-income members of the main group may cease to identify in terms of socioeconomic status if socially distant or low-status minorities make up a significant share of the low-income population. Low-income individuals who do not identify based on their income will demand less redistribution than expected based solely on income. In line with this argument, countries where the poor are split along ethnic lines engage in less redistribution (Houle Reference Houle2017). This self-defeating behavior may also be driven by a fear that redistributive policies will help minorities catch up to low-income members of the majority group, what Kuziemko et al. (Reference Kuziemko, Buell, Reich and Norton2014) call last-place aversion.
On the face of it, this story appears to describe contemporary Latin America. There is a clear ethnic component to the region’s poverty and inequality. Indigenous and Afro-descendant Latin Americans are two to three times more likely to be poor than whites (Lustig Reference Lustig2017). Latin American Public Opinion Project (LAPOP) AmericasBarometer surveys analyzed in the empirical section reveal that 30 percent of self-identified minorities—indigenous, black, mulatto, and others—ranked in the bottom quintile in terms of household assets, compared to 19 percent of self-reported whites and mestizos. Whereas 16 percent of minorities reported receiving government aid, only 12 percent of nonminorities did. In fact, minorities constituted 27 percent of aid recipients despite representing only 20 percent of respondents. Thus, attitudes toward redistribution are likely to be intertwined with attitudes toward minorities.
The low credibility motive describes a situation in which low-income minorities fail to support redistribution at the level that would be expected based on their income because they are skeptical that the government would enact policies to help people “like them.” There is widespread evidence from across the region of gaping disparities in the availability and quality of social services provided to indigenous and other minorities (Gandelman et al. Reference Gandelman, Ñopo and Ripani2011). Thus, it may be rational for poor minorities in countries with large between-group disparities to oppose, or at least not support, redistributive policies (Morgan and Kelly 2017, 197).
Income-based Social Affinity Explanations
Yet the divisions that reduce intergroup solidarity and with it, support for redistribution need not be cultural. Latin America’s large wealth disparities and low levels of intergenerational mobility (Gaviria Reference Gaviria2007) have produced societies where different economic strata live largely separate lives (Karl Reference Karl2000, 153). Deficiencies in public education and healthcare have prompted the wealthy, and increasingly the middle class, to invest in private education and healthcare. Furthermore, given high crime rates, the rich and middle class increasingly isolate themselves geographically. Reduced levels of day-to-day interaction further increase the social distance between economic strata, which, in turn, “severely hinders the emergence of broad and effective solidarity” (O’Donnell Reference O’Donnell, Victor and O’Donnell1998, 55) and a “feeling of common belonging” (Vilas Reference Vilas, Douglas, Carlos, Katherine Hite, Martin and Segarra1997, 22).
Focusing on industrialized countries, Lupu and Pontusson (Reference Lupu and Pontusson2011) find that levels of redistribution and social spending are influenced by the relative economic distance between those near the middle of the income distribution, which contains the pivotal median voter, and the other income categories. Middle-income voters tend to ally with the poor in support of redistribution and social spending when the distance (in terms of shares of national income) between both groups is small relative to the distance between the middle and the rich. Conversely, redistribution decreases when the distance between the middle and the poor is large relative to the distance between the middle and the rich.
Implications and Hypotheses
To assess the effect of economic self-interest on redistributive preferences, the following hypotheses will be tested:
H1A. Following the MVT, the more unequal a country’s income distribution is, the more supportive its residents will be of state-funded redistribution.
H1B. The better a person’s economic prospects are in terms of income, education, and recent economic situation, the less supportive they will be of state-funded redistribution.
Cultural social affinity explanations will be assessed by testing the following hypotheses:
H2A. The more ethnically and culturally divided a country is, the less supportive its residents will be of state-funded redistribution.
H2B. Following the anti-solidarity motive, the more ethnically and culturally divided a country is, the less supportive that country’s low-income whites and mestizos will be of state-funded redistribution.
H2C. Following the low credibility motive, the more ethnically and culturally divided a country is, the less supportive that country’s low-income minorities will be of state-funded redistribution.
Following Lupu and Pontusson (Reference Lupu and Pontusson2011), the models will also test for income-based social affinity:
H3A. The larger the distance between the income shares of middle- and low-income individuals in a country, the less supportive that country’s residents will be of state-funded redistribution.
H3B. The larger the distance between the income shares of high- and middle-income individuals in a country, the more supportive that country’s residents will be of state-funded redistribution.
H3C. The larger the income distribution skew in a country (the ratio between the two measures of income distance), the more supportive that country’s residents will be of state-funded redistribution.
Data and Research Design
To assess the determinants of public support for state-funded redistribution, this article conducts multilevel regression analyses combining individual-level public opinion data from five waves of LAPOP’s AmericasBarometer survey with country-level data from a variety of sources. The analysis covers 18 Latin American countries during 2008, 2010, 2012, 2014, and 2016.
The hypotheses presented above are tested using three-level regression models with individuals nested within country-years, which are, in turn, nested within countries. The use of multilevel models is justified both by the substantive goal of simultaneously assessing the effects of individual- and national-level variables on individual support for redistribution and by the data’s nested structure. To ignore the structure of the data would result in biased or incorrect inferences.
The skewed nature of the dependent variable (see below) prevents models from meeting the requirements for linear regression. As a result, the analysis will be conducted via binary logit models.
Dependent Variables
The dependent variable is a dichotomous measure of whether individuals responded “strongly agree” (7 out of 7) to the following the question: “Should the [country name] state implement firm policies to reduce income inequality between the rich and the poor?” (ros4).Footnote 1
Overall, the belief that it is the state’s role to address inequality is widely held among Latin Americans, whose views more closely resemble those of Europeans than of Americans (see Gaviria Reference Gaviria2007, 74). During the decade studied, a full 76.96 percent of respondents were to some degree supportive of redistribution (5 or higher) compared to just 12.18 percent that were to some degree opposed (3 or lower). Close to half (43.96 percent) of respondents “strongly agree.”
Given this skewed distribution, this article follows Morgan and Kelly (2017, 200) in focusing on explaining “particularly positive attitudes” through a dichotomous measure of the strongest level of agreement. Despite overall strong support for redistribution, there is significant cross-national variation, with the proportion strongly supporting redistribution ranging from 28.05 percent in Bolivia to 55.43 percent in the Dominican Republic.
Explanatory Variables
The main explanatory variables seek to capture material self-interest as well as cultural and income-based social affinity.
Economic self-interest
National-level inequality is measured as the average Gini coefficient of posttax household income over the five years prior to a survey as compiled by the Socio-Economic Database for Latin America and the Caribbean (SEDLAC).Footnote 2
An individual’s economic situation is measured using an index of household wealth derived from household assets, devised by Córdova (Reference Córdova2009). Specifically, the index considers whether the respondent’s household owns a television, refrigerator, conventional telephone, cellular telephone, washing machine, microwave oven, computer, or motor vehicle(s), as well as whether the home has indoor plumbing and an indoor bathroom. The variables are combined through principal component analysis to generate individual scores that are then sorted into five wealth quintiles.
As a robustness check, some models utilize LAPOP’s measure of self-reported income. Respondents are asked to “indicate (by privately picking a number from a card) the income bracket in which their total household income falls” (Córdova Reference Córdova2009, 1). The end result is a measure ranging from 1 to 10.
The models also include measures of the respondent’s subjective economic situation and education level. The former assesses whether the respondent feels their personal situation has improved (1), remained the same (0), or worsened (–1) over the last 12 months. Education is measured in years of schooling.
Cultural social affinity
No one measure can fully capture the complexity and subtlety of Latin America’s ethnic and cultural divisions. Therefore, this article uses three distinct measures.
The measure that best captures the underlying concept studied is Lieberman’s ethnic boundary index (2009, 247), an expert-coded measure of “the degree to which ethnic categories formally and informally structure social and political interactions in a polity.” This measure’s main advantage is that it focuses on the political salience of a country’s ethnic divisions rather than the objective level of ethnic diversity. To compensate for the potential subjectivity of Lieberman’s measure, national-level heterogeneity is also measured objectively as the sum of a country’s indigenous and Afro-descendant populations as a percent of total population, as reported in national censuses circa 2010 (Telles Reference Telles2014, 26). Models incorporating this measure exclude the Dominican Republic. Some models will disaggregate this variable into its component parts.
Cultural heterogeneity is also captured through Fearon’s (Reference Fearon2003) cultural fractionalization index (cdiv), which strikes a balance by combining both an objective measure of ethnic diversity with more subjective assessments of the extent to which diversity actually translates into “groupness,” meaning that ethnic groups are perceived as distinct from the majority group.
Although highly correlated, these measures are distinct. The correlation coefficients between ethnic boundaries and the minority population and cultural fractionalization are 0.71 and 0.82, respectively. The correlation between the latter two is 0.83.
Income-based social affinity
Following Lupu and Pontusson (Reference Lupu and Pontusson2011), economic distance between the middle and bottom of the income distribution is measured as the ratio of the income share of the fifth to the first decile (d5/d1). Similarly, the distance between the top and the middle of the distribution is measured as the ratio of the income share of the ninth to the fifth decile (d9/d5). Dividing the latter measure by the former [(d9/d5)/(d5/d1)] yields the skew of the income distribution. All three variables are based on averages from the five years prior to a survey and are calculated using SEDLAC data.
Antisolidarity and low credibility motives
These are tested through multiplicative interaction terms between the measures of cultural heterogeneity and the dichotomous variables measuring whether the respondent is in the bottom 40 percent of the population of asset wealth and self-reported income. Because the anti-solidarity motive pertains only to whites and mestizos, the region’s majority and high-status groups, the interaction term will be tested on samples containing only those groups. Because the low credibility motive pertains to the behavior of minorities, the interaction term will be tested on a sample consisting of only minorities.
Control Variables
Individual level
Select models will also control for perceptions of corruption, as well as whether an individual is employed in the informal sector. A widespread perception that government funds are misused or stolen could undermine support for taxation and redistribution. A four-point index is used to measure individual assessments of corruption severity (exc7). Models incorporating corruption perceptions cover only the years 2008–2014.
With regard to informality, earlier research has attributed the absence of a relationship between income and support for redistribution in Latin America to the exclusion of informal sector workers, and thus the bulk of the region’s needy from the main contributory social programs (Berens Reference Berens2015; Holland Reference Holland2018). Respondents are coded as informal if they describe themselves as self-employed (ocup1a). Including this variable reduces the total number of observations by half.
All models control for whether respondents identify as members of a minority (not white or mestizo), sex, number of children, and whether they are over 65.
National level
The models control for a country’s tax burden (total tax collection as share of GDP) and GDP growth, as well as GDP per capita. Tax data are compiled by the OECD (2021). GDP figures are compiled by the World Bank (2021).
Empirical Analysis
Table 1 presents the results of the multilevel logistic regressions. The analysis begins with a description of the general findings before discussing specific models and variables.
Table 1. Multilevel Logit Models of Support for Income Redistribution

Notes: +p <=0.1 *p <=0.5; ** p <=0.01; *** <=0.001 in two-tailed test.
Overall, the models strongly support the social affinity hypotheses. There is strong evidence that both cultural and income-based social affinity influence support for redistribution. Specifically, all three measures of the former—ethnic boundaries (1-1 and 1-2), minority share of the population (1-3 and 1-4), and cultural fractionalization (1-5 and 1-6)—have statistically significant and substantively large negative effects on the likelihood that an individual will strongly support redistribution. With regard to income-based affinity, income distribution skew has a statistically significant and substantively large positive effect (1-1, 1-3, and 1-5). However, the effect of skew’s component parts is mixed. The ratio of the income shares of deciles 5 and 1 (d5/d1) has a statistically significant negative effect (1-2, 1-4, and 1-6), meaning that as those near the middle of the income distribution pull ahead of those at the bottom, overall support for redistribution declines. However, the ratio of the shares of deciles 9 and 5 (d9/d5), while consistently positively signed, does not achieve statistical significance in any of the models tested.Footnote 3 The results for both types of social affinity are robust to controlling for a respondent’s perceptions of corruption (1-7) and whether they are employed in the informal sector (1-8).
Evidence for economic self-interest is less clear-cut. At the national level, in support of MVT, the Gini coefficient has a positive and significant effect in the models including income distribution skew (1-1, 1-3, and 1-5). This result, however, fails to hold when skew is disaggregated. In such models, inequality is significant, but only at the 0.10 level when controlling for minority share of the population (1-4), and fails to achieve significance when controlling for ethnic boundaries (1-2) and cultural fractionalization (1-6). Inequality is also significant when controlling for corruption (1-7) and informality (1-8). Even in the models where Gini is significant, coefficients tend to have large standard errors (averaging 1.53), resulting in substantial variation in coefficient values across models.
At the individual level, people with higher asset wealth are less likely to strongly support redistribution than wealthier individuals. Yet this effect is small. Moving up one quintile reduces the likelihood of strongly supporting redistribution by 0.71 percentage points on average, depending on the model. Moving from the bottom to the top quintile would reduce the likelihood of strongly supporting redistribution between 2.81 (1-1) and 2.94 (1-5) percentage points. Counter to the self-interest hypotheses, personal economic situation and years of education are consistently positively signed, though not consistently significant.
Moving to model 1-1, support for redistribution is lower in countries with stronger ethnic boundaries (0.01 level). Someone in a country with “mostly weak or permeable” boundaries (0.25), the most common level—for example, Colombia or Venezuela—has a 44.52 percent probability of strongly supporting redistribution, assuming all other continuous and dichotomous variables at their means and modes, respectively.Footnote 4 A one-unit (0.25) increase to the “intermediate levels” (0.50) found in Mexico would reduce that amount by 4.33 percentage points. A one-unit decrease to the “extremely weak or nonexistent” boundaries (0.00) found in Argentina and Costa Rica would increase that amount by 4.44 percentage points.Footnote 5 Moving from a country with the lowest level to one with “mostly strong or multiple” boundaries (0.75), such as Bolivia and Guatemala, would reduce the likelihood of strongly supporting redistribution by more than a quarter, from 48.94 percent to 35.99 percent (figure 1, left panel).Footnote 6 This effect is robust to substituting skew for its component parts (1-2) and the exclusion of any of the four countries with the most intense boundaries.Footnote 7

Figure 1. Likelihood of “strongly supporting” redistribution across observed values of ethnic boundaries (left), minority share of the population (center) and cultural fractionalization (right).
With regard to income-based social affinity, skew has a positive, substantively large, and highly significant (0.01 level) effect. At the sample average (0.655, close to Ecuador before 2008), the likelihood of strongly supporting redistribution is 43.31 percent, assuming all other continuous and dichotomous variables at their means and modes, respectively. A one-standard-deviation increase (0.121) increases the likelihood of strong support by 5.14 percentage points. A similar decrease reduces that figure by 5.00 percentage points. Moving from the country-year with the lowest skew (0.370, Bolivia before 2008) to the one with the highest (0.889, Chile before 2016) would increase this figure from 31.90 percent to 53.33 percent. This represents nearly 80 percent of the difference in average support between the countries most and least supportive of redistribution. This effect is robust to substituting ethnic boundaries with minority share of the population (1-3) and cultural fractionalization (1-5).
Inequality has the hypothesized statistically significant positive effect in this and other models that do not disaggregate skew. At the sample average (0.492, close to Paraguay prior to 2016), the likelihood of strongly supporting redistribution is 43.31 percent, assuming all other continuous and dichotomous variables at their means and modes, respectively. A one-standard-deviation increase (0.045) increases the likelihood of strong support by 4.61 percentage points. A similar decrease reduces that figure by 4.50 percentage points. However, the magnitude of this effect is quite volatile. In addition to not being significant in nearly half of the models in table 1, the magnitude of a one-standard-deviation increase relative to the mean varies by roughly 50 percent between the models with largest (1-3) and smallest (1-5) effects. For skew, that variation is 33 percent and, as noted, that variable is significant in every model.
Disaggregating skew, model 1-2 finds a negative and highly significant (0.01 level) effect of d5/d1 on support for redistribution. At the sample average (4.41, near Ecuador prior to 2010), the likelihood of strongly supporting redistribution is 43.20 percent, assuming all other continuous and dichotomous variables at their means and modes, respectively. A one-standard-deviation increase (1.25) decreases the likelihood of strong support by 6.54 percentage points. A similar decrease increases that figure by 6.78 percentage points. Moving from the country-year with the lowest gap (2.819, Chile prior to 2016) to the one with the highest (9.197, Bolivia prior to 2008) would decrease the likelihood of strongly supporting redistribution from 51.84 percent to 21.05 percent, an amount 10 percent larger than the average difference between the countries most and least supportive of redistribution. This variable’s effect is robust to substituting ethnic boundaries for minority share of the population (1-4) and cultural fractionalization (1-6).
Model 1-3 substitutes ethnic boundaries for minority share of the population, which also has a negative and highly significant effect (0.001 level). At the sample average (17.56 percent, slightly above Mexico’s level), the likelihood of strongly supporting redistribution is 42.88 percent, assuming all other continuous and dichotomous variables at their means and modes, respectively. A one-standard-deviation increase (14.26 percent) decreases the likelihood of strong support by 5.72 percentage points. A similar decrease increases that figure by 5.91 percentage points. Moving from the lowest share of minorities (0.30 percent, El Salvador) to the highest (51.4 percent, Brazil) would reduce the likelihood of strongly supporting redistribution by 40 percent, from 50.00 percent to 29.85 percent (figure 1, center panel). This effect holds when substituting skew for its components (1-4), as well as when any combination of the three most ethnically diverse countries is excluded.Footnote 8
Model 1-5 introduces cultural fractionalization, which also has a negative and highly significant effect (0.001 level). At the sample average (0.22, slightly higher than El Salvador’s level), the likelihood of strongly supporting redistribution is 45.22 percent, assuming all other continuous and dichotomous variables at their means and modes, respectively. A one-standard-deviation increase (0.23) decreases the likelihood of strong support by 5.84 percentage points. A similar decrease increases that figure by 5.97 percentage points. Moving from the least (0.000, Argentina, Dominican Republic and Uruguay) to the most (Bolivia, 0.662) fractionalized countries would reduce the likelihood of strongly supporting redistribution by a third, from 51.08 percent to 34.18 percent (figure 1, right panel). This effect holds when substituting skew for its components (1-6) as well as when any combination of the three most fractionalized countries is excluded.Footnote 9
At the cost of observations from 2016, model 1-7 controls for corruption perceptions.Footnote 10 Surprisingly, those who perceive corruption to be most pervasive are actually more likely to strongly support redistribution. A one-unit increase in perceptions increases the likelihood of strong support by 3.70 to 3.88 percentage points.
At the cost of nearly half of observations, model 1-8 controls for labor informality. Confirming earlier work by Berens (Reference Berens2015), informal sector workers are, despite their precarious economic situation, no more likely to strongly support redistribution than formal sector workers.
Cultural Divisions and the Poor
The previous section provided robust evidence that individuals in culturally and ethnically divided countries are less likely to strongly support redistribution than those in more homogenous countries. But do cultural divisions make those at the bottom of the income distribution less supportive of redistribution than their economic self-interest would otherwise predict? The models presented in table 2 tackle this question by incorporating multiplicative interaction terms between a country’s level of cultural divisions and a dichotomous variable measuring whether the respondent is in the bottom 40 percent in terms of assets (2-1 to 2-4) or self-reported income (2-5 to 2-8).
Table 2. Multilevel Logit Models of Support for Income Redistribution
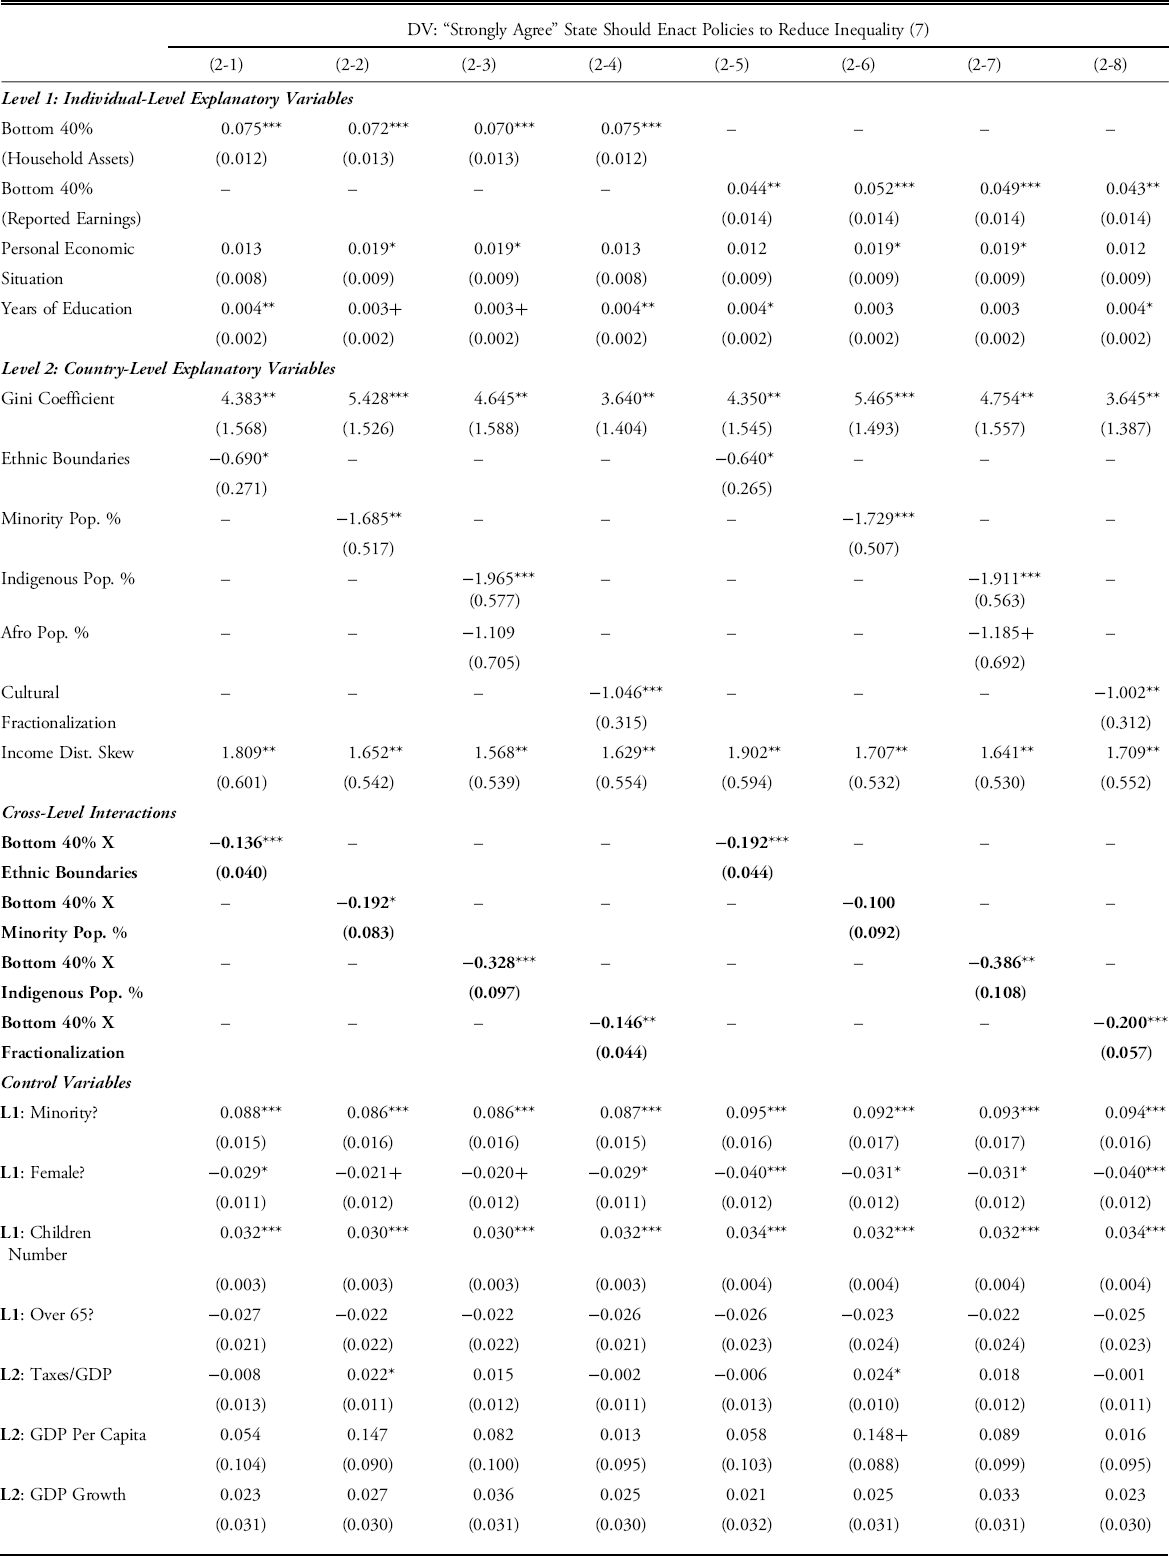
Notes: +p <=0.1 *p <=0.5; ** p <=0.01; *** <=0.001 in two-tailed test.
Overall, the models report statistically significant negative relationships between most of these interaction terms and support for redistribution. The interaction coefficients, however, cannot be interpreted in a straightforward manner. Properly assessing their direction and magnitude requires going beyond discussing coefficients and p-values by plotting their estimated consequences and respective confidence intervals (Brambor et al. Reference Brambor, Roberts Clark and Golder2006). This is done in figure 2.

Figure 2. Marginal effect of being in the bottom quintile of assets (top) and income (bottom) on the likelihood of “strongly supporting” redistribution across levels of ethnic boundaries (left), cultural fractionalization (center), and indigenous share of the population (right).
Turning to model 2-1, the top left panel of figure 2 shows that the positive effect on support for redistribution of being in the bottom 40 percent declines as ethnic boundaries intensify. Specifically, in countries with the weakest boundaries (0.00), those in the bottom 40 percent are 2.79 percentage points more likely to strongly support redistribution than their wealthier counterparts. This effect is 29 percent smaller (1.98 percentage points) in countries in the next category (0.25). A further intensification of ethnic boundaries (0.50) reduces the effect’s magnitude by a further 40 percent to 1.15 percentage points. The bottom 40 percent are no more likely than the rest of the population to strongly support redistribution in countries with the most intense boundaries (0.75).
Substituting ethnic boundaries with minority share of the population, model 2-2 (not shown) finds that the bottom 40 percent of respondents from El Salvador, the most homogenous country (0.3 percent minority), are 2.49 percentage points more likely to strongly support redistribution than wealthier individuals. The magnitude of this effect drops until the minority population reaches 36 percent (between Mexico and Peru), at which point it no longer differs from that of wealthier individuals.
Model 2-3 (figure 2, top center) disaggregates minorities into indigenous and Afro-descendant shares of the population and interacts the indigenous share with being in the bottom 40 percent. The bottom 40 percent of residents of El Salvador, which has the lowest indigenous share (0.2 percent), are 2.55 percentage points more likely to strongly support redistribution than wealthier individuals. The magnitude of this effect drops steadily until the indigenous share reaches 22 percent (between Mexico and Peru), at which point it no longer differs from that of wealthier individuals. The Afro-descendant share of the population, though negatively signed, does not have a statistically significant effect on the likelihood of strongly supporting redistribution.Footnote 11
These results are echoed in model 2-4, which incorporates cultural fractionalization (figure 2, top right). Individuals in the bottom 40 percent in countries with minimal fractionalization (0.00) are 2.56 percentage points more likely to strongly support redistribution than wealthier individuals.Footnote 12 The magnitude of this effect drops steadily until fractionalization reaches 0.480 (Ecuador’s level), at which point it no longer differs from that of wealthier individuals.
The robustness of these findings is tested by substituting the variable measuring being in the bottom 40 percent of household assets with one measuring being in the bottom 40 percent of self-reported income. By itself, income poverty has a small yet consistently positive significant effect on the likelihood of strongly supporting redistribution. As in the previous models, support for redistribution among the bottom 40 percent declines as cultural divisions intensify.
Model 2-5 (figure 2, bottom left) finds that low-income people in countries with the weakest boundaries (0.00) are 2.50 percentage points more likely to strongly support redistribution than richer ones. That effect drops to 1.34 percentage points in countries in the next category (0.25). The interaction is not significant at 0.50. However, it regains significance, albeit at the 0.10 level, at the most intense boundaries (0.75), where those in the bottom 40 percent are 0.89 percentage points less likely to strongly support redistribution than wealthier individuals.
As in model 2-3, the interaction involving the indigenous share follows the predicted pattern (figure 2, bottom center). Low-income people in El Salvador, the country with the lowest indigenous share (0.2 percent), are 2.20 percentage points more likely to strongly support redistribution than wealthier individuals. The magnitude of this effect drops steadily until 16 percent of the population (slightly higher than Mexico’s level), at which point it no longer differs from that of wealthier individuals. The effect becomes negative and significant at levels above 40 percent, close to the level found in Bolivia, the country with the highest share. Low-income Bolivians are expected to be 0.72 percentage points less likely to strongly support redistribution than their richer counterparts, though this finding is significant at only the 0.10 level.
A similar pattern is observed in model 2-8 (figure 2, bottom right). The bottom 40 percent in countries with minimal fractionalization (0) is 2.09 percentage points more likely to strongly support redistribution. The magnitude of this effect drops steadily until a fractionalization score of 0.30 (between El Salvador and Mexico), at which point it no longer differs from that of wealthier individuals.
Testing Anti-Solidarity and Low Credibility
The previous section provided robust evidence that low-asset and low-income individuals become less supportive of redistribution as cultural divisions intensify. What explains this finding? To answer this question, this section tests the anti-solidarity and low credibility motives by replicating model 2-1 on samples split by self-identified ethnic group.
Figure 3 separately plots the evolution of support for redistribution among whites (left panel), mestizos (center panel), and minorities (right panel) in the bottom 40 percent of assets across different levels of ethnic boundaries. For the sake of brevity, tables with the full models are not presented here but are included in the appendix (see appendix tables 1-3).

Most notably, there is strong evidence of the anti-solidarity motive among self-described whites with the likelihood of strongly supporting redistribution decreasing steadily as boundaries intensify (figure 3, left panel). Whites in the bottom 40 percent are both more likely to strongly support redistribution than their wealthier counterparts at low levels of ethnic boundaries and less likely to strongly support it at higher levels. Whites in the bottom 40 percent living in countries with extremely weak boundaries (0.00) are 3.90 percentage points more likely to strongly support redistribution. This effect decreases by almost half, to 1.68 percentage points, in countries with mostly weak and permeable boundaries (0.25). The interaction ceases to have a significant effect in countries with intermediate boundaries (0.50). However, the effect turns negative, albeit not at conventional levels of statistical significance (p = 0.086), in countries with mostly strong or multiple boundaries. In those countries, poor whites are 2.51 percentage points less likely than their richer counterparts to strongly support redistribution.
Although a similar pattern is present among self-described mestizos, the magnitude of the effect is so small as to be practically null (figure 3, center panel). Whereas mestizos in the bottom 40 percent are 1.83 percentage points more likely to strongly support redistribution in countries with the weakest boundaries (0.00), that figure drops by just 18.6 percent to 1.49 percentage points among those in the most divided countries (0.75). What explains this unexpected finding? It may be that despite making up the majority of the population, self-identified mestizos, as people who consciously see themselves as a mix of white and indigenous, simply do not perceive themselves to be as socially distant from minorities. Additional research is required to truly understand their motivations compared to those identifying as white.
There is also some support for the low credibility motive among self-described minorities in the bottom 40 percent. These findings, however, are significant at only the 0.10 level. In countries with the weakest boundaries (0.00), those in the bottom 40 percent are 1.98 percentage points more likely to strongly support redistribution (p = 0.051). This effect drops by almost half, to 1.11 percentage points, in countries with intermediate boundaries (0.25) (p = 0.97). At more intense levels of boundaries, those in the bottom 40 percent are no more likely to strongly support redistribution than their wealthier counterparts.
Summing up, the results strongly support the anti-solidarity mechanism among whites and offer some support for the low credibility mechanism among minorities. The larger figures, positive as well as negative, among whites relative to minorities imply that the anti-solidarity motive is stronger than the low credibility motive. These patterns persist when substituting ethnic divisions for cultural fractionalization (appendix figure 1) and minority share of the population (appendix figure 2).
Conclusions
Social policy is, at its essence, an act of compulsory solidarity. Governments compel individuals to forgo part of their income to fund redistribution. As De Beer and Koster (Reference De Beer and Koster2009, 43) note, “often, it is already known beforehand that particular groups will benefit more than they will contribute, while other groups will contribute more than they are expected to receive. Ex ante, there is no equivalence between contributions and receipts.” The greater the social distance between net recipients and net contributors and the more that people believe programs benefit “the other” rather than people “like themselves,” the less willing they will be to give up income to fund such policies.
Using Latin America as a case, this study has sought to arbitrate between theories that attribute individual support for redistribution to economic self-interest (self-oriented explanations) and those that emphasize social affinity (other-oriented explanations) (Cavaillé and Trump 2015; Alt and Iversen Reference Alt and Iversen2017). The statistical analyses conducted find stronger support for the latter. Individual support for redistribution within and across Latin American countries is better explained by solidarity—or more specifically, absence of solidarity—toward other groups than by economic self-interest, although there is evidence for both. Latin American attitudes toward redistribution are constructed by looking outward more than inward.
Specifically, this study makes two main contributions. First, it contributes to the debate regarding the relationship between income inequality and support for redistribution. Evidence in favor of the median voter theory is mixed. This, however, does not mean that income distribution is a weak or inconsistent determinant of demand for redistribution. What matters most is not the level of inequality (as stipulated in the MVT) but rather its structure or skew (Lupu and Pontusson Reference Lupu and Pontusson2011). Latin Americans are more likely to support redistribution when the distance between those in the middle and the poor is small relative to the distance between those in the middle and the rich. Furthermore, as middle-income individuals pull ahead of the poor, support for redistribution declines. Inequality does affect support for redistribution through the channel of the median voter, but not in the manner posited by Meltzer and Richard (Reference Meltzer and Richard1981).
Second, this study provides strong evidence that support for redistribution in the region is hampered by cultural and ethnic divisions. The more divided a country, the less likely individuals will be to strongly support redistribution. These divisions even make the poor less likely to support redistribution. In line with the anti-solidarity motive, the deeper these divisions are within a country, the less likely poor whites are to endorse redistribution. And in line with the low credibility motive, poor minorities appear to become less supportive of redistribution as those divisions deepen. In contrast, support for redistribution among low-income mestizos is not much affected by cultural and ethnic divisions.
More broadly, the finding that attitudes toward redistribution are better explained by other-oriented preferences constitutes a serious obstacle to the expansion of government-funded redistribution in the world’s most unequal region and, more broadly, in a world marked by rising inequality (Cavaillé and Trump 2015). The self-oriented MVT and other-oriented social affinity explanations paint starkly different portraits of the future of redistribution. MVT tells an optimistic story: greater inequality increases demand for redistribution and, given the median voter’s decisive role in democratic politics, increased redistribution. In contrast, other-oriented explanations posit that higher inequality, particularly in divided societies, can unleash a self-reinforcing spiral. Given their lower levels of solidarity, divided societies exhibit lower initial support for redistribution. Increasing social distance between different segments of the population may further reduce social affinity between them, also further reducing support for redistribution and, ultimately, provision of redistributive policies.
Future research should explore whether these findings extend to other developing regions where the connection between income and support for redistribution is weak, most notably the Middle East (Dion and Birchfield Reference Dion and Birchfield2010, 330), as well as the relationship between measures of social affinity and social policy provision in terms of spending levels and program design.
Table A1: Multilevel Logit Models of Support for Income Redistribution (Whites Only)

Notes: +p <=0.1 *p <=0.5; ** p <=0.01; *** <=0.001 in two-tailed test.
Table A2: Multilevel Logit Models of Support for Income Redistribution (Mestizos Only)

Notes: +p <=0.1 *p <=0.5; ** p <=0.01; *** <=0.001 in two-tailed test.
Table A3: Multilevel Logit Models of Support for Income Redistribution (Minorites Only)
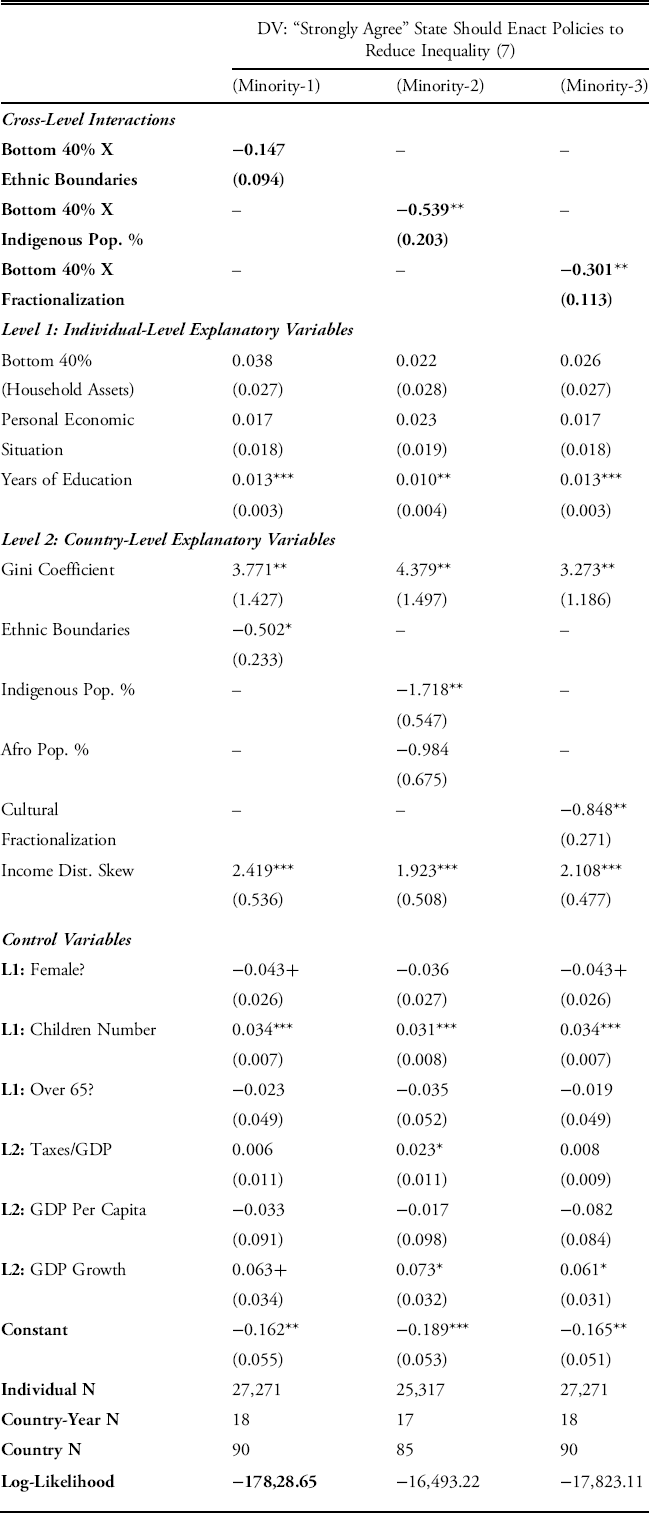
Notes: +p <=0.1 *p <=0.5; ** p <=0.01; *** <=0.001 in two-tailed test.


 Open access