


1. Introduction
Three-dimensional separated flows are an essential feature of lifting surfaces at high angle of attack, and have been studied extensively. There is a large amount of literature on analysing the complex three-dimensional vortex dynamics during steady flight (Taira & Colonius Reference Taira and Colonius2009; Zhang et al. Reference Zhang, Hayostek, Amitay, He, Theofilis and Taira2020a,Reference Zhang, Hayostek, Amitay, Burtsev, Theofilis and Tairab) and unsteady manoeuvres (Jantzen et al. Reference Jantzen, Taira, Granlund and Ol2014; Mancini et al. Reference Mancini, Manar, Granlund, Ol and Jones2015; Jones et al. Reference Jones, Medina, Spooner and Mulleners2016; Son & Cetiner Reference Son and Cetiner2017; Smith & Jones Reference Smith and Jones2020). However, none of these studies has addressed the underlying global linear instability mechanisms. Conversely, the majority of stability studies have focused on two-dimensional (Theofilis, Barkley & Sherwin Reference Theofilis, Barkley and Sherwin2002) or spanwise homogeneous (Kitsios et al. Reference Kitsios, Rodríguez, Theofilis, Ooi and Soria2009; He et al. Reference He, Gioria, Pérez and Theofilis2017a) wing configurations. The few studies of three-dimensional wings have analysed these geometries mainly at low angles of attack (He et al. Reference He, Tendero, Paredes and Theofilis2017b; Edstrand et al. Reference Edstrand, Schmid, Taira and Cattafesta2018), or have focused on a specific area of the flow such as the tip vortex (Edstrand et al. Reference Edstrand, Davis, Schmid, Taira and Cattafesta2016). Three-dimensional global (triglobal) non-modal stability analysis of a trailing vortex system over a finite wing (Navrose, Brion & Jacquin Reference Navrose, Brion and Jacquin2019) has demonstrated that addressing the three-dimensionality of finite wing wake through stability analysis allows a better understanding of the underlying physical mechanisms. However, the relatively low angles of attack considered in Navrose et al. (Reference Navrose, Brion and Jacquin2019) led to a fairly simple vortical structure of the underlying base flows. In our recent work, several families of unstable global modes of separated flow over finite wings were discovered using triglobal modal stability analysis, and their evolution with wing geometry was documented (Burtsev et al. Reference Burtsev, He, Zhang, Theofilis, Taira and Amitay2022).
In the context of hydrodynamic stability analysis, the adjoint Navier–Stokes equations have been used to study the receptivity (Fedorov Reference Fedorov1984; Hill Reference Hill1995; Luchini & Bottaro Reference Luchini and Bottaro1998; Giannetti & Luchini Reference Giannetti and Luchini2006; Tumin Reference Tumin2011) and sensitivity (Hill Reference Hill1992; Chomaz Reference Chomaz2005; Giannetti & Luchini Reference Giannetti and Luchini2007; Giannetti, Camarri & Luchini Reference Giannetti, Camarri and Luchini2010) of nominally steady laminar flows. Adjoint analysis has played an essential role in understanding the stability properties of the classical two-dimensional cylinder flow. Giannetti & Luchini (Reference Giannetti and Luchini2007) introduced the concept of structural sensitivity (wavemaker region), which is proportional to the product of the direct and adjoint eigenfunctions, to reconcile the seemingly contradicting results of Hill (Reference Hill1992) and Pier (Reference Pier2002). It was shown that the wavemaker is located inside the near wake, consistent with dispersive wave theory (Pier Reference Pier2002), and not at the cylinder surface as suggested by considering only the adjoint eigenfunctions (Hill Reference Hill1992), or the far wake as indicated by the location of peak linear oscillations (Zebib Reference Zebib1987). The wavemaker of Giannetti & Luchini (Reference Giannetti and Luchini2007) displays the sensitivity to a structural perturbation that acts on the time-varying disturbance and leaves the base flow unperturbed, whereas the experimental results of Strykowski & Sreenivasan (Reference Strykowski and Sreenivasan1990) show the sensitivity under a perturbation of both the base flow and disturbance since both are affected by the control cylinder (Luchini & Bottaro Reference Luchini and Bottaro2014).
The applications of adjoint stability analysis to lifting body flows have been more scarce. Fosas de Pando, Schmid & Sipp (Reference Fosas de Pando, Schmid and Sipp2014) used adjoint sensitivity analysis to study tonal noise generated by a NACA 0012 wing section at  $Re=2 \times 10^5$. In the context of compressible flows, adjoint methods have been used to analyse the transonic buffet phenomenon (Iorio, González & Ferrer Reference Iorio, González and Ferrer2014; Paladini et al. Reference Paladini, Beneddine, Dandois, Sipp and Robinet2019). Very recently, Nastro et al. (Reference Nastro, Robinet, Loiseau, Passaggia and Mazellier2023) conducted global stability and sensitivity analysis of spanwise-homogeneous laminar separated flows around NACA 4412 swept wings at
  $100\leq Re \leq 400$. It was shown that a streamwise-oriented force has a net stabilising effect in a region on the suction side of the wing. Predictions of sensitivity analysis were verified using flow control, which showed that a spanwise-homogeneous force suppresses the Hopf bifurcation and stabilises the entire branch of von Kármán modes. It was also demonstrated that for small amplitudes, passive control via spanwise wavy forcing produced a similar stabilising effect.
So far, adjoint global modes have not been computed for finite wings at high angles of attack, nor has the structural sensitivity of such flow been considered. This work aims to bridge this knowledge gap by documenting the adjoint modes and structural sensitivity for a range of finite wings for the purposes of informing future flow control applications. The rest of this paper is organised as follows. The theory behind direct and adjoint linear stability analysis is discussed briefly in § 2, with an explanation of numerical methods in § 2.4. The discussion of results (§ 3) focuses on the effects of Reynolds number and sweep angle. Finally, the flow is modified by forcing at the locations suggested by the stability analysis.
2. Methodology
2.1. Linear stability theory
The evolution of velocity  $\boldsymbol {u}=(u,v,w)^{\rm T}$ and pressure
  $p$ is governed by non-dimensional, incompressible Navier–Stokes and continuity equations. The flow
  $\boldsymbol {q}(\boldsymbol {x},t) = (\boldsymbol {u}, p)^{\rm T}$ can be decomposed into a steady base flow component
  $\bar {\boldsymbol {q}}$ and a small perturbation
  $\tilde {\boldsymbol {q}}$:
 \begin{equation} \boldsymbol{q} = \bar{\boldsymbol{q}} + \varepsilon \tilde{\boldsymbol{q}}, \quad \varepsilon \ll 1. \end{equation}
The linearised Navier–Stokes equations (LNSE) are obtained by substitution of (2.1) into the governing equations and neglecting  $O(\varepsilon ^2)$ terms:
 \begin{equation} \partial_t {\tilde{\boldsymbol{u}}} + \bar{\boldsymbol{u}} \boldsymbol{\cdot} \boldsymbol{\nabla}{\tilde{\boldsymbol{u}}} + \tilde{\boldsymbol{u}} \boldsymbol{\cdot} \boldsymbol{\nabla}{\bar{\boldsymbol{u}}} ={-}\boldsymbol{\nabla} \tilde{p} + Re^{{-}1}\,\nabla^2 \tilde{\boldsymbol{u}}, \quad \boldsymbol{\nabla} \boldsymbol{\cdot} \tilde{\boldsymbol{u}} = 0, \end{equation}
with the Reynolds number defined as  $Re \equiv U_\infty c/\nu$, where
  $U_\infty$ is the free-stream velocity,
  $c$ is the wing chord (in the flight direction), and
  $\nu$ is the kinematic viscosity. The time and space coordinates in (2.2) can be separated by introducing a Fourier decomposition in time. For the three-dimensional flow, triglobal (Theofilis Reference Theofilis2011) linear stability theory is used, leading to the ansatz
 \begin{equation} \tilde{\boldsymbol{q}}(\boldsymbol{x},t) = \hat{\boldsymbol{q}}(\boldsymbol{x})\,{\rm e}^{-{\rm i}\omega t} + {\rm c.c.}, \end{equation}
where  $\hat {\boldsymbol {q}}$ is the amplitude function, and c.c. is a complex conjugate. The triglobal eigenvalue problem is formed by substituting (2.3) into (2.2):
 \begin{equation} \boldsymbol{A} \hat{\boldsymbol{q}} ={-}{\rm i}\omega \hat{\boldsymbol{q}}, \end{equation}
with the matrix  $\boldsymbol {A}$ representing the spatial discretisation of the operator
  $\mathcal {L}$, which contains the LNSE, consisting of the base flow
  $\bar {\boldsymbol {q}}(\boldsymbol {x})$ and its spatial derivatives. The eigenvalue problem (2.4) is solved numerically to obtain the complex eigenvalues
  $\omega$ and the corresponding eigenvectors
  $\hat {\boldsymbol q}$, which are referred to as the global modes. The real and imaginary components of the complex eigenvalue
  $\omega =\omega _r + {\rm i}\omega _i$ correspond to the frequency and the growth/decay rate of the global mode, respectively.
2.2. Adjoint equations
The structural sensitivity of the global modes to modifications of the base flow can be calculated by constructing the adjoint operator  $\mathcal {L}^+$ (Giannetti & Luchini Reference Giannetti and Luchini2007; Luchini & Bottaro Reference Luchini and Bottaro2014). The adjoint operator
  $\mathcal {L}^+$ is defined through the Lagrange identity
 \begin{equation} \langle \mathcal{L}^+ \tilde{\boldsymbol{q}}^+, \tilde{\boldsymbol{q}} \rangle = \langle \tilde{\boldsymbol{q}}^+, \mathcal{L}\tilde{\boldsymbol{q}} \rangle, \end{equation}
where  $\tilde {\boldsymbol {q}}^+$ is the vector of adjoint flow variables,
  $\tilde {\boldsymbol {q}}^+ = (\tilde {\boldsymbol {u}}^+, \tilde {p}^+)^{\rm T}$, whose meaning will be explained later, and
  $\langle \,,\,\rangle$ denotes an inner product. Applying differentiation by parts and examining the terms of the identity, the adjoint counterpart of the LNSE can be defined as
 \begin{equation} \partial_t {\tilde{\boldsymbol{u}}}^+ + \bar{\boldsymbol{u}} \boldsymbol{\cdot} \boldsymbol{\nabla}{\tilde{\boldsymbol{u}}}^+ - \tilde{\boldsymbol{u}}^+ \boldsymbol{\cdot} \boldsymbol{\nabla}{\bar{\boldsymbol{u}}} ={-}\boldsymbol{\nabla} \tilde{p}^+ - Re^{{-}1}\,\nabla^2 \tilde{\boldsymbol{u}}^+, \quad \boldsymbol{\nabla} \boldsymbol{\cdot} \tilde{\boldsymbol{u}}^+ = 0. \end{equation}
The same steps described above for the LNSE can be used to obtain the adjoint eigenvalue problem. The resulting adjoint global modes are the non-trivial solutions of the adjoint LNSE of the form
 \begin{equation} \tilde{\boldsymbol{q}}^+(\boldsymbol{x},t) = \hat{\boldsymbol{q}}^+(\boldsymbol{x})\,{\rm e}^{{\rm i}\omega^+ t} + {\rm c.c.}, \end{equation}
where  $\omega ^+$ is the complex conjugate of
  $\omega$, and
  $\hat {\boldsymbol {q}}^+ = (\hat {\boldsymbol {u}}^+, \hat {p}^+)^{\rm T}$. At a given point in the flow, the values of adjoint velocity
  $\tilde {\boldsymbol {u}}^+$ and pressure
  $\tilde {p}^+$ perturbations indicate the response to an unsteady momentum and mass source at that point, respectively.
2.3. Sensitivity
To investigate how the instability changes as a function of the physical parameters, a structural perturbation can be introduced to the eigenvalue problem in (2.4). This means considering the changes of the structure, i.e. the matrix  $\boldsymbol {A}$ under an infinitesimal operator perturbation
  ${\rm d} \boldsymbol {A}$. Taking the differential of both sides of (2.4) and eliminating the eigenvector perturbation with the adjoint eigenvector
  $\hat {\boldsymbol {q}}^+$ gives an expression for the eigenvalue perturbation:
 \begin{equation} {\rm d}\omega = \frac{\hat{\boldsymbol{q}}^+\,{\rm d}\boldsymbol{A}\, \hat{\boldsymbol{q}}}{\hat{\boldsymbol{q}}^+ \hat{\boldsymbol{q}}}. \end{equation}
As demonstrated by Giannetti & Luchini (Reference Giannetti and Luchini2007), the spatial sensitivity map is proportional to the product of the direct and adjoint perturbation velocities:
 \begin{equation} S(\boldsymbol{x}) = \frac{\|\hat{\boldsymbol{u}}^+(\boldsymbol{x})\| \boldsymbol{\cdot} \|\hat{\boldsymbol{u}}(\boldsymbol{x})\|}{\| \langle \hat{\boldsymbol{u}}^+,\hat{\boldsymbol{u}} \rangle \|}. \end{equation}
Equation (2.9) defines the spatial region where a modification in the structure of the problem leads to the greatest drift of the eigenvalue. The location corresponding to the maximum values of this spatial receptivity field can be thought of as the wavemaker region, i.e. the origin of the self-excited oscillations of the unstable global mode. The adjoint field  $\|\hat {\boldsymbol {u}}^+\|$ represents the receptivity of the global mode to momentum forcing and the initial conditions of the temporal stability problem. The spatial distribution of
  $\|\hat {\boldsymbol {u}}^+\|$, which will be referred to as the receptivity field, indicates the regions of the flow that are most responsive to momentum forcing.
2.4. Numerical methods
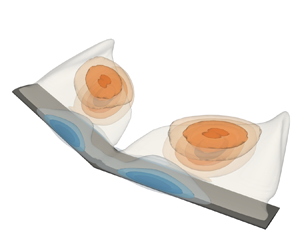
The untapered, untwisted wing is constructed using a NACA 0015 aerofoil. A symmetric wing half model, with semi-aspect ratio  $sAR=b/2c=4$, angle of attack
  $\alpha =22^\circ$, and a range of angles of sweep (
 $\varLambda$) and
  $Re$, is considered as shown in figure 1(a). For the swept cases, the free-stream velocity is kept constant. A structured C-type mesh was constructed using Gmsh (Geuzaine & Remacle Reference Geuzaine and Remacle2009). The equations of motion are solved using an open-source spectral element code Nek5000 (Fischer, Lottes & Kerkemeier Reference Fischer, Lottes and Kerkemeier2008). Within each mesh element, the spectral code resolves flow quantities using high-order Lagrange polynomials. The macroscopic elements and one cell with the mesh resulting from a high-order polynomial fitting are shown in figure 1(b). The mesh extends
  $25c$ in from the wing in the
  $x$ and
  $y$ directions, and
  $16 c$ from the wing tip in
  $z$. Uniform free-stream conditions (
 $u=U_\infty$,
  $v=0$,
  $w=0$) are assigned to the domain boundaries ahead, as well as above and below the wing. Symmetry boundary conditions (
 $w=0$,
  $\partial _z v=0$,
  $\partial _z w=0$) are assigned at the root of the wing and outflow behind wing. To achieve steady base flows for stability analysis at conditions when no natural steady state exists, selective frequency damping is used (Åkervik et al. Reference Åkervik, Brandt, Henningson, Hœpffner, Marxen and Schlatter2006). Stability analysis in Nek5000 utilises matrix-free time-stepping methods. The matrix-free approach avoids storing the large matrices resulting from the spatial discretisation of the LNSE operator, and instead determines the eigenvalues by relying only on matrix–vector operations (Knoll & Keyes Reference Knoll and Keyes2004). This is done by solving for the Fréchet differential to obtain approximations of the Jacobian matrix (Eriksson & Rizzi Reference Eriksson and Rizzi1985). The global eigenvalue problem can then be solved by using the Arnoldi algorithm (Arnoldi Reference Arnoldi1951), which relies on generating a Krylov subspace by repeated application of the discretised Jacobian matrix to an arbitrary initial vector. In the iterative time stepping, the subspace is formed by repeated evaluation using the simulation code of the time-dependent operator at successive equidistant instances in time (Barkley, Blackburn & Sherwin Reference Barkley, Blackburn and Sherwin2008; Bagheri et al. Reference Bagheri, Åkervik, Brandt and Henningson2009).

Figure 1. Wing geometry and mesh resolution showing (a) a top for a swept wing, (b) the structure of the mesh near the wing, and (c) the forcing region location.
3. Results
The direct and adjoint eigenspectra are shown in figures 2(a,d) for swept and unswept wings at  $Re=400$. Figures 2(b,c) and 2(e,f) show the corresponding structures of the direct and adjoint modes A and C plotted with the vertical perturbation velocity component. The grey contours indicate the reversed flow region of the laminar separation bubble (LSB). Following the classification introduced by Burtsev et al. (Reference Burtsev, He, Zhang, Theofilis, Taira and Amitay2022), the unstable modes are labelled A, B and C. Mode A is the most unstable mode that peaks at the spanwise location of the peak extent of the LSB, where the recirculation flow is maximised. Mode B has almost the same frequency (expressed as the non-dimensional Strouhal number
  $St \equiv \omega c \sin (\alpha )/(2{\rm \pi} U_\infty )$) and spatial structures as mode A but different phase, with structures shifted further downstream of the wing. Finally, mode C has a higher frequency and distinctly different structures, which occupy a larger spanwise portion of the wing. As the sweep angle is increased, the maximum recirculation region of the LSB moves towards the tip. The separation point near the leading edge at the symmetry plane gradually moves downstream, while the reattachment point near the trailing edge moves upstream. This is caused by the strengthening of the respective leading and trailing edge spanwise vortical structures. The leading direct global mode A closely follows the spanwise location of the peak recirculating region, while mode C has wider structures slanted against the downstream edge of the LSB. The adjoint modes have periodic structures similar to their direct counterparts but slanted in the opposite direction. The eigenfunctions of adjoint modes are strongest over the wing and inside the LSB. For the swept case, the periodic structures of the adjoint modes over the wing are primarily parallel to the edge of the reversed flow region shown by transparent grey contour of
  $\bar {u}=0$ in figures 2(e,f).

Figure 2. Effect of sweep on global modes for  $(sAR,\alpha,Re)=(4,22^\circ,400)$. The spectrum for (a)
  $\varLambda =0^\circ$ and (d)
  $\varLambda =15^\circ$, and (b,c,e,f) eigenvectors of the adjoint (left-hand images) and direct modes (right-hand images). Mode A in (b,e) and mode C in (c,f) are plotted with contours of
  $\hat {v}=\pm 0.1$ and
  $\pm 0.05$ (transparent).
3.1. Effect of the Reynolds number
Figure 3 shows the variation of the wavemaker of the leading mode (see (2.9)) with Reynolds number in the range  $200\le Re\le 500$. The region of maximum sensitivity is located within the LSB. As
  $Re$ increases, the spanwise extent of the wavemaker reduces. Looking at the side view and slice at the symmetry plane in figures 3(b,c), two lobes associated with the suction and pressure side shear layers and some structure inside the LSB can be seen. At
  $Re=200$ and
  $300$, the side view of the wavemaker is reminiscent of the classical two-dimensional cylinder (Giannetti & Luchini Reference Giannetti and Luchini2007) and spanwise homogeneous wing flows (Nastro et al. Reference Nastro, Robinet, Loiseau, Passaggia and Mazellier2023). At
  $Re \geq 400$, the maximum sensitivity appears to be more dependent on the shear layers with low values inside the bubble. At the maximum
  $Re$ of 500, the wavemaker has two distinct shear layer branches located further downstream of the wing.

Figure 3. The effect of  $Re$ on sensitivity and receptivity of mode A. (a) Top and (b) side views with
  $\bar {u}=0$ contour in grey, and (c) a slice at
  $z=0$ with
  $\bar {u}=0$ contour in black.
The blue contours in figure 3 show the magnitude of the adjoint perturbation velocities  $\|\boldsymbol {u}^+\|$, which represent the receptivity to momentum forcing. The regions of maximum receptivity are located near the leading edge above the suction side, and near the trailing edge of the wing. These three-dimensional contours are projected onto the plane of the wing and plotted in figure 4. It should be noted that the value of the receptivity field at the wing surface is zero, and the projection is made to show where the receptivity regions are located relative to the separation and reattachment lines of the LSB. The contour levels
  $0.2 \leq \|\hat {\boldsymbol {u}}^+\| \leq 0.9$ are plotted with the wing surface streamlines of the selective frequency damping (SFD) base flow. It can be seen clearly that the maximum of the receptivity field is located above the separation line. The spanwise location of this maximum coincides with that of a reattachment node (labelled N) in the steady base flow. This node N marks the spanwise position of the maximum reversed flow region of the LSB. The reduction of the spanwise extent of the receptivity region can be seen clearly up to
  $Re=400$. At
  $Re \geq 400$, the region remains essentially the same size.

Figure 4. Projections of contours of  $\|\hat {\boldsymbol {u}}^+\|$ (blue) of mode A onto the plane of the wing with surface streamlines of the base flow and the contour of
  $\bar {u}=0$ (black).
3.2. Effect of sweep angle
The variation of the wavemaker and receptivity to momentum forcing regions of modes A and C with  $\varLambda$ is plotted in figure 5. The spatial peak of both the adjoint mode A and the wavemaker region is concentrated at the spanwise location of maximum reversed flow (peak recirculation) in the bubble, where a peak in the streamwise extent of the reversed flow region is observed. This also corresponds to the spanwise position of the reattachment node seen on the wing surface in figure 4. These regions follow the spanwise displacement of the maximum reversed flow location, moving towards the tip as
  $\varLambda$ is increased. At
  $\varLambda =15^\circ$, these structures are located near the wing tip. The structure of the wavemaker region remains largely the same, with two separate lobes associated with the top and bottom shear layers of the LSB, with the latter region considerably smaller at
  $\varLambda =15^\circ$.

Figure 5. The effect of  $\varLambda$ on
  $S(\boldsymbol {x})$ (orange) and
  $\|\hat {\boldsymbol {u}}^+\|$ (blue) of modes A and C.
The regions of receptivity and the wavemaker for mode C are wider in the spanwise direction and do not show a clear displacement towards the tip. Similar to mode A, the wavemaker of mode C has two lobes associated with the shear layers. However, unlike mode A, these regions are connected with higher values of the wavemaker inside the LSB, as seen in the side views of figure 5. In the chordwise direction, the peak receptivity location for modes A and C is associated with the leading edge separation line. As for the unswept wing, the adjoint mode A remains very compact in the spanwise direction, whereas mode C occupies a larger portion of the wing's span. At  $\varLambda =15^\circ$, the receptivity field of mode A overlaps with that of mode C. This is because the adjoint mode A has more structure along the wing's span, as shown in the left-hand image of figure 2(e).
3.3. Flow actuation
Flow actuation is carried out on an unswept wing at  $Re=200$, and both a swept wing and an unswept wing at
  $Re=400$. The forcing is applied as a boundary condition for wall-normal velocity in a region along the separation line (see figure 1c) at the spanwise location where stability analysis indicated significant receptivity to momentum forcing. The streamwise width (
 $w$) of the forcing region is
  $2\,\%$ chord, and the spanwise length (
 $l$) and position are adjusted. Actuation is applied to the base flow used in the stability analysis in order to observe the effects on the growth of the leading mode and the onset of shedding. The
  $Re=200$ case is chosen due to the low amplification levels of the leading mode, which results in a slower onset of wake shedding. The results for different types of actuation are shown in figure 6. The ratio of the total wing lift coefficient (
 $C_L$) to the total drag coefficient (
 $C_D$) is plotted, with the lines denoting the time-averaged values, whereas the shaded regions indicate the envelope of the oscillations.

Figure 6. Effects of forcing on the lift-to-drag ratio over the  $(sAR,\varLambda,\alpha,Re)=(4,0^\circ,22^\circ,200)$ wing: (a) blowing and suction at
  $0 \leq z \leq 1$, (b) blowing at
  $0 \leq z \leq 1$, (c) suction at
  $0 \leq z \leq 1$, and (d) suction at three different spanwise regions.
Effects of periodic excitation (Greenblatt & Wygnanski Reference Greenblatt and Wygnanski2000) are shown in figure 6(a). The wall-normal velocity ( $u_n$) of
  $a \sin (\omega t)$ was assigned. Here,
  $\omega$ is the frequency of the leading global mode, and
  $a$ is the amplitude (fraction of the free-stream velocity). For this case,
  $\omega =1.952$, corresponding to
  $St=0.311$ and reduced forcing frequency (Greenblatt & Wygnanski Reference Greenblatt and Wygnanski2000)
  $F^+ \equiv \omega x_{TE}/(2{\rm \pi} U_\infty )=0.249$. The location where the time-periodic boundary condition is applied was selected to be
  $0 \leq z \leq 1$, which lies within the contour line
  $\|\hat {\boldsymbol {u}}^+\|=0.7$ in figure 4. It can be seen that periodic forcing at this location accelerates the onset of wake shedding. For lower-amplitude forcing at
  $a=1\,\%\,U_\infty$, the response is largely linear, and both the final average
  $C_L/C_D$ value and the fluctuation amplitude are virtually identical to the baseline. For the higher-amplitude forcing at
  $a=10\,\%\,U_\infty$, the shedding occurs even faster, and there are significant low-frequency fluctuations of the mean value.
Next, the effect of steady blowing applied at the same location ( $0 \leq z \leq 1$, blue region in figure 7) is shown in figure 6(b). Again, two levels corresponding to 1 % and 10
  $\%$ of
  $U_\infty$ are used. For
  $a=1\,\%\,U_\infty$, there is virtually no difference compared to the baseline case, although the onset of shedding is very slightly delayed. For blowing at
  $a=10\,\%\,U_\infty$, the
  $C_L/C_D$ value is immediately reduced, the onset of unsteady shedding is accelerated, and the amplitude of
  $C_L/C_D$ fluctuations is increased. Steady suction at the same location is then considered in figure 6(c). The time-averaged value of
  $C_L/C_D$ is increased for both forcing strengths. For
  $10\,\%$ suction, the amplitude of oscillations is reduced by
  $62\,\%$, whereas for
  $1\,\%$ suction, the amplitude remains nearly the same. However, the mean value of
  $C_L/C_D$ remains nearly identical to the baseline in the long term for both cases.

Figure 7. Locations of the forcing regions: blue for  $0 \leq z \leq 1$, red for
  $0 \leq z \leq 3$, and green for
  $2 \leq z \leq 3$. The widths of the regions are not to scale.
The suction case is considered in more detail in figure 6(d). The strength of suction is fixed at  $10\,\%\,U_\infty$, and the region where it is applied is varied. Three regions are selected, with
  $0 \leq z \leq 1$,
  $0 \leq z \leq 3$ and
  $2 \leq z \leq 3$, marked by blue, red and green, respectively, in figure 7. The value of the wall-normal velocity is reduced by a third for the red region to maintain the same mass flow rate. Forcing in the red and green regions results in higher average values of the lift-to-drag ratio but also increases the amplitude of the oscillations by
  $4\,\%$ and
  $40\,\%$, respectively. Interestingly, only when suction is applied in the blue region, corresponding to maximum receptivity to momentum forcing, is the amplitude reduced, while the mean value remains the same. In addition, the difference in average
  $C_L/C_D$ at early times compared to long term is also substantially reduced in this case.
The effects of actuation on the growth of the global modes identified by linear instability analysis on the swept wing are studied by monitoring the evolution of the flow field when low-amplitude forcing is applied at distinct locations on the suction side of the wing. For consistency with linear theory, one order of magnitude lower forcing amplitude,  $0.01 U_\infty$, and the highest presently attainable Reynolds number,
  $Re=400$, have been chosen.
In figure 8 a comparison is presented between results obtained by applying forcing on an unswept and a  $10^{\circ}$ swept wing, both at an angle of attack
  $\alpha =22^\circ$, at the colour-coded regions defined in relation to the projection of the receptivity contours onto the wing and in figures 8(a,b). The colours of the lines in figures 8(c–f) match those defined along the specific spanwise regions in figures 8(a,b). Periodic forcing at amplitude
  $a=0.01$ and the corresponding frequency of the leading global mode of each case are imposed, and a distinction is made between in-phase and anti-phase forcing with respect to the corresponding baseline, respectively indicated by
  $P+$ and
  $P-$ on the plots. By contrast to figure 6, only the running time average of the
  $C_L/C_D$ fluctuations is plotted in figures 8(c,d), where the envelope of the signal and its instantaneous values have been omitted for clarity.

Figure 8. Effects of wing sweep on actuation at  $Re=400$,
  $\alpha =22^\circ$. (a,b) Locations of the forcing regions with respect to the contours of the receptivity to momentum forcing (blue), (c,d) time average of the
  $C_L/C_D$ fluctuations, and (e,f) the frequency of the
  $C_L/C_D$ fluctuations at
  $0 \leq t \leq 10$ compared to the global mode frequency (vertical line).
Compared to the  $Re=200$ results shown in figure 6, the transition to unsteadiness at
  $Re=400$ takes place faster, and the forcing at the same amplitude has a smaller effect, which is unsurprising given the higher amplification rate of the leading unstable global mode at these conditions. However, the overall effect at the two Reynolds numbers is analogous, with periodic forcing in phase with the baseline clearly accelerating the transition to unsteadiness at both sweep angles. In addition, it can be seen that same-frequency forcing, imposed approximately out of phase with the baseline, results in a small delay of amplification. Most significantly, at both sweep angles, forcing imposed in the region of maximum overlap with the peak receptivity to momentum forcing produces the greatest departure from the baseline, with same-amplitude forcing at the two inboard regions at
  $\varLambda =10^\circ$ resulting in negligible effects compared to the baseline.
Figures 8(e,f) show the power spectral density of the  $C_L/C_D$ fluctuations, obtained by Fourier transform of the signals corresponding to the running averages shown in figures 8(c,d), but restricting the respective function supports at early (
 $0 \leq t \leq 10$) times, where the growth of the instabilities is still linear. The curves have been normalised by their respective maxima for clarity. The vertical dashed lines denote the frequency of the leading global mode at each sweep angle. It can be seen that the frequency matches that of the mode and forcing. For both cases, the anti-phase case consistently exhibits slightly lower frequency, which is associated with the anti-phase forcing modifying the flow. In summary, forcing at the regions of maximum receptivity to momentum forcing results in greater departure from the baseline case, compared to forcing at the same amplitude elsewhere on the wing. As has long been established in canonical two-dimensional base flows (e.g. Giannetti & Luchini (Reference Giannetti and Luchini2007) on the cylinder and Citro et al. (Reference Citro, Giannetti, Brandt and Luchini2015) on the cavity), linear global stability analysis can also help to identify optimal regions for actuator positioning in the present fully three-dimensional flow, and also serve as a basis for theoretically founded control of the ensuing nonlinear flow (Sipp Reference Sipp2012); the latter will be pursued in future efforts.
4. Conclusion
Adjoint triglobal eigenmodes on a finite aspect ratio wing at high angle of attack have been computed for the first time. The regions of maximum sensitivity and receptivity were calculated, and their variation with Reynolds number and wing sweep angle was documented in the low- $Re$ range examined. The wavemaker of the leading global eigenmode was shown to lie inside the laminar separation bubble (LSB) at the spanwise location of peak recirculation. Increasing
  $Re$ leads to the structures of both the global mode and the wavemaker becoming more compact in the spanwise direction. At the highest
  $Re$ presently considered,
  $Re=500$, the wavemaker is concentrated in the top and bottom shear layers of the LSB. As sweep is introduced to the wing, the wavemaker moves towards the wing tip following the spanwise displacement of maximum recirculation. The region of maximum receptivity of the leading eigenmode is located near the separation line and is compact in the spanwise direction. Its spanwise position is linked to the reattachment node present on the suction side of the wing in the steady base flow. The compact nature of both the wavemaker and the regions of maximum receptivity to momentum forcing and the variation of their locations with increased sweep angle is of practical significance for flow control. This implies that if actuators were positioned evenly along the span of the wing, then only a few that coincide with the location of the receptivity region would be most effective.
Modification of the flow by periodic and steady forcing was applied at locations of maximum receptivity to momentum forcing identified using the stability analysis. At both Reynolds numbers considered herein, low-amplitude periodic forcing at the frequency of the leading global mode identified in earlier work was shown to accelerate the onset of wake shedding on both swept and unswept wings. These results are intended to act as a stepping stone in understanding the instability mechanisms at higher Reynolds numbers.
Acknowledgements
The authors gratefully acknowledge the help of Dr P. Negi with Nek5000.
Funding
This work was funded by AFOSR grant FA9550-21-1-0174 (programme officer Dr G. Abate). Computational time on ARCHER2 was provided by UKTC grant EP/X035-484/1.
Declaration of interests
The authors report no conflict of interest.


 Open access