


1. Introduction
Compressors such as aeroengines and gas turbines are among the primary noise sources in turbomachinery. High sound pressure noise generated by compressors is an important factor contributing to blade vibration failure. The acoustic resonance phenomenon is caused by fluid-induced cavity sound generation, similar to other acoustic phenomena such as Helmholtz resonators, whistling and howling. The acoustic resonance of a compressor refers to the flow inside the resonant cavity formed by the blade channel and the resonance phenomenon induced by the multi-field ‘fluid–acoustic–structure’ interaction between sound waves and the blade structure (Holzinger et al. Reference Holzinger, Wartzek, Schiffer, Leichtfuss and Nestle2016). Acoustic resonance can cause sound pressure amplitudes to exceed 160 dB, which is equivalent to or several times the level of the incoming flow pressure. This large pressure oscillation can significantly affect compressor efficiency. If the natural frequency of the blade is consistent with the acoustic resonance frequency, the vibration stress of the blade will significantly increase, potentially causing fracture (Parker & Stoneman Reference Parker and Stoneman1987; Liu et al. Reference Liu, Willeke, Herbst, Yang and Seume2018).
The acoustic resonance of compressor blades results from the interaction between the blade shedding vortex or tip clearance vortex and the internal acoustic modes of the compressor. The shedding vortex exhibits a frequency lock-in phenomenon with sound waves, and this frequency is a non-integer multiple of the rotor rotation frequency, which is a type of asynchronous vibration (Holzinger et al. Reference Holzinger, Wartzek, Schiffer, Leichtfuss and Nestle2016).
Thus far, several cases of compressor performance deterioration or structural failure attributed to acoustic resonance have been reported (Parker Reference Parker1968; Camp Reference Camp1999; Ziada, Oengören & Vogel Reference Ziada, Oengören and Vogel2002; Hellmich & Seume Reference Hellmich and Seume2008; Li et al. Reference Li, Zhang, Guo and Zhang2014; Holzinger et al. Reference Holzinger, Wartzek, Schiffer, Leichtfuss and Nestle2016; Zhao et al. Reference Zhao, Jing, Yang, Wang, Sha and Luan2020; Xu, Yang & Wang Reference Xu, Yang and Wang2023). Parker (Reference Parker1968) was the first to report the acoustic resonance phenomenon in a low-speed single-stage compressor. He found that blade fracture faults were caused by acoustic resonance in a high-speed multi-stage axial flow compressor. Camp (Reference Camp1999) discovered the acoustic resonance frequency locking phenomenon and rotational acoustic mode in a C106 low-speed high-pressure axial compressor. Hellmich & Seume (Reference Hellmich and Seume2008) found acoustic resonance near the stall boundary in a four-stage compressor. During the resonance, the compressor's internal noise reached 180 dB, resulting in the fracture of the first-stage stator blade's root. The cause of this was the coupling effect between the wake of the compressor blade or the shedding vortex at the tip and the inter-stage acoustic-mode state. Holzinger et al. (Reference Holzinger, Wartzek, Schiffer, Leichtfuss and Nestle2016) conducted measurements of rotor blade vibration induced by acoustic resonance in a 1.5-stage transonic compressor. They found that the source of acoustic resonance was the wake shedding vortices of adjustable stator blades. Xu et al. (Reference Xu, Yang and Wang2023) analysed the failure of the first-stage rotor blade of a high-pressure compressor in a certain type of aircraft engine in China and found that the cause of the failure was compressor acoustic resonance. Zhao et al. (Reference Zhao, Jing, Yang, Wang, Sha and Luan2020) discovered that the internal noise of a specific type of turbofan engine compressor propagates in a spiral shape. The signal spectrum displays a high peak pure tone component, which is directly related to the vibration of the high-pressure first-stage rotor blades.
In addition to axial compressors, centrifugal compressors are also susceptible to acoustic resonance issues. Ziada et al. (Reference Ziada, Oengören and Vogel2002) analysed acoustic resonance at the inlet of a multi-stage radial compressor, which caused significant mechanical vibration throughout the compressor. The vibration amplitude on the compressor casing exceeded the vibration limit value for this type of compressor. Their study suggests that acoustic resonance is caused by shedding vortices and can be controlled by modifying the shape of the trailing edge of the support plate. Li et al. (Reference Li, Zhang, Guo and Zhang2014) verified that acoustic resonance occurs when the blade passes through a frequency similar to the cavity acoustic-mode frequency, causing an exponential increase in pressure pulsation amplitude and resulting in strong destructive effects. Despite over half a century of research, the physical mechanism of acoustic resonance in compressor blades remains incompletely understood (Hong et al. Reference Hong, Zhao, Yang and Sun2019). Investigating the mechanisms involved remains an ongoing research topic.
Studying the flow field, sound field and blade vibration in detail and clarifying the mechanism of acoustic resonance induced by multiple-field interaction is difficult because of the complex blade structure and high-speed rotating parts in the rotor test. The mainstream research method for determining the acoustic resonance mechanism involves understanding the main mechanism characteristics and simplifying the compressor structure (Hong et al. Reference Hong, Zhao, Yang and Sun2019).
The methods for simplifying compressor structure are divided into two categories based on the different axial positions of the acoustic modes (Hong et al. Reference Hong, Zhao, Yang and Sun2019). The first category involves simplifying the compressor into a two-dimensional or three-dimensional cascade that contains a single-stage rotor/stator for the acoustic resonance between the rotor/stator stages (Parker Reference Parker1967b; Kodama & Namba Reference Kodama and Namba2015). The second category is for the acoustic resonance between the compressor blade channels. The acoustic mode's circumferential distribution is based on a single blade and two adjacent channels as the basic lobe period.
Therefore, multiple (Parker Reference Parker1966) or single two-dimensional flat blades are selected as research objects based on the principle of similar structures and the same physical mechanism. Currently, a single two-dimensional flat blade is used as the research object (Hong et al. Reference Hong, Zhao, Yang and Sun2019). The upper and lower flow channels formed by the wall surface of the flow tube and flat plate were used to simulate the blade channel so that the acoustic resonance between the blade channel can be simplified into the acoustic resonance in the flow duct. This study focuses on analysing the acoustic resonance mechanism and discusses the vortex–acoustic interaction process (Welsh, Stokes & Parker Reference Welsh, Stokes and Parker1984; Blevins Reference Blevins1985; Katasonov, Sung & Bardakhanov Reference Katasonov, Sung and Bardakhanov2015; Langthjem & Nakano Reference Langthjem and Nakano2016; Hong et al. Reference Hong, Wang, Jing and Sun2020). This study focuses on the second type of situation.
Based on the simplified research methods mentioned above, researchers mainly analyse the mechanism of acoustic resonance from the following perspectives: (i) the acoustic field characteristics generated by the flow field, (ii) the feedback effect of the sound field on the flow field and (iii) the coupling effect between the sound field and blade structure. The following provides an overview of each perspective.
(i) The acoustic field characteristics generated by the flow field.
Acoustic resonance noise has typical characteristics. The sound field characteristics generated by the flow field are of primary interest. Parker conducted the first experimental research on acoustic resonance induced by blade wake in a duct. He used microphones to measure the frequency lock-in of the shedding vortex and the significant peak sound pressure in the acoustic resonance state of flat blade cascades (Parker Reference Parker1966) and single-stage three-dimensional blade cascades (Parker Reference Parker1967a). He also discovered that there are several acoustic resonance modes (acoustic modes) in the duct, of which the most easily excited and largest amplitude mode is the β-mode (Parker Reference Parker1967b). Camp (Reference Camp1999) carried out experiments on a four-stage low-speed compressor test rig Cl06. The acoustic resonance phenomenon appeared when the installation angles of the intake guide vane (IGV) (the first-stage adjustable guide vane of the compressor) and the stator blades were reduced by 10° from the design value. The resonance frequency is a non-integer multiple of the rotational frequency. The resonance frequency exhibits a step change within the range of rotational speeds where it appears, known as the lock-in phenomenon. Scholars predict the frequency of acoustic resonance through eigenvalue problems in terms of theory and numerical analysis (Kaji & Okazaki Reference Kaji and Okazaki1970; Woodley & Peak Reference Woodley and Peake1999a,Reference Woodley and Peakeb; Koch Reference Koch2009).
Kameier & Neise (Reference Kameier and Neise1997) discovered that tip clearance flow is a key source of compressor noise in single-stage axial compressor experiments. Tip clearance noise is linked to the instability of the tip rotating flow field. Mailach, Lehmann & Vogeler (Reference Mailach, Lehmann and Vogeler2001) and März, Hah & Neise (Reference März, Hah and Neise2002) suggested that the instability of the tip flow (rotational instability) stimulates the cavity acoustic mode, which in turn excites blade vibration. Zhao et al. (Reference Zhao, Jing, Yang, Wang, Sha and Luan2020) conducted experiments and discovered that a certain type of turbofan engine compressor has an internal noise signal spectrum that exhibits a high peak pure tone component of 1402 Hz. This component is directly related to the vibration of the high-pressure first-stage rotor blades. The characteristic frequency noise signal inside the compressor is believed to originate from the rotational instability noise source inside the compressor, which propagates in a spiral shape similar to the acoustic resonance phenomenon observed by Hellmich & Seume (Reference Hellmich and Seume2008) on a four-stage high-pressure compressor.
(ii) The feedback effect of the sound field on the flow field.
The feedback effect of the sound field on the flow field is also important during acoustic resonance (Hong et al. Reference Hong, Zhao, Yang and Sun2019), and the frequency locking phenomenon of vortex shedding that occurs during acoustic resonance is a characteristic of the acoustic feedback effect.
To gain a deeper understanding of the flow mechanism generated by acoustic resonance, Welsh et al. (Reference Welsh, Stokes and Parker1984) used smoke flow visualisation technology to measure the internal flow field structure of the duct and calculate the frequency of vortex shedding. They found that under the acoustic resonance state, orderly Kármán vortex streets appeared in the wake of the blade, and the frequency of vortex shedding also exhibited a lock-in phenomenon. The experimental results of Blevins (Reference Blevins1985) suggest that the velocity of sound particles caused by sound waves is the carrier of acoustic feedback. Langthjem & Nakano (Reference Langthjem and Nakano2016) discovered that even a small amplitude of sound particle velocity in acoustic feedback, typically only 1 % of the incoming flow velocity, can significantly impact the intensity and frequency of vortex shedding.
Thomassin, Vo & Mureithi (Reference Thomassin, Vo and Mureithi2011) noted that the asynchronous vibration of rotor blades is caused by the propagation and feedback of the vortex layer at the blade tip in the same-stage blade cavity. This generates strong acoustic feedback between the blades, resulting in increased acoustic energy. Katasonov et al. (Reference Katasonov, Sung and Bardakhanov2015) discovered that there are high-order harmonic components of acoustic frequency in the flow field under acoustic feedback, indicating that the vortex–acoustic interaction is nonlinear. Hong et al. (Reference Hong, Wang, Jing and Sun2020) discovered that the cylindrical wake vortex mode and the duct acoustic mode together form a nonlinear synchronous system. The frequency lock-in phenomenon is a result of the competition between the vortex mode and the acoustic mode, revealing the coupling mechanism between the flow field and the acoustic field during acoustic resonance.
(iii) The interaction between the sound field and blade structure.
During acoustic resonance, there is also an important coupling relationship between the structural mode and acoustic mode of compressor blades. Yang et al. (Reference Yang, Liu, Wang, Wu, Li and Liu2012) measured the noise and blade vibration characteristics using microphones and strain gauges, and analysed the fault of the first-stage rotor blade fracture of a high-pressure compressor in a certain aircraft engine. It was found that the fault mechanism was very similar to the compressor acoustic resonance phenomenon. By using pulsating pressure sensors and strain gauges to obtain the mode propagation characteristics of internal flow and structural vibration of the compressor during acoustic resonance, they found that there is circumferential coupling between the theoretically predicted acoustic mode and the blade structural mode (Xu et al. Reference Xu, Yang and Wang2023).
Furthermore, scholars have examined the acoustic resonance mechanism by analysing the blade's response to noise. Lin, Li & Yang (Reference Lin, Li and Yang2010) conducted experiments on the vibration response of rotor blades under pure acoustic excitation and mechanical excitation combined with acoustic excitation using a horn as the sound source. It was discovered that the high-strength sound waves within the high sound intensity noise inside the compressor can trigger rotor blade resonance if their frequency matches a certain natural frequency of the blade or its harmonics and division. In a further study by Wang & Guo (Reference Wang and Guo2016), the acoustic fatigue test of the blades was conducted under random noise excitation with a bandwidth of 30 Hz and a total sound pressure level of 167 dB, using a horn as the acoustic resonance source. Following a period of acoustic fatigue testing, a crack measuring 23 mm in length was found at the root of the blade.
In summary, acoustic excitation occurs only under specific working conditions, making it difficult to study its mechanism. The compressor's acoustic resonance phenomenon has a complex physical mechanism, involving the interaction of fluid–acoustic–structure multi-fields, which further complicates research. The existing research focuses on the sound field characteristics of acoustic resonance, the interaction between flow and sound and the interaction between the blade structure and sound field.
The highly complex multi-field interaction relationship between fluid, acoustics and structure, provides significant challenges in both theoretical analysis and numerical simulation (Hong et al. Reference Hong, Zhao, Yang and Sun2019). As a result, this paper primarily employs experimental methods to conduct relevant research. Therefore, this study analyses the physical nature of the acoustic resonance, wherein the vortex shedding mode, acoustic mode in the flow duct and blade vibration mode are consistent. A plane cascade experimental model is established to reproduce the acoustic resonance phenomenon. Further, the parameters of vortex shedding, sound pressure level and blade vibration stress are measured synchronously, and the interaction law of the multifield characteristic modes under acoustic resonance is analysed to deepen the understanding of the acoustic resonance mechanism.
The structure of this article is as follows. Section 2 describes the experimental set-up in detail. The amplitude and frequency of the multi-field parameters are analysed while mean flow velocity increases, and the multi-field interaction mechanism inducing the acoustic resonance of the plane cascade is explored in § 3. Section 4 provides concluding remarks.
2. Experimental set-up
The acoustic resonance experimental set-up of the compressor plane cascade comprises a low-speed wind tunnel, plane cascade test section and multifield parameter (noise, strain and vortex shedding) measurement system (figure 1). The outlet diameter of the contraction section of the low-speed wind tunnel was 200 mm × 200 mm, with a contraction ratio of 20.25, turbulence and velocity non-uniformity of less than 0.5 % and a maximum mean flow velocity of up to 35 m s−1. A noise reduction section was added between the fan and the stable section to eliminate the influence of the fan's discrete noise on the acoustic excitation test of the blade. The background noise of the low-speed wind tunnel was eliminated to satisfy the noise testing requirements (Ministry of Ecology and Environment of the People's Republic of China 2014); the results of the background noise measurements are presented in § 2.3. The planar cascade test section contains five parallel blades. Vibration stress, noise and vortex shedding were measured using strain gauges, a microphone and a high-frequency hot-wire, respectively, and the dynamic signals were collected and processed using a multichannel data acquisition system.

Figure 1. Schematic of the experimental set-up.
2.1. Compressor plane cascade test section
The compressor plane cascade is simplified and designed based on the principle of similar structures and physical mechanisms (Hong et al. Reference Hong, Zhao, Yang and Sun2019) by simulating the rotor blade channel (figure 2). To enhance the high fidelity of the cascade wind tunnel experiment, five blades were installed inside the cascade to simulate flow in the rotor channel. Compared with the use of a single blade and duct wall to form a flow channel to simulate the blade channel, the use of multiple curved blades can better replicate the flow between the blade channels, making it more similar to the actual operating conditions of the compressor blade. The roots of the blades were bolted to the base plate and rotated to adjust the angle of the stagger. The blades adopt a non-torsional arc, the blade profile is a circular arc and the blade material is stainless steel to reproduce the acoustic resonance phenomenon in the low-speed incoming flow. The specific parameters are listed in table 1. To ensure that the blade can be excited, the blade design underwent numerous simulation calculations using Ansys software to determine its natural mode frequency. The selected blade for the experiment had a thickness of 1 mm and a height of 195 mm. Its second-order mode was measured in situ while fixed, and the acoustic resonance-mode frequency was found to be 156.3 Hz. This value is consistent with the numerical simulation results obtained from Ansys software (156.6 Hz) (Liu et al. Reference Liu, Chen, Lin and Lin2023).

Figure 2. (a) Three-dimensional structural diagram of the compressor plane cascade test section and (b) cascade nomenclature.
Table 1. Plane cascade parameters.

Unlike a conventional compressor plane cascade, a plane cascade that reproduces acoustic resonance phenomena requires the acoustic-mode frequency of the flow duct to be consistent with the natural and vortex shedding frequencies of the blade. The compressor cascade flow channel can be considered a flow duct. When the noise acoustic wave of the cascade forms a standing wave inside the flow duct, it stimulates the plane cascade to generate an acoustic resonance. According to the previous research results of our team (Liu et al. Reference Liu, Chen, Lin and Lin2023) and the natural mode frequency of blade, the blade tip clearance vortex and trailing-edge vortex shedding frequency are locked in the second-order natural mode frequency of blades (156.3 Hz). Therefore, the fluid–structure locking frequency of 156.3 Hz is the first-order acoustic-mode frequency of the cascade flow duct that reproduces acoustic resonance while keeping the length of the cascade flow duct as short as possible. The following uses the classical theory of flow duct acoustic modes to calculate the length of the cascade flow duct.
The nth (n = 1, 2, 3, …)-order acoustic-mode frequency fn of the flow duct has the following relationship with the sound velocity cs (taken as 344 m s−1) and flow duct length l when sound waves propagate in a flow duct with open ends (Howard & Angus Reference Howard and Angus2017):
 \begin{equation}{f_n} = \frac{{n{c_s}}}{{2l}}.\end{equation}
Thus, the length l of the cascade flow duct can be calculated as 1095 mm using (2.1), making the first-order acoustic-mode frequency of the compressor cascade flow duct 156.3 Hz.
To verify the effectiveness of the theoretical design, we used the Acoustic Harmonic FEM module of LMS Virtual.lab 13.6 to simulate the acoustic mode of the cascade model, including the blade. The simulation results indicate that the first-order acoustic-mode frequency along the flow direction is 154.8 Hz, which is consistent with the theoretical calculation results (156.3 Hz) within only a 1 % error. Figure 3 shows the sound pressure distribution.

Figure 3. Sound pressure of the first-order acoustic mode in the cascade duct along the flow direction.
The experiment focused on the essence of acoustic excitation by designing the acoustic mode of the cascade duct based on the mode frequency of fluid and blade structure. By adjusting the length of the cascade duct, the first-order acoustic-mode frequency along the flow direction of the duct is made consistent with the second-order natural mode frequency and the flow mode frequency of the blade. This ensures the repeatability of the acoustic excitation phenomenon and provides a reliable guarantee for the measurement of relevant parameters.
The Strouhal number St of blade trailing-edge vortex shedding, based on blade chord length (b = 0.04 m), ranged from 0.19 to 0.23. This range is similar to the St values (approximately 0.2) reported in previous studies (Parker Reference Parker1966, Reference Parker1967a, Reference Parker1968; Camp Reference Camp1999; Ziada et al. Reference Ziada, Oengören and Vogel2002; Mohany & Ziada Reference Mohany and Ziada2011; Katasonov et al. Reference Katasonov, Sung and Bardakhanov2015; Arafa & Mohany Reference Arafa and Mohany2019; Hong et al. Reference Hong, Wang, Jing and Sun2020). The experiment was conducted with an average flow velocity range of 15 to 35 m s−1. The Reynolds number Re, based on the blade chord length, ranged from 4.0 × 10⁴ to 9.3 × 10⁴. The air density is 1.205 kg m−3, and the dynamic viscosity coefficient is 1.81 × 10⁻⁵ Pa⋅s. These values correspond to the low Reynolds number operating conditions of compressors in engineering practice (less than 1.0 × 10⁵), which is consistent with the Reynolds number range found in the literature (Parker Reference Parker1968; Mailach et al. Reference Mailach, Lehmann and Vogeler2001; Mohany & Ziada Reference Mohany and Ziada2011; Arafa & Mohany Reference Arafa and Mohany2019; Hong et al. Reference Hong, Wang, Jing and Sun2020).
2.2. Measurement system
A set of strain, noise and flow synchronous test systems was established to explore the characteristics of blade vibration, cascade noise and vortex shedding. The blade vibration mode was measured using a strain gauge (CF350-2EB(11)P03M) with a response frequency of ≥20 kHz from Xiamen Loadcell Technology Co, Ltd. The strain gauge has an accuracy level of 0.02, meaning that the measurement error is 0.02 %. Additionally, the measurement error of the entire system is less than 1 %. A strain gauge was attached to the large deformation of the blade to measure its strain. A microphone (BSWA-MPA416, China BSWA Technology Co, Ltd.) was used to measure the cascade noise. The dynamic measurement range, frequency range and open-circuit sensitivity of the microphone were 29–127 dB, 40 Hz to 20 kHz and 50 mV Pa−1, respectively. The microphone meets the first-level accuracy requirements of the IEC61672 standard, with a measurement error of ±0.7 dB within the frequency range of less than 1 kHz in this experiment. The microphone extended from the top plate and was flat on the inner wall surface. The vortex shedding frequencies of the blades were measured using a CTA-04-Edu hot-wire anemometer (China Dalian Hanghua Technology Co, Ltd.). The sampling frequency was up to 50 kHz. The hot-wire probe was a HW1 single-wire probe with a diameter of 5 μm gold-plated tungsten wire. Based on the speed calibration, data acquisition, temperature, humidity and other relevant factors, the error in the measurement of hot-wire speed is approximately 3 % (Jørgensen Reference Jørgensen2002). A hot-wire probe was placed at the trailing edge of the blade and tip clearance for measuring the trailing-edge vortex shedding frequency of the blade and tip clearance leakage vortex pulsation frequency. The fluid–acoustic–structure parameters were collected synchronously and processed using a multi-channel data acquisition system (DH5922D, China Jiangsu Donghua Test Technology Co, Ltd.). The system has 12 synchronous acquisition channels with a maximum sampling rate of 256 kHz channel−1.
During the experiment, the microphone, hot-wire and strain gauge occupied a single channel. The sampling frequency was set to 10 kHz, and the window type was rectangular. The recording time was set to 1 min, measurement frequency range was 0–7812.5 Hz and frequency resolution was 19.531 Hz. The Dong-Hua test real-time data measurement and analysis software system DHDAS (V1.12) of DH5922D performs time-domain, frequency-domain and frequency-response analyses. This system can simultaneously measure the signals of the strain gauges, microphone and hot-wire, and it can record and display the time-domain and frequency-domain signals of the noise, strain and flow in real time. The frequency-domain signal in a given period was recorded and averaged to obtain the average spectrum using the average-spectrum calculation function of the software. The subsequent experimental results were analysed using the frequency-domain average-spectrum waveform.
The vibration characteristics of the blades remained stable under each operating condition, rather than exhibiting instantaneous behaviour. However, under acoustic resonance conditions, the vibration of the blades may cause severe deformation or even cracks, which made it difficult to continue the experiment. Therefore, it is difficult to have a long measurement time under the acoustic resonance condition. To ensure that the experiment could proceed smoothly, after repeated experiments, a frequency resolution of 19.531 Hz was selected, and the recording time was controlled at 1 min.
Some subsequent results were dimensionless. The reduced flow velocity Ur = U/fab, where U, fa and b represent the flow velocity, design resonance frequency (156.3 Hz) and blade chord length, respectively. The reduced frequency fr = f/fa. The reduced flow speed pulsation amplitude  ${U^{\prime}_r} = \textrm{ }U^{\prime}/{f_a}b$, where U′ represents the mean flow velocity pulsation amplitude measured using a high-frequency hot-wire.
2.3. Validation of noise measurement results
To assess the validity of the blade noise measurement results, a comparative analysis was performed between the duct background noise and the blade noise without considering the blades (figure 4). Figure 4(a) shows that the sound pressure level of the background noise increases gradually with increasing flow velocity. At Ur = 3.20 or more, a slight camelback phenomenon was observed in the noise frequency and the peak frequency gradually increased with increasing mean flow velocity. According to a previous study (Lin Reference Lin2021), the camelback frequency component is formed by the pressure pulsation generated by the blade-compressed air of the blower fan of the wind tunnel. The camelback frequency component can be excluded from the subsequent analysis of the measurement results because it has a specific frequency and can be derived from the theoretical noise frequency.

Figure 4. (a) Sound pressure of the plane cascade for Ur from 2.40 to 5.60, and sound pressure of the plane cascade and wind tunnel background for Ur of (b) 2.40, (c) 4.80 and (d) 5.60, respectively.
The sound pressure level (SPL) of the plane cascade aerodynamic noise was significantly higher than that of the wind tunnel background noise (figure 4). The average sound pressure level of the noise was 17.8 dB (Ur = 2.40), 10.3 dB (Ur = 5.60) higher than that of the wind tunnel background noise. The maximum noise state Ur = 4.80 in the plane cascade test results was 13.4 dB higher than the average sound pressure level of the background noise, which was considerably larger than 3 dB, thereby indicating that the test results are effective (Ministry of Ecology and Environment of the People's Republic of China 2014). In the subsequent measurement results, the SPL of the planar cascade at a specific frequency was usually considerably higher than the corresponding frequency background noise. The corresponding noise SPL of 156.3 Hz was 25.6 dB higher than the background noise when Ur = 4.80. Therefore, it is credible to measure the aerodynamic noise data of a plane cascade under the background noise of this wind tunnel.
3. Results and discussions
3.1. Acoustic resonance capture of the compressor plane cascade
The working conditions of the acoustic resonance phenomenon of the plane cascade should first be determined to study the acoustic resonance phenomenon. Parker (Reference Parker1968) and Camp (Reference Camp1999) conducted repeated experiments by constantly changing the incoming flow velocity and the blade stagger angle, and they found the phenomenon of acoustic resonance, which indicates that the incoming flow velocity Ur and blade stagger angle γ are important parameters for the occurrence of acoustic resonance. Based on previous research experience, the range of Ur was set as 0.80–5.60 and γ was set as 60–80°. The mean flow velocity and installation angle were changed sequentially. During this period, the vibration of the blade was observed, and the noise of the cascade was monitored to determine the acoustic resonance of the blade. During the test, the blade vibration was the most severe and accompanied by obvious howling under the conditions of γ = 70°and Ur = 4.8. The blade vibration and noise were weakened by continuously changing the installation angle or the flow velocity. Therefore, it can be preliminarily determined that γ = 70°and Ur = 4.8 were the conditions that made the acoustic resonance of the plane cascade more intense. Fatigue cracks appeared at the root of the blade in the middle of the five blades after working under these conditions for a period (figure 5).

Figure 5. Cracks caused by blade vibrations.
3.2. Measurement and analysis of fluid–acoustic–structure multi-field parameters of compressor cascades
According to the acoustic resonance condition captured above, Ur increased gradually from 2.40 to 5.60 for γ = 70°, and the variations of blade vibration stress, vortex shedding and noise parameters at different incoming flow velocities were measured synchronously to clarify the mechanism of the acoustic resonance of the compressor plane cascade. The flow periodicity of the test blades was weakened because the wall of the cascade affected the flow field through nearby blades. Therefore, the blade located at the centre was selected as the multifield parameter measurement blade for ensuring the flow periodicity of the test blade.
3.2.1. Blade vibration characteristics
A fluid–acoustic–structure multi-field interaction mechanism exists when a compressor undergoes acoustic resonance (Camp Reference Camp1999). Understanding the blades’ natural modes is crucial to establishing a foundation for subsequent analyses of blade vibrations to clarify the acoustic resonance mechanism. Initially, the natural frequencies of the blades were obtained experimentally, as listed in table 2 (Liu et al. Reference Liu, Chen, Lin and Lin2023). The specific position of the strain gauge is determined based on the torsional deformation characteristics of the third-order inherent blade mode, as shown in figure 6(a) (Liu et al. Reference Liu, Chen, Lin and Lin2023). The strain gauge is used to measure the torsional vibration stress frequency spectra of the blades at different mean flow velocities, as shown in figure 6(b).
Table 2. First- to fourth-order blade mode frequencies (Liu et al. Reference Liu, Chen, Lin and Lin2023).


Figure 6. (a) Schematic of the strain gauge attachment location and (b) blade vibration stress spectra at different mean flow velocities.
The main vibration mode of the blades shifted from the second-order torsional vibration to the third-order bending-torsion vibration with a gradual increase in the mean flow velocity (figure 6b). The vibration stress on the blades peaked at 4.214 MPa at a mean flow velocity Ur = 4.80, which corresponds to a second-order mode vibration (fr = 1). This aligns with the captured acoustic resonance condition, and the cracks shown in figure 5 match the fatigue cracks from torsional vibrations. In addition, the third-order mode began to appear after the mean flow velocity Ur reached 3.2, although its intensity was notably weaker than that of the second-order mode vibration until it reached a mean flow velocity of 5.6, at which point the third-order mode became the primary vibration mode. These observations resemble the lock-in phenomenon in the fluid–structure interaction (Zhang et al. Reference Zhang, Li, Ye and Jiang2015) and demonstrate a competition mechanism between the two vibration modes.
3.2.2. Flow field characteristics of the planar cascade
The measurement positions for the frequency of the blade tip leakage vortex pulsation and blade trailing-edge vortex shedding are measurement points I and II, respectively (figure 7). The measurement position of the tip clearance leakage vortex was determined based on the previous measurement results of the tip clearance vortex flow field structure (Liu et al. Reference Liu, Chen, Lin and Lin2023), with 0.5δ from the wall and 0.25s near the tip clearance. The measurement position of the trailing-edge vortex of the blade was determined based on previous numerical simulation results, and it was placed ∼0.5b away from the trailing edge of the blade, wherein the vortex oscillates strongly. The hot-wire should be 0.3h away from the blade tip and located at the same cross-section as the blade in the direction of the vertical flow to avoid the influence of the leakage vortex in the blade tip gap.

Figure 7. Schematic of the hot-wire measurement position for vortex shedding frequency, (a) parallel to flow direction, (b) vertical to flow direction.
The reduced frequency of the blade trailing-edge vortex shedding fr gradually increased with increasing mean flow velocity, and a frequency lock-in phenomenon in Ur was observed between 4.32 and 5.60 (figure 8). When Ur was higher than 4.32, the blade trailing-edge vortex shedding frequency entered the frequency lock-in region, gradually transitioning from fr = 1.00, single-frequency point frequency locking to fr = 1.00, fr = 1.12, dual-frequency point lock-in and finally completely converting to fr = 1.12, which is the single-frequency point frequency lock-in region.

Figure 8. Frequency spectrum of vortex shedding at the trailing edge under different mean flow velocities.
There was a more prominent discrete peak in the tip clearance vortex velocity pulsation spectrum similar to the blade trailing-edge vortex shedding frequency spectrum (figure 9). The reduced frequency fr of the blade trailing-edge vortex shedding increased gradually with each increase in the incoming flow velocity, and a frequency lock-in phenomenon was observed. The frequency-locked region was located at Ur = 4.32 to 5.12, where fr = 1. The blade tip clearance leakage vortex pulsation characteristics exited the frequency lock-in region when Ur increased to 5.16. As shown in figure 9, the pulsation amplitude reaches its highest value when Ur = 5.12.

Figure 9. Frequency spectrum of the tip clearance leakage vortex pulsation under different mean flow velocities.
Compared with the vortex shedding pulsation at the trailing edge of the blade, the frequency lock-in region of the velocity pulsation of the tip clearance leakage vortex exhibited a single-frequency characteristic, which was consistent with the resonance-mode frequency (fr = 1) of the plane cascade design. The pulsation amplitude at the tip clearance was significantly a maximum of 1.6 times higher than that of the blade trailing-edge shedding vortex. This indicates that the pulsation energy of the tip leakage vortex was significantly higher than that of the blade trailing-edge vortex, which was likely to occupy a dominant position in inducing blade vibration and noise and was the characteristic flow that needed to be focused on in the subsequent acoustic resonance control.
3.2.3. Acoustic characteristics of the plane cascade
The background noise of the empty flow duct of the compressor plane cascade without blades was measured at different mean flow velocities and compared with that of the plane cascade to verify the effectiveness of the acoustic measurement results in the experiment. The measurement position of the microphone is near the trailing edge of the central blade of the plane cascade (Lin Reference Lin2021), as shown in figure 10.

Figure 10. Schematic of the microphone measurement position.
Subsequently, the cascade is installed at a stagger angle of γ = 70°, the reduced mean flow velocity Ur increases from 2.4 to 5.6 and the compressor plane cascade noise is measured (figure 11). When Ur was less than 4.8, the overall SPL of the noise increased with each increase in Ur. When Ur = 4.8, the discrete peak of frequency fr = 1 in the noise spectrum reached a maximum value of 124.4 dB. Further, discrete peaks of frequency fr = 2 (double the frequency of the first-order mode) and fr = 3.125 (third-order mode frequency of the blade vibration) were observed. Although there was a discrete peak at frequency fr = 1 in the noise spectrum when Ur continued to increase to 5.6, it was lower than that at Ur = 4.8. This implies that the noise does not always increase with an increase in mean flow velocity; a peak is observed.

Figure 11. Frequency spectrum of sound pressure for Ur from 2.40 to 5.60.
3.3. Discussion on the mechanism of acoustic resonance in a compressor plane cascade
Analysing the variation law of the amplitude and characteristic frequency of the multi-field parameters of the plane cascade with increasing mean flow velocity is necessary to obtain the fluid–acoustic–structure multi-field parameters of the plane cascade. First, the analysis results determine whether an acoustic resonance phenomenon exists. The interaction mechanism of the fluid–acoustic–structure multi-field parameters is explored.
3.3.1. Amplitude variation characteristics of the fluid–acoustic–structure parameters
According to the aforementioned fluid–acoustic–structure multifield parameter measurement results, when fr = 1, the blade vibration stress, sound pressure level (figure 12a) and fluctuation amplitudes of the blade trailing-edge vortex and tip clearance vortex (figure 12b) at different mean flow velocities are extracted for analysis. The amplitudes of the above physical parameters first increased and then decreased with increasing mean flow velocity Ur. With the exception of the amplitude of the tip leakage vortex pulsation at Ur = 5.12, the other parameters reached a maximum at Ur = 4.8. The amplitude variation trend was consistent with the noise amplitude variation characteristics of acoustic resonance phenomenon found by Camp (Reference Camp1999), Hong et al. (Reference Hong, Wang, Jing and Sun2020), Mohany & Ziada (Reference Mohany and Ziada2011) and Arafa & Mohany (Reference Arafa and Mohany2019), that is, the amplitude of the fluid–acoustic–structure multi-field parameters increased first and then decreased with increasing incoming flow velocity. This implies that acoustic resonance may occur inside the compressor plane cascade and gradually withdraw from the acoustic resonance state with a gradual increase in the mean flow velocity.

Figure 12. (a) Sound pressure and vibration stress amplitude at fr = 1 and (b) vortex shedding amplitude at fr = 1 at different mean flow velocities.
The pulsation amplitude of the tip leakage vortex is significantly higher than that of the trailing-edge vortex when the blade is in a possible acoustic resonance state (figure 12b). The former is 1.8 times higher than the latter when Ur = 5.12, which implies that the pulsation of the tip clearance leakage vortex was the dominant flow factor inducing the acoustic resonance state of the blade. This should be considered in the subsequent acoustic resonance control.
3.3.2. Underlying the frequency lock-in mechanism of the fluid–acoustic–structure resonance
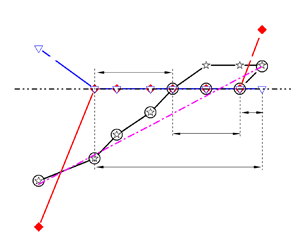
Frequency lock-in is a crucial characteristic and a standard for acoustic resonance. We extracted data on the vortex shedding frequency of the blade trailing edge and tip clearance leakage vortex, peak frequency of the blade cascade noise and peak frequency of the blade vibration stress (figure 13) under different mean flow velocities to further determine whether acoustic resonance occurs and explore its multi-field interaction mechanisms. This was aimed at analysing the frequency lock-in phenomenon and mechanism with increasing mean flow velocity.

Figure 13. Mode frequencies of fluid–acoustic–structure parameters at different mean flow velocities; TLV: tip leakage vortex, TEV: trailing-edge vortex.
The compressor cascade operated in the (i) lock-in region and the frequency was locked at fa = 1 for 3.20 ≤ Ur ≤ 5.60 when Ur increased from 2.40 to 5.60. This region can be divided into three sub-regions based on the increase of Ur: (ii) acoustic–structure interaction region (3.20 ≤ Ur ≤ 4.32), (iii) fluid–acoustic–structure interaction region (4.32 ≤ Ur ≤ 5.12) and (iv) first-order acoustic-mode dominant region (5.12 ≤ Ur ≤ 5.60).
(i) Lock-in region (3.20 ≤ Ur ≤ 5.60): within this region, at least one of the mode frequencies of the flow, noise and blade vibration stress is locked at the resonance frequency fa = 1. The first-order mode frequency of noise remained constant throughout the region, which suggests the effective excitation of the first acoustic mode of the plane cascade flow duct. The first-order mode frequency of noise is strongly coupled with the blade vibration and flow modes, whereas the vibration stresses of the blades increased gradually (figure 12a).
(ii) Acoustic–structure interaction region (3.20 ≤ Ur ≤ 4.32): the plane cascade first entered the acoustic–structure interaction region with an increase in the mean flow velocity Ur to 3.20, where the first-order acoustic-mode frequency of the flow duct equalled the second-order vibration mode frequency of the blade, and both locked in the resonance frequency fa = 1. Meanwhile, the shedding frequency of the blade trailing vortex and tip leakage vortex deviated gradually from the free-shedding frequency of the blade trailing-edge vortex fs (Strouhal number St = 0.21, based on blade chord  $b$) and progressively approached the resonance-mode frequency. Therefore, this region can be identified as the vortex-mode transition region.
It should be noted that although the peak frequency in the fluid pulsation spectrum (as shown in figures 8 and 9) in this region does not align with the resonance frequency, the flow still serves as the excitation source for acoustic–structure coupling. Upon further analysis of the spectra for blade trailing edge and tip clearance vortex pulsation shown in figures 8 and 9, we discovered a hump region near fr = 1 when the mean flow velocity is low. The amplitude of the pulsation in the blade trailing-edge vortex is similar to that of the pulsation in the tip clearance vortex. Overall, the amplitude of the blade trailing-edge vortex pulsation is slightly higher. This is particularly noticeable at Ur = 3.20, where there is a discrete peak at fr = 1 with an amplitude of 0.30. This is 2.5 times the amplitude of the tip clearance vortex pulsation (0.11).
It is evident that, at low flow velocities, the sources of noise are the blade trailing-edge vortex and blade tip gap vortex. The impact of blade trailing-edge vortex noise is relatively large. The first-order acoustic-mode frequency of the flow direction of the cascade duct is excited by the combined action of two types of aerodynamic noise, resulting in a discrete peak value of fr = 1 in the sound pressure spectrum. The sound pressure level is significantly higher than the average level. At Ur = 4.00, the discrete peak sound pressure level reached 121.2 dB, which is close to the noise sound pressure level under acoustic resonance conditions. This frequency is consistent with the second-order natural mode frequency of the blade, indicating an interaction between the blade structural modes and stimulating the blade to produce obvious second-order natural mode vibration. In this experiment, a blade with a thickness of 1 mm and a chord length of 40 mm was used, and the blade height was 195 mm, making it relatively easy to excite the blade vibration mode with relatively small stiffness.
Based on the analysis above, it can be concluded that, at low flow velocity, although flow is the inducing source, flow mode undergoes sudden changes only with difficulty. The characteristic mode gradually approaches the design resonance mode, and the flow hump noise stimulates the first-order acoustic mode of the pipeline flow direction to play a dominant role.
(iii) Fluid–acoustic–structure interaction region (4.32 ≤ Ur ≤ 5.12): when the mean flow velocity exceeded 4.32, it entered the fluid–acoustic–structure interaction region, where the frequencies of the blade main vibration mode, tip leakage vortex mode and first-order acoustic mode converge and lock in the resonance frequency fa = 1. The amplitudes of the blade flow pulsation, blade vibration stress and blade grating noise increase significantly (figure 12b), with a peak at Ur = 4.80 (amplitude of the tip vortex pulsation was maximised at Ur = 5.12). The blade tailing-edge vortex-mode frequency was locked in fa = 1 only at Ur = 4.32, and then, at fr = 1.12. The findings indicated that the tip leakage vortex mode was dominant when the acoustic resonance phenomenon occurred, which coincided with the variation rule of the pulsation amplitude shown in figure 12(b). The range of Ur at which acoustic resonance occurred in this study aligned with the range reported in the literature for acoustic resonance in cylindrical wake flows (Mohany & Ziada Reference Mohany and Ziada2011; Arafa & Mohany Reference Arafa and Mohany2019; Hong et al. Reference Hong, Wang, Jing and Sun2020).
As the average flow velocity Ur increased to 4.32, the flow mode became consistent with the duct acoustic mode and the blade structural mode. This results in a strong interaction between the three physical fields and a positive feedback effect between them. The vibration stress of the blades gradually reaches its peak, while the noise sound pressure and flow pulsation amplitude show a sharp increase. Based on the Ur = 4.00 state, which is the boundary point between the acoustic–structure interaction and the fluid–acoustic–structure interaction, the amplitude increases of fluid, acoustic and structural vibration were compared horizontally (figure 12). The amplitude of the blade tip clearance vortex fluctuation increased by 227.3 %, while the amplitude of the blade trailing-edge vortex fluctuation increased by 86.4 %. Additionally, the vibration amplitude increased by 211.8 %, and the sound pressure level of the blade cascade increased by 3.2 dB (with the sound pressure amplitude increasing by 44.5 %).
The analysis shows that the flow mode, particularly tip clearance flow, plays a dominant role in this stage, with the largest increase in amplitude. As the flow mode shifts to the resonance-mode frequency, it generates strong feedback between the blade structural mode and the acoustic mode. This intensifies the vibration stress of the blade and leads to blade failure, as depicted in figure 5. In the subsequent acoustic resonance control, it is crucial to control the flow, particularly blade tip clearance vortex.
(iv) First-order acoustic-mode dominant region (5.12 ≤ Ur ≤ 5.60): when the mean flow velocity exceeded 5.12, the wind transitioned from the acoustic resonance region to the dominant first-order acoustic-mode region. In this region, the frequencies of the blade trailing-edge vortex, tip leakage vortex and blade vibration modes were all outside the frequency lock-in region. Meanwhile, only the frequency of the first-order acoustic mode was still locked at fr = 1, and the frequency of the tip leakage vortex mode also increased to fr = 1.12, which was the same as the blade trailing-edge vortex mode. The blade vibration mode is converted from the second-order mode to the third-order mode; however, the vibration amplitude of the second-order mode is still maintained at a high level (figure 6).
As the mean flow velocity Ur increased to 5.6, the flow mode frequency exited the resonance frequency and returned to the natural shedding frequency of the blade wake vortex (fr = 1.12). The tip clearance vortex is also locked at this frequency. Although the pulsation amplitude is attenuated, the amplitudes of the blade wake vortex and tip clearance vortex are reduced by only approximately 8.3 % and 15.9 %, respectively. However, the amplitude of vibration stress is reduced by 51.1 %, and the sound pressure level is reduced by 6.1 dB (the amplitude of sound pressure is reduced by 101.8 %). Only the acoustic-mode frequency remains in the design resonance mode (fr = 1). As the mean flow velocity increases, the frequency of vortex shedding pulsation at the blade's trailing edge also increases gradually. If the frequency is significantly different from the design resonance frequency, it becomes challenging to establish a strong interaction between flow and noise, making it difficult to generate positive feedback and enhance each other. Therefore, while the amplitude of fluid pulsation may not decrease significantly, the sound pressure of noise will be greatly reduced. When the frequencies of fluid–acoustic–structure are inconsistent, inducing severe vibration of the blade becomes difficult, and ultimately the vibration amplitude of the blade decreases significantly. It shows that the main reason for the cascade to exit the fluid–acoustic–structure resonance region is that the flow mode frequency cannot continue to maintain the design acoustic resonance-mode frequency, which greatly weakens the multi-field interaction effect and significantly reduces the noise sound pressure, and the vibration stress also drops sharply.
The two modes operate in a manner akin to the vortex-mode–acoustic-mode competition mechanism identified by Hong et al. (Reference Hong, Wang, Jing and Sun2020) in the vortex–acoustic resonance mode of the cylindrical wake when the blade vibration modes are excluded and only the roles of the acoustic and flow modes are considered. In other words, the wind moved from the dominant region of the first-order acoustic mode to the acoustic resonance zone and back to the dominant region of the first-order acoustic mode as mean flow velocity increased. This also verifies the effectiveness of the experimental set-up used in this study, which can successfully reproduce the vortex acoustic resonance mode during blade acoustic resonance.
When the blade vibration mode is considered in this experiment, it shows an interesting competition phenomenon of fluid–acoustic–structure modes: acoustic mode > blade vibration mode > flow mode. The first acoustic–structure interaction resonance effect was manifested by the first-order acoustic mode of the flow duct and the blade vibration mode with the same frequency with increasing mean flow velocity. Currently, the role of the flow mode is relatively weak and it gradually converges to the resonance-mode frequency because of the acoustic–structure interaction effect. The acoustic resonance intensity reaches its maximum once the frequency of the flow mode is equal to the resonance mode of the fluid–acoustic–structure interaction. The main vibration mode and flow mode frequency gradually exited the acoustic resonance region with increasing mean flow velocity, whereas the acoustic-mode frequency remained at the resonance frequency.
The acoustic modes of compressor flow duct play a substantial role in the fluid–acoustic–structure interaction effects. In the lock-in region, the acoustic-mode frequency is always locked at fa within the lock-in region (3.20 ≤ Ur ≤ 5.60), followed by the structural mode lock-in region (3.20 ≤ Ur ≤ 5.12) and the fluid mode lock-in region, which is the smallest (4.32 ≤ Ur ≤ 5.12). The acoustic mode has the largest influence range in terms of the velocity range covered by the mode, making its role more prominent. Acoustic resonance occurs when fluid, acoustics and blade structure interact. The superposition of sound fields induces the interaction between flow and noise, and between structure and noise. This indirectly enhances the interaction between flow and structure. The superposition of these three coupling effects forms positive feedback, greatly intensifying the structural vibration response and ultimately causing structural damage. The acoustic-mode frequency is a key compressor design parameter. Once the acoustic-mode frequency is coupled with the mode frequency of the blade vibration and flow, it is very likely to induce the strong fluid–acoustic–structure resonance phenomenon of the blade, which results in blade failure.
3.3.3 Discussion of fluid and acoustic measurement results under fluid–acoustic interaction
(i) Fluid pulsation measurement results: the data of fluid pulsation characteristics measured by hot-wire are mainly the characteristics of fluid, and the velocity of acoustic particles is relatively weak. According to the calculation formula of acoustic particle velocity amplitude va (Kinsler et al. Reference Kinsler, Frey, Coppens and Sanders2000)
 \begin{equation}{v_a} = \frac{{{p_0}}}{{{\rho _0}{c_0}}},\end{equation}
where p 0 is the effective value of sound pressure, ρ 0 is the air density (1.205 kg m−3) and c 0 is the sound velocity (340 m s−1).
In this experiment, when Ur = 4.8, the maximum measured sound pressure level was 124.4 dB, and the corresponding effective value of sound pressure p 0 is 33.3 Pa. According to (3.1), the velocity amplitude va of the acoustic particle is calculated to be 0.081 m s−1. From dimensionless velocity amplitude Ua = va/(fab), Ua = 0.013, accounting for 1.05 % of the tip clearance vortex pulsation amplitude  ${U^{\prime}_r} = 1.24$ measured by the hot-wire in this state. Thus, the flow velocity caused by acoustic particles is very weak, and the hot-wire measurement data are mainly the pulsating velocity of the flow sound. This proportional relationship is consistent with the numerical simulation results of Langthjem & Nakano (Reference Langthjem and Nakano2016). Their research showed that in the presence of acoustic feedback, even if it is only 1 % of the incoming flow velocity, it can have a significant effect on the intensity and frequency of vortex shedding.
(ii) Acoustic measurement results: the acoustic signal measured by the microphone near the trailing edge of the blade includes the aerodynamic noise generated by the tip clearance flow and the pressure fluctuation of the blade trailing-edge flow as well as the excitation noise of the acoustic mode of the cascade duct. The aerodynamic noise generated by tip clearance flow and blade trailing-edge flow is broadband self-noise (Brooks, Pope & Marcolini Reference Brooks, Pope and Marcolini1989; Kameier & Neise Reference Kameier and Neise1997). As the wind speed increases, the broadband self-noise increases overall (figure 11), and there is generally no discrete peak. In the measured noise signal in figure 11, except for Ur = 2.4, there are obvious discrete peaks at other mean flow velocities. The discrete peaks are mainly the noise generated by the excitation of the first-order acoustic mode fr = 1 along the flow direction of the cascade duct. It is assumed that the noise signal is caused by the tip clearance vortex pulsation, and the obvious peak signal should be observed in the flow spectrum. However, in the flow spectrum of Ur = 3.20–4.00 shown in figure 9, the amplitude of fr = 1 is not dominant. The discrete peak in the noise measurement results is mainly the noise signal excited by the acoustic mode of the cascade duct. When the cascade model enters the fluid–acoustic–structure interaction region (Ur = 4.32–5.12), the main modes of flow and noise are consistent, and they produce strong coupling and mutual enhancement, and the sound pressure of discrete noise also gradually increases. However, when Ur = 5.60, the sound pressure of discrete noise decreases significantly, while the amplitude of fluid pulsation remains high (figure 9), which further confirms the above inference. We conclude that the discrete peak component of the noise signal is mainly the noise of the cascade duct, and the broadband noise component is the aerodynamic noise caused by the fluid pulsation.
4. Conclusion
In this study, we successfully designed a planar compressor cascade model that can effectively reproduce the acoustic resonance phenomenon based on the principle that the first-order acoustic-mode frequency of the plane cascade flow duct, second-order vibration mode frequency of the blade and natural vortex shedding frequency of the blade (156.3 Hz) are equal. In the low-speed wind tunnel test, the acoustic resonance phenomenon was successfully reproduced when the mean flow velocity Ur increased from 2.4 to 5.6, and the resonance-mode frequency coincided with the above design value, i.e. 156.3 Hz. Analysing the simultaneous measurement of fluid–acoustic–structure multi-physical field parameters revealed that the amplitudes of blade vibration stress, noise, blade trailing-edge vortex and tip clearance leakage vortex show a trend of increasing and then decreasing, reaching the maximum value in the acoustic resonance state (4.32 ≤ Ur ≤ 5.12). Fatigue cracks of the second-order torsional vibration appeared on the root of the blade. The frequency lock-in region of the compressor blade cascade was divided into the acoustic–structure interaction region (3.20 ≤ Ur ≤ 4.32), the fluid–acoustic–structure interaction region (4.32 ≤ Ur ≤ 5.12) and the dominant region of the first-order acoustic modes (5.12 ≤ Ur ≤ 5.60). This shows the following competition phenomenon of fluid–acoustic–structure modes: acoustic modes > blade vibration modes > flow modes. The findings reported in this paper provide a new way to study the acoustic resonance of compressor blades.
Acknowledgements
The authors thank the anonymous referees for their helpful comments on an earlier draft. We also thank Professor Nan Gao for the analysis and discussion of noise and flow measurement results.
Funding
This study was co-supported by the Fundamental Research Funds for the Central Universities of China (no. 20720210050), Fujian Provincial Science and Technology Program Foreign Cooperation Project (no. 2023I0003) and the Project on the Integration of Industry, Education and Research of the Aero Engine Corporation of China (no. HFZL2018CXY009).
Declaration of interests
The authors report no conflict of interest.
Data availability statement
Data are available on request from the authors.
Author contributions
R.L.: conceptualisation, supervision, formal analysis and writing. Z.C.: methodology, investigation and data curation. S.X.: investigation. R.L.: conceptualisation and methodology. Q.L.: supervision and conceptualisation.


 Open access