Hostname: page-component-7bb8b95d7b-qxsvm Total loading time: 0 Render date: 2024-10-04T07:04:09.489Z Has data issue: false hasContentIssue false

Reynolds number dependence of turbulent kinetic energy and energy balance of 3-component turbulence intensity in a pipe flow

Published online by Cambridge University Press:  10 November 2023
Marie Ono*
Affiliation:
National Institute of Advanced Industrial Science and Technology (AIST), National Metrology Institute of Japan (NMIJ), 1497-1 Teragu, Tsukuba, Japan Department of Energy Engineering and Science, Nagoya University, Furocho, Nagoya, Japan
Noriyuki Furuichi
Affiliation:
National Institute of Advanced Industrial Science and Technology (AIST), National Metrology Institute of Japan (NMIJ), 1497-1 Teragu, Tsukuba, Japan
Yoshiyuki Tsuji
Affiliation:
Department of Energy Engineering and Science, Nagoya University, Furocho, Nagoya, Japan
*
Email address for correspondence: [email protected]

Abstract

Measurement data sets are presented for the turbulence intensity profile of three velocity components ($u$, $v$ and $w$) and turbulent kinetic energy (TKE, $k$) over a wide range of Reynolds numbers from $Re_\tau =990$ to 20 750 in a pipe flow. The turbulence intensity profiles of the $u$- and $w$-component show logarithmic behaviour, and that of the $v$-component shows a constant region at high Reynolds numbers, $Re_\tau >10\,000$. Furthermore, a logarithmic region is also observed in the TKE profile at $y/R=0.055\unicode{x2013}0.25$. The Reynolds number dependences of peak values of $u$-, $w$-component and TKE fit to both a logarithmic law (Marusic et al., Phys. Rev. Fluids, vol. 2, 2017, 100502) and an asymptotic law (Chen and Sreenivasan, J. Fluid Mech., vol. 908, 2020, R3), within the uncertainty of measurement. The Reynolds number dependence of the bulk TKE $k^+_{bulk}$, which is the total amount of TKE in the cross-sectional area of the pipe also fits to both laws. When the asymptotic law is applied to the $k^+_{bulk}$, it asymptotically increases to the finite value $k^+_{bulk}=11$ as the Reynolds number increases. The contribution ratio $\langle u'^2\rangle /k$ reaches a plateau, and the value tends to be constant within $100< y^+<1000$ at $Re_\tau >10\ 000$. Therefore, the local balance of each velocity component also indicates asymptotic behaviour. The contribution ratios are balanced in this region at high Reynolds numbers as $\langle u'^2\rangle /k\simeq 1.25$, $\langle w'^2\rangle /k\simeq 0.5$ and $\langle v'^2\rangle /k \simeq 0.25$.

Type
JFM Papers
Copyright
© The Author(s), 2023. Published by Cambridge University Press

1. Introduction

Turbulent kinetic energy (TKE) is an important statistic in turbulence. It is well known that TKE is used to determine the turbulence viscosity in the classic $k-\epsilon$ model. TKE is an effective parameter in this model and has been determined empirically based on experimental data. In recent studies of wall-bounded turbulence, many data regarding TKE have been reported in terms of the energy budget with the development of direct numerical simulation (DNS) (Abe & Antonia Reference Abe and Antonia2011; Schiavo, Wolf & Azevedo Reference Schiavo, Wolf and Azevedo2017; Cho, Hwang & Choi Reference Cho, Hwang and Choi2018; Wei Reference Wei2020). However, most reports of TKE are related to the energy budget, and there are still few reports of its value, which is a summation of 3-component turbulence intensity. For example, the Reynolds number dependence of the TKE profile and its scaling have been used to improve wall-bounded turbulence models; however, this topic has not been well studied.

To obtain TKE profiles, 3-component turbulence intensity profiles are necessary. In previous DNS studies, Wu & Moin (Reference Wu and Moin2008), Chin, Monty & Ooi (Reference Chin, Monty and Ooi2014) and Ahn et al. (Reference Ahn, Lee, Lee, Kang and Sung2015) reported 3-component turbulence intensity profiles for pipe flows. Regarding DNS data at $Re_\tau >5000$, Pirozzoli et al. (Reference Pirozzoli, Romero, Fatica, Verzicco and Orlandi2021) and Yao et al. (Reference Yao, Rezaeiravesh, Schlatter and Hussain2023) examined for pipe flows, and Lee & Moser (Reference Lee and Moser2015) and Yamamoto & Tsuji (Reference Yamamoto and Tsuji2018) examined for channel flows. There are few experiments on 3-component profiles in the past because of measurement difficulties. To assess pipe flows, Laufer (Reference Laufer1954) measured 3-component profiles using hot-wire anemometry at $Re_D=4.3\times 10^4$ and Durst, Jovanović & Sender (Reference Durst, Jovanović and Sender1995) conducted measurements using laser Doppler velocimetry (LDV) at $Re_D=2.1\times 10^4$. Recently, Zimmerman et al. (Reference Zimmerman2019) reported 3-component turbulence intensity profiles at high Reynolds numbers up to $Re_\tau =10\ 000$ in CICLoPE using a multielement hot-wire probe. Örlü et al. (Reference Örlü, Fiorini, Segalini, Bellani, Talamelli and Alfredsson2017) also reported 3-component turbulence intensity profiles in CICLoPE up to $Re_\tau =38\ 000$ using a $x$-wire probe. However, their measurements were limited around the logarithmic region. To the best of the authors’ knowledge, there has been no other study on 3-component turbulence intensity and TKE profiles at high Reynolds numbers, such as $Re_\tau >10\ 000$. In this study, we report 3-component turbulence intensity profiles and TKE profiles from the near-wall region to the pipe centre up to $Re_\tau \approx 20\ 000$ in a pipe using LDV. In most experiments, hot-wire measurement has been applied at high Reynolds numbers. However, there are several factors that can influence the measurement, such as the spatial resolution inherent in each measurement device. Therefore, data obtained by different measurement devices are important for confirming the validity of high-Reynolds-number experimental data.

In this paper, we focus on the Reynolds number dependence and the scaling of 3-component turbulence intensity and TKE. In addition, we study their contributions to TKE. Three specific points are discussed in this study: (1) the scaling of 3-component turbulence intensity profiles and TKE up to $Re_\tau \approx 20\ 000$, especially in the logarithmic region; (2) the Reynolds number dependence of peak values in the turbulence intensity, TKE and the bulk TKE $k^+_{bulk}$; (3) the contribution of each velocity component to TKE.

Regarding the first point, the logarithmic relation in the streamwise turbulence intensity profile according to the attached eddy hypothesis (AEH) (Townsend Reference Townsend1951) has been reported and verified by many research groups (Hultmark et al. Reference Hultmark, Vallikivi, Bailey and Smits2013; Marusic et al. Reference Marusic, Monty, Hultmark and Smits2013; Vallikivi, Hultmark & Smits Reference Vallikivi, Hultmark and Smits2015; Örlü et al. Reference Örlü, Fiorini, Segalini, Bellani, Talamelli and Alfredsson2017; Samie et al. Reference Samie, Marusic, Hutchins, Fu, Fan, Hultmark and Smits2018; Yamamoto & Tsuji Reference Yamamoto and Tsuji2018). The hypothesis is that the population density of eddies attached to the wall varies inversely with the distance from the wall (Townsend Reference Townsend1976; Perry & Chong Reference Perry and Chong1982). Recently, logarithmic regions in the spanwise component and constant regions in the wall-normal component have been reported at high Reynolds numbers (Zhao & Smits Reference Zhao and Smits2007; Sillero, Jiménez & Moser Reference Sillero, Jiménez and Moser2013; Willert et al. Reference Willert, Soria, Stanislas, Klinner, Amili, Eisfelder, Cuvier, Bellani, Fiorini and Talamelli2017; Baidya et al. Reference Baidya, Philip, Hutchins, Monty and Marusic2021). However, no studies have mentioned the strict relation between each region observed the logarithmic/constant region. In addition, no papers have mentioned the regions strictly for the spanwise and the wall-normal component. In the present study, we investigate the start/end point of each logarithmic/constant region and discuss the relation among logarithmic/constant regions. Furthermore, logarithmic scaling is also extended to TKE profiles to provide a more comprehensive scaling discussion.

The second point concerns the Reynolds number dependence for the value of the inner peaks and total amount of TKE across the pipe, namely, the bulk TKE ($k^+_{bulk}$). Logarithmic law (Marusic, Baars & Hutchins Reference Marusic, Baars and Hutchins2017) and asymptotic law (Chen & Sreenivasan Reference Chen and Sreenivasan2020) have been proposed regarding the Reynolds number dependence of the streamwise inner peak. Marusic et al. (Reference Marusic, Baars and Hutchins2017) attributed the mechanism for the logarithmically increasing inner peak to the interaction between the inner region and turbulence structure in the logarithmic region of the turbulence intensity profile. On the other hand, Chen & Sreenivasan (Reference Chen and Sreenivasan2020) predicted the finiteness of the inner peak from the dissipation and production limits and reported an asymptotic equation. The values of the peaks calculated by these two laws are significantly different at higher Reynolds number. Furthermore, Chen & Sreenivasan (Reference Chen and Sreenivasan2022) reported that the peak in the spanwise turbulence intensity also asymptotically grows with increasing Reynolds number recently. In this paper, we report the Reynolds number dependence of inner peaks for streamwise and spanwise components up to $Re_\tau \approx 20\,000$ and attempt to apply the logarithmic and asymptotic laws to the peak of TKE. Furthermore, the Reynolds number dependence of $k^+_{bulk}$ obtained by the integration of the TKE profile over the cross-sectional area is also investigated. The integral values of TKE production and dissipation with respect to the wall-normal position were calculated previously, and it was reported that these values increase or decrease logarithmically with increasing Reynolds number in a canonical flow [pipe, channel, turbulent boundary layer (TBL)] (Renard & Deck Reference Renard and Deck2016; Wei Reference Wei2018). These studies discussed the relationship among the integrated TKE production value, friction coefficient and the bulk mean velocity. In this study, we focus on $k^+_{bulk}$. Due to the closed geometry in a pipe flow, a more concrete discussion for the scaling of integral value is possible compared with the TBL. The Reynolds number dependence and scaling of the local TKE is discussed as the first argument, and then we investigate how the TKE increases with increasing Reynolds number for the whole flow field.

The final point is the contribution ratio of each component for TKE. The TKE is expected to increase with Reynolds number, but there has been no discussion on the contribution ratios of $\langle u'^2\rangle /k$, $\langle v'^2\rangle /k$ and $\langle w'^2\rangle /k$. It is intuitively understood that the contribution ratio of the streamwise component is significant; however, the turbulence intensity of other components also increases with increasing Reynolds number. We discuss the Reynolds number dependence of the contribution ratio of each velocity component to TKE.

2. Experiments

The experiment in the present paper was conducted at the High Reynolds Number Actual Flow Facility (Hi-Reff). The pipe layout was the same as that in a previous paper (Furuichi et al. Reference Furuichi, Terao, Wada and Tsuji2015), but the glass pipe was improved in this experiment to accurately obtain the three velocity components. The glass pipe was polished to achieve low tolerances for the diameter and the thickness of the pipe, which were 3 $\mathrm {\mu }$m and 5.8 $\mathrm {\mu }$m, respectively. These small tolerances contributed to reducing the misalignment of the laser paths. Furthermore, the diameter of the present glass pipe was 100.78 mm, which aligned with one of the upstream pipes better than it did in the previous study. The upstream pipe length was $113D$, and this pipe section was well polished, with a mean roughness of $0.1\ \mathrm {\mu }$m and a maximum roughness height of $0.8\ \mathrm {\mu }$m for 90$D$. Further upstream, the 30 m (300$D$) straight pipe with a diameter of 1.5$D$ was smoothly connected to the testing pipe. The working fluid was water and was supplied by the gravity force from a constant-level head tank, with a head of 30 m. The temperature of the water was maintained at $\pm {1}\,^\circ$C within one profile measurement. The flow rate was measured using a static gravimetric method. The bulk velocity was precisely calculated from the flow rate and the pipe diameter.

The velocity measurement was conducted using LDV. The details of the measurement system were reported in previous papers (Furuichi et al. Reference Furuichi, Terao, Wada and Tsuji2015; Ono et al. Reference Ono, Furuichi, Kurihara, Wada and Tsuji2022). In the present study, the measurement was conducted for the streamwise component $u$, the wall-normal component $v$ and the spanwise component $w$. The measurement positions and the lines were different among these components. They are shown in figure 1. The measurement line for the $u$-component was slightly inclined from the wall-normal axis. For the $v$-component, the measurement positions were along the wall-normal axis. For the $w$-component, the measurement line was rotated 90$^\circ$ from the original wall-normal axis.

Figure 1. (a) Experimental coordinates and measurement points. The red dashed line is the wall-normal axis. The glass pipe is submerged in a water chamber to reduce the reflection of the laser beam. (b) Definition of control length.

To obtain precise velocity data using LDV, the absolute value of velocity, the control volume and the correction regarding the spatial resolution were especially considered as reported in a previous paper (Ono et al. Reference Ono, Furuichi, Kurihara, Wada and Tsuji2022). First, the calibration for the absolute value of the velocity was carried out by comparing the wire rotating speed and its velocity measured by LDV. Hereinafter, the device for this calibration is called the LDV calibrator. Furthermore, using the LDV calibrator, the laser intensity profile for the LDV in air was obtained. In general, the control volume of the LDV is determined by setting a certain threshold for this intensity value. However, the control volume in water is different from one obtained in air because of the refractive index and the decreasing beam intensity by passing through the glass and water. This means that the threshold level in the actual measurement field, in water, must be determined as another value. As explained in a previous paper, we determined this value using measurement results of the turbulence intensity profiles obtained by three different control volumes. According to Durst et al. (Reference Durst, Jovanović and Sender1995), the measured streamwise turbulence intensity is expressed by the following equation:

(2.1)\begin{equation} \langle u_m'^2\rangle = \langle u_{cv}'^2\rangle +\frac{L_u^2}{16} \left(\frac{{\rm d}U_{cv}}{{{\rm d} y}}\right) ^2 + \frac{L_u^2}{32} \left(\frac{{\rm d}^2 \langle u_{cv}'^2 \rangle}{{{\rm d} y}^2}\right), \end{equation}

where $L_u$ is the control length of the streamwise component, $u'$ is the streamwise velocity fluctuation and $U$ is the mean velocity. The bracket $\langle \ \rangle$ denotes the ensemble average. Furthermore, subscript $m$ is the measured value and subscript $cv$ is the value at the centre of the control length. The threshold level was determined to minimise the difference in corrected turbulence intensity using (2.1) in each control volume. See a previous paper for a more detailed procedure (Ono et al. Reference Ono, Furuichi, Kurihara, Wada and Tsuji2022). Considering the reflection index, the actual measurement volume in water is given by the following: the minor elliptical axis is 0.069 mm and the major axis is 0.709 mm for the $u$- and $v$-component. For the $w$-component, the respective axes are 0.057 mm and 0.466 mm. Note that the length of the control volume projection to the measurement axis, which is the control length $L$, is different among the measurement components as shown in figure 1(b) because of the different insertion angles of the laser beam and focal lengths. The control lengths for several examined Reynolds numbers are listed in table 1. Using the precise control lengths obtained and adopting (2.1) to the measurement result, the corrected turbulence intensity was finally obtained.

Table 1. Control lengths of LDV measurement.

In addition to the above procedure, two corrections regarding the probability density function were conducted. One is a correction using a weighting function with the transit time of a particle in the measurement control volume (Albrecht et al. Reference Albrecht, Borys, Damascheke and Tropea2002). Another is a correction for the fringe distortion of the LDV. The turbulence intensities are affected by the fringe distortion because particles with same velocity are detected as different velocity dependence of passing position in the control volume. The fringe distortion occurs because of manufacturing problems such as beam parallelism and lens aberration. Therefore, its influence is different from device to device. We evaluated the fringe distortion by the LDV calibrator. In this study, we applied a correction method for the fringe distortion, which has been developed in a previous study (Ono et al. Reference Ono, Furuichi, Kurihara, Wada and Tsuji2022), based on the probability density function of the velocity fluctuation, which is assumed to be same at each position in the control volume. The corrected turbulence intensity is calculated by the reconstructed probability density profile in the infinitesimal control volume. See a previous paper for these correction methods in detail (Ono et al. Reference Ono, Furuichi, Kurihara, Wada and Tsuji2022). In this study, these corrections (weighting function with transit time for the absolute value of velocity, the spatial resolution, the fringe distortion) were also applied for $v$- and $w$-component.

The range of Reynolds numbers examined in this experiment was from $Re_\tau =990$ to 20 750. The nominal Reynolds numbers were set to $Re_\tau =990$, 1990, 2990, 4200, 6050, 8700, 11 200, 14 200 and 20 750. The deviations of the Reynolds number measured from the nominal value were less than 1.5 % for the three velocity components. Note that the wall shear stress was calculated with the equation of the friction factor given by Furuichi et al. (Reference Furuichi, Terao, Wada and Tsuji2015) using the bulk velocity.

3. 3-component turbulence intensity and TKE profiles

3.1. Results and comparison with previous research

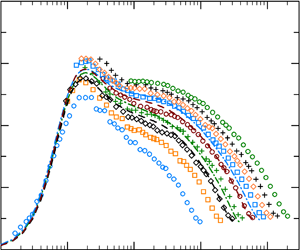
The turbulence intensity profiles for $u$-, $v$- and $w$-component are shown in figure 2(af). All turbulence intensity profiles show good agreement with the DNS data at low Reynolds numbers. In particular, the present data at $Re_\tau =990$, 1990 and 2990 are in excellent agreement with the DNS by referenced Chin et al. (Reference Chin, Monty and Ooi2014) and Ahn et al. (Reference Ahn, Lee, Lee, Kang and Sung2015) over the profile. The present data also agree with the DNS results presented by Pirozzoli et al. (Reference Pirozzoli, Romero, Fatica, Verzicco and Orlandi2021) at $Re_\tau =6000$, while a small difference is observed at $y^+=100\unicode{x2013}400$. At a higher Reynolds number, $Re_\tau =8700$, the present profile agrees well with the channel DNS results presented by Yamamoto & Tsuji (Reference Yamamoto and Tsuji2018), excluding the outer region. It is believed that this is due to the differences in the geometries and Reynolds number examined. Thus, the comparison result between the present and DNS profiles show reasonable consistency from $Re_\tau =990$ to $Re_\tau =8700$, with a small difference observed.

Figure 2. Turbulence intensity profiles for the (a,b) $u$-component, (c,d) $v$-component, (e,f) $w$-component and (g,h) TKE. The blue and orange dashed lines represent data at $Re_\tau =1000$ and 2000 by Chin et al. (Reference Chin, Monty and Ooi2014), and the black solid line indicates $Re_\tau =3000$ by Ahn et al. (Reference Ahn, Lee, Lee, Kang and Sung2015). The black and brown dashed lines indicate data at $Re_\tau =3000$ and 6000 by Pirozzoli et al. (Reference Pirozzoli, Romero, Fatica, Verzicco and Orlandi2021). The channel data are expressed by green and blue alternate long and short dashed lines at $Re_\tau =4000$ and 8000 (Yamamoto & Tsuji Reference Yamamoto and Tsuji2018). The regions shaded by grey indicate logarithmic region ($y/R=0.055\unicode{x2013}0.25$) and the yellow shaded is the constant region ($y/R=0.020\unicode{x2013}0.10$).

The experimental data obtained at a high Reynolds number are presented, and they are compared with the previous experimental data for $Re_\tau >10\,000$. The turbulence intensity for the streamwise component in pipe flow has been reported by many researchers (e.g. Durst et al. Reference Durst, Jovanović and Sender1995; Den Toonder & Nieuwstadt Reference Den Toonder and Nieuwstadt1997). However, they were examined at low Reynolds numbers. At high Reynolds numbers over $Re_\tau =10\,000$, several experimental data have been reported. From Superpipe, the profile using a nanoscale thermal anemometry probe (NSTAP) with high spatial resolution was presented by Hultmark et al. (Reference Hultmark, Vallikivi, Bailey and Smits2013), and from CICLoPE, the profiles using the hot-wire and particle image velocimetry (PIV) methods were reported (Örlü et al. Reference Örlü, Fiorini, Segalini, Bellani, Talamelli and Alfredsson2017; Willert et al. Reference Willert, Soria, Stanislas, Klinner, Amili, Eisfelder, Cuvier, Bellani, Fiorini and Talamelli2017). In figure 3(a), the streamwise turbulence intensity profiles are compared between our present data, Superpipe and CICLoPE. In the logarithmic region, the present profile agrees well with the CICLoPE profile but plots above the Superpipe profile.

Figure 3. Comparison with other facilities at high Reynolds numbers. Orange diamond and green circle symbols denote data from the present experimental work at $Re_\tau =11\,200$ and 20 750, respectively, which are the same as those in figure 2. The cross symbols ($\times$) denote data from Superpipe by (a) Hultmark et al. (Reference Hultmark, Vallikivi, Bailey and Smits2013) and (b) Fu et al. (Reference Fu, Fan and Hultmark2019). Long and short dashed lines in (a) and (b) denote results from CICLOPE by Willert et al. (Reference Willert, Soria, Stanislas, Klinner, Amili, Eisfelder, Cuvier, Bellani, Fiorini and Talamelli2017). The green triangle in (c) denotes data from CICLoPE by Zimmerman et al. (Reference Zimmerman2019) for the spanwise component.

The wall-normal component measurement at a high Reynolds number was presented by Fu, Fan & Hultmark (Reference Fu, Fan and Hultmark2019) and Willert et al. (Reference Willert, Soria, Stanislas, Klinner, Amili, Eisfelder, Cuvier, Bellani, Fiorini and Talamelli2017). Fu et al. (Reference Fu, Fan and Hultmark2019) measured the wall-normal component by X-NSTAP at Superpipe. The present results show reasonable agreement with the result by Willert et al. (Reference Willert, Soria, Stanislas, Klinner, Amili, Eisfelder, Cuvier, Bellani, Fiorini and Talamelli2017) at the inner region and with results by Fu et al. (Reference Fu, Fan and Hultmark2019) at the outer region, as shown in figure 3(b). To the best of the authors’ knowledge, the experimental data for the high-Reynolds-number spanwise component in a pipe flow were given by only Zimmerman et al. (Reference Zimmerman2019) (CICLoPE). They measured up to $Re_\tau =10\,000$ using their own spatial probe. The comparison is shown in figure 3(c). Both profiles agree well with each other.

3.2. Scaling of 3-component turbulence intensity and TKE profiles

In § 3.1, the validity of the present data of 3-component from low to high Reynolds numbers by comparing with previous data have been confirmed. In this section, the scaling of each profile is discussed based on the present data. As shown in the $u$-component of the physical coordinate (figure 2b), the overlap region is observed at approximately $0.055< y/R<0.25$ at $Re_\tau \geqq 11\,200$. From previous experimental studies, this overlap region is recognised as the logarithmic region according to the AEH, and the logarithmic relation is given as follows (Ono et al. Reference Ono, Furuichi, Kurihara, Wada and Tsuji2022):

(3.1)\begin{equation} \langle(u'^+)^2\rangle=1.60-1.44 \ln (y/R),\end{equation}

where $R$ is the outer length scale (radius of the pipe). Equation (3.1) is calculated for the grey shaded area ($0.055< y/R<0.25$). Hultmark et al. (Reference Hultmark, Vallikivi, Bailey and Smits2013) reported that the logarithmic slope is 1.24, and Örlü et al. (Reference Örlü, Fiorini, Segalini, Bellani, Talamelli and Alfredsson2017) ascertained 1.30 for pipe flow at high Reynolds numbers. Compared with these previously obtained values, the present slope is larger. This is because the constants are very sensitive to the definition of the logarithmic region. When the slope is calculated at $0.04< y/R<0.2$, the slope becomes 1.29.

The turbulence intensity profiles for the $v$-component are shown in figure 2(c) and (d). The lower limit of the measurement position for the $v$-component is approximately $y/R=0.003$ due to the optical noise. According to the AEH, the constant region emerges in the $v$-component. The constant region in this result is observed to have a wider range from $y/R =0.020$ to 0.10 at $Re_\tau \geqq 11\,200$, as shown by the yellow shaded area, and is in a smaller $y/R$ region than that of the $u$-component. The constant value is given by the following:

(3.2)\begin{equation} \langle(v'^+)^2\rangle=1.30.\end{equation}

This result is consistent with the value presented by Zhao & Smits (Reference Zhao and Smits2007) and Willert et al. (Reference Willert, Soria, Stanislas, Klinner, Amili, Eisfelder, Cuvier, Bellani, Fiorini and Talamelli2017).

The turbulence intensity for the $w$-component is shown in figures 2(e) and 2(f). The peak of the $w$-component turbulence intensity (defined hereafter as $P_w$) moves toward a larger $y^+$ position with increasing Reynolds number. The spatial resolution effect of the value on turbulence intensity is small at the $w$-component due to the small velocity gradient (the spatial resolution effect of LDV depends on the control volume and velocity gradient). However, the uncertainty of the position is larger than that of the other components near the wall at high Reynolds numbers due to the large control volume. Note that the DNS data in Pirozzoli et al. (Reference Pirozzoli, Romero, Fatica, Verzicco and Orlandi2021) also show that the peak value $P_w$ scaled by the inner variables tended to slightly move away from the wall with increasing Reynolds number up to $Re_\tau =6000$. The logarithmic region is observed in the range from $y/R=0.055$ to 0.25 at $Re_\tau \geqq 11\,200$ and is the same as that of the $u$-component. The relation is approximated well by the following:

(3.3)\begin{equation} \langle(w'^+)^2\rangle=0.98-0.46 \ln (y/R).\end{equation}

The logarithmic slope of the $w$-component varied widely among previous studies and ranged from 0.27 to 0.64 (Sillero et al. Reference Sillero, Jiménez and Moser2013; Lee & Moser Reference Lee and Moser2015; Örlü et al. Reference Örlü, Fiorini, Segalini, Bellani, Talamelli and Alfredsson2017; Zimmerman et al. Reference Zimmerman2019; Baidya et al. Reference Baidya, Philip, Hutchins, Monty and Marusic2021).

From the data set for the three velocity components, TKE can be calculated. We have never seen a TKE profile at a high Reynolds number and a detailed discussion of the profile. The TKE is calculated as the summation of the 3-component turbulence intensity,

(3.4)\begin{equation} k^+=\{\langle(u'^+)^2\rangle+\langle(v'^+)^2\rangle+ \langle(w'^+)^2\rangle\}/2.\end{equation}

The TKE profiles for inner and outer scaling are shown in figures 2(g) and 2(h). The three turbulence intensities are not measured at the same locations because of the different measurement lines. However, they are interpolated at the appropriate locations for TKE calculation. The lowest measurable position is restricted by the $v$-component, and it is approximately $y/R=0.003$. Figures 2(g) and 2(h) show the results for the positions where the three components could be measured. The TKE profile shows good agreement with the DNS results at $Re_\tau =3000$ and 6000 for the pipe. The $Re_\tau =4000$ and 8700 results are also in good agreement with the DNS data for the channel except in the outer region. The difference in the outer region is thought to be due to differences in the geometry of the flow field.

In figure 2(h), the logarithmic region in the TKE profile is also shown by the gray shade. In this region, the TKE profiles collapse to a straight line at $Re_\tau \geqq 11\ 200$. Substituting (3.1)–(3.3) for (3.4), the following logarithmic relation is derived for the TKE profile:

(3.5)\begin{equation} k^+=1.94-0.95 \ln (y/R).\end{equation}

The black dashed line in figure 2(h) represents (3.5). This equation obtained by calculation from (3.1)–(3.3) is consistent with the actual TKE profiles. In the three components, only the constant region of the $v$-component slightly deviates from the logarithmic region of $u$- and $w$-component. However, the position immediately after the constant region of the $v$-component has only a slight slope, and the contribution of the $v$-component to TKE is also smaller than that of the other components. As a result, the range where the logarithmic region is established in the TKE profile is the same as that of the $u$- and $w$-component at $y/R=0.055\unicode{x2013}0.25$. The logarithmic behaviour in the TKE profile could be predicted by assuming (3.1)–(3.3); however, sufficient experimental evidence for the logarithmic region in the TKE profile has not yet been reported. This result is confirmed by the highly accurate measurement of the three velocity components.

4. Reynolds number dependence of local peaks and bulk TKE

4.1. Reynolds number dependence of inner peaks

The Reynolds number dependence of the inner peak of the turbulence intensity in the $u$-component, which is observed at $y^+\approx 15$, is an interesting subject in wall-bounded flow. From previous studies, we generally understand that the inner peak value increases with the Reynolds number. However, the scaling with the Reynolds number is under discussion due to differences among the experimental data. Marusic et al. (Reference Marusic, Baars and Hutchins2017) attributed the mechanism for the logarithmic increase in the inner peak to the interaction between the inner region and turbulence structure in the logarithmic region of the turbulence intensity profile. On the other hand, Chen & Sreenivasan (Reference Chen and Sreenivasan2020) predicted the finiteness of the inner peak from the dissipation and production limits and reported an asymptotic equation. In our previous study (Ono et al. Reference Ono, Furuichi, Kurihara, Wada and Tsuji2022), we reported the Reynolds number dependence of the inner peak for streamwise turbulence intensity, $P_u$, at $y^+\approx 15$ up to $Re_\tau \approx 20\,000$, as shown in figure 4(a). In the examined Reynolds number range, $P_u$ increases with the Reynolds number, and it seems that the trend is consistent with both logarithmic and asymptotic laws. Figure 4(b) shows the Reynolds number dependence of spanwise peak $P_w$ values. The present results of $P_w$ are also consistent with asymptotic law and logarithmic law within the uncertainty.

Figure 4. Reynolds number dependence of peak turbulence intensities for (a) streamwise component, $P_u$; (b) spanwise component, $P_w$; and (c) TKE component, $P_k$; $\blacktriangle$ (black) present; $\blacktriangle$ (blue) DNS data by Pirozzoli et al. (Reference Pirozzoli, Romero, Fatica, Verzicco and Orlandi2021); $\blacktriangle$ (orange), Yao et al. (Reference Yao, Rezaeiravesh, Schlatter and Hussain2023). The grey symbols $\blacktriangle$ (grey) are the results obtained by extrapolating the unmeasured $v$- and $w$-component values from the other Reynolds number results. The dashed lines indicate the logarithmic law, $P_u= 3.0+0.72 \ln (Re_\tau )$, $P_w=0.10+0.30 \ln (Re_\tau )$, $P_k=1.4+0.52 \ln (Re_\tau )$. The solid lines indicate the asymptotic law (Chen & Sreenivasan Reference Chen and Sreenivasan2020), $P_u =11.5\unicode{x2013}19.3Re_\tau ^{-1/4}$, $P_w=3.9\unicode{x2013}10.2Re_\tau ^{-1/4}$, $P_k =7.7\unicode{x2013}15.5Re_\tau ^{-1/4}$. The constants for both lines are obtained by the fitting to the present data.

Chen & Sreenivasan (Reference Chen and Sreenivasan2022) also applied their relation to other statistics, not only turbulence intensity but also pressure fluctuation and dissipation, as follows:

(4.1)\begin{equation} \varPhi_\infty - \varPhi = C_\varPhi Re_\tau^{-1/4},\end{equation}

where $\varPhi$ is the turbulent statistical quantity and $C_\varPhi$ is the coefficient. The power $-1/4$ is derived from the concept of finite energy dissipation at the wall, and coefficient $C_\varPhi$ and the maximum value of $\varPhi$ at an infinite Reynolds number are obtained by fitting. This argument seems to be applicable to not only the peak value of $u$- and $w$-component but also to other statistical values. The position of the peak in the TKE profile is almost equal to the inner peak of the streamwise turbulence intensity profile, while the wall-normal and spanwise components do not show any peak at this position. However, if (4.1) is applicable to them, the Reynolds number dependence of the peak value of TKE follows this equation. The Reynolds number dependence of the inner peak values in the TKE profile $P_k$ is shown in figure 4(c). The gray triangle symbols are the results obtained by extrapolating the unmeasured $v$- and $w$-component values from the other Reynolds number results. The constants for two fitting equations are obtained from the results of the black triangle symbol in which the three components are measured. The Reynolds number dependence of $P_k$ is in very good agreement with pipe DNS data by Yao et al. (Reference Yao, Rezaeiravesh, Schlatter and Hussain2023) and Pirozzoli et al. (Reference Pirozzoli, Romero, Fatica, Verzicco and Orlandi2021). In our previous study, we reported that the Reynolds number dependence of $P_u$ is consistent with logarithmic and asymptotic laws. The present results indicate that $P_w$ and $P_k$ also can be to fit to both laws within the uncertainty of the measurement.

4.2. Bulk TKE

We discuss the total amount of TKE in the cross-sectional area in the pipe, namely, the bulk TKE ($k^+_{bulk}$), especially for Reynolds number dependence. The $k^+_{bulk}$ is defined as follows:

(4.2)\begin{equation} k^+_{bulk}=\int_0^{2{\rm \pi}}\int_0^{1}k^+{\rm d}\eta \,{\rm d}\theta=\sum_{i=1}^{N-1}\frac{k^+_i+k^+_{i+1}}{2}(2\eta_i \Delta \eta _i+\Delta \eta _i^2){\rm \pi},\end{equation}

where the TKE profile is axisymmetric, $\eta =1-y/R$ and $\Delta \eta$ is the distance between two measurement positions. Here $\theta$ is the axis for azimuthal direction, $N$ is the number of measurement points and $k^+_i$ is $k^+$ at the $i$th measurement point. Since the pipe flow is an internal flow without the influence of the secondary flow, such as the corner vortex in the channel flow, the discussion for the integration of kinetic energy is meaningful compared with other canonical flows.

Figure 5 shows the Reynolds number dependence of $k^+_{bulk}$. Because the closest measurable position to the wall varies slightly with the Reynolds number, the integrated range is determined from $y/R=0.0043$ to the centre of the pipe for all Reynolds numbers. In figure 5, the error bars include the uncertainty due to the calculation of bulk TKE without data at $y/R<0.0043$. Since the contribution from the near-wall region to $k^+_{bulk}$ is small in viscous units, the present data show consistency with the DNS data. We discuss hereafter how $k^+_{bulk}$ increases with the Reynolds number. In figure 5, it is observed that $k^+_{bulk}$ increases with Reynolds number. This trend is conformed to both an asymptotic and a logarithmic increase although the asymptotic law seems to be well fitted to experimental data. When (4.1) is fitted to experimental data, as indicated by the black solid line, its Reynolds number dependence seems to be closer to the asymptotic law than the peaks shown in § 4.1. This result suggests that the asymptotic relation by Chen & Sreenivasan (Reference Chen and Sreenivasan2022) is applicable not only to the local value but also to the integral value in the pipe; however, we cannot conclude which law is appropriate to indicate the Reynolds number dependence of $k^+_{bulk}$ in the present. If the $Re_\tau ^{-1/4}$ asymptotic relation is applied, the maximum value at a Reynolds number of infinity is predicted as $k^+_{bulk}=11$ from the present result.

Figure 5. The Reynolds number dependence of $k^+_{bulk}$ integrated from $y/R=0.0043$ to centre. The error bars indicate the uncertainty due to the calculation without data in $y/R<0.0043$. The solid line indicates the $Re_\tau ^{-1/4}$ asymptotic laws proposed by Chen & Sreenivasan (Reference Chen and Sreenivasan2020), $k^+_{bulk}=11\unicode{x2013}15.7Re_\tau ^{-1/4}$. The dashed line indicates the logarithmic law, $k^+_{bulk}=4.8+0.51 \ln (Re_\tau )$. The constants for both lines are obtained by the fitting to the present data.

5. The contributions of 3-component turbulence intensity to TKE

In this section, we focus on the contribution ratio of each velocity component to TKE. The ratio indicates the contribution of turbulence intensity among the three components. In figure 6, the 3-component turbulence intensity divided by local TKE is plotted against the wall normal position. The wall-normal distances in figure 6(a,c,e,g) are inner-scaled using $y^+$, and those in figure 6(b,d,f,h) are outer-scaled using $y/R$. Figure 6(ch) shows contour maps of the profile for the contribution ratio shown in figure 6(a,b). Reflecting the turbulence intensity of each velocity component, the contribution ratio $\langle u'^2\rangle /k$ is the highest, and the contribution ratio $\langle v'^2\rangle /k$ is the lowest. The ratio $\langle v'^2\rangle /k$ increases with the wall-normal position. The ratio $\langle w'^2\rangle /k$ has a local maximum around $y^+=80$ and has a local minimum in the outer region. In the region between this local minimum and the centre of the pipe, the ratio increases with $y^+$ location. The two contribution ratios $\langle v'^2\rangle /k$ and $\langle w'^2\rangle /k$ approach the same value toward the centre of the pipe. However, $\langle u'^2\rangle /k$ is larger than the $v$- and $w$-component. Therefore, the flow is not isotropic even at the pipe centre for a high Reynolds number.

Figure 6. (a,b) The profile of the contribution ratio for each velocity component to TKE. Symbols are the same as in figure 2. The red bar indicates the region of constant contribution ratio ($100< y^+ <1000$), and the blue bar indicates the logarithmic region of mean velocity at $Re_\tau =20\,750$ ($430< y^+ <3100$). (ch) The contour maps of the contribution profiles for each component: (a,c,e,g) scaled by inner variable $y^+$, (b,d,f,h) scaled by outer variable $y/R$.

In figure 6(b), the profiles of the contribution ratio for each velocity component are roughly scaled by $y/R$ among different Reynolds numbers (except $Re_\tau <2990$) in $0.025< y/R$, including the logarithmic region of TKE, as indicated by the grey shade in figure 2. In the profiles scaled by the inner variable $y^+$, the profiles for the contribution ratio of $\langle u'^2\rangle /k$ and $\langle v'^2\rangle /k$ are accurately scaled for $y^+<70$ and $\langle w'^2\rangle /k$ for $y^+<700$ in figure 6(a). Here, we focus on the region from $y^+=100$ to 1000. $\langle u'^2\rangle /k$ increases with the Reynolds number; however, the value reaches a plateau and tends to remain constant within this region at higher Reynolds numbers, i.e. $Re_\tau \geqq 11\,200$. The value of $\langle u'^2\rangle /k$ around this region is approximately 1.25. It can be understood from the contour map in figure 6(c) that the plateau region expands with the Reynolds number. In the same location, $\langle v'^2\rangle /k$ is not constant, but the slope decreases and approaches flatness as the Reynolds number increases. Here $\langle w'^2\rangle /k$ is scaled independently with the Reynolds number at this location, but the value does not change drastically. These behaviours of the contribution ratio seem to indicate that the energy balance of the 3-components approaches an asymptote in the region $y^+=100$ to 1000. Although $\langle v'^2\rangle /k$ and $\langle w'^2\rangle /k$ have small slopes, they are almost balanced in this region when the Reynolds number becomes large, as $\langle u'^2\rangle /k\simeq 1.25$, $\langle w'^2\rangle /k\simeq 0.5$ and $\langle v'^2\rangle /k\simeq 0.25$.

The part of the contribution constant region from $y^+=100$ to 1000 belongs to the logarithmic region of the mean velocity profile. The logarithmic region of the mean velocity profile has been reported by Marusic et al. (Reference Marusic, Monty, Hultmark and Smits2013), as $3Re_\tau ^{1/2}< y^+<0.15Re_\tau$ and, thus, $430< y^+<3100$ at $Re_\tau =20\,750$. Pope (Reference Pope2000) mentioned that the energy of each velocity component maintains balance due to the self-similar structure in the logarithmic region from the knowledge of the very low Reynolds number ($Re_\tau =180$) (Kim, Moin & Moser Reference Kim, Moin and Moser1987). Since the logarithmic region of the mean velocity profile emerges at a larger Reynolds number according to recent experiments, for instance $Re_\tau >10\,000$ by Furuichi et al. (Reference Furuichi, Terao, Wada and Tsuji2015) and $Re_\tau \geqq 6700$ by Marusic et al. (Reference Marusic, Baars and Hutchins2017), Pope's argument may be satisfied at high Reynolds numbers. The present data support his statement that each velocity component balances in the logarithmic region of the mean velocity profile. However, we should note that the constant region of the contribution ratio for the streamwise component is not completely the same as the logarithmic region of the mean velocity profile although this region is consistent with the part of the mean velocity logarithmic region. The constant contribution region is close to the inertial sublayer where the Reynolds stress $\langle uv \rangle ^+$ becomes a plateau. For a sufficiently high Reynolds number, $\langle uv \rangle ^+ \simeq 1$ around $y_p^+=2\sqrt {Re_\tau }$ (Sreenivasan & Sahay Reference Sreenivasan and Sahay1997; Monkewitz Reference Monkewitz2021). In our data, $y_p^+=288$ for $Re_\tau =20\ 750$, and the constant contribution region partially overlaps the inertial sublayer.

6. Conclusion

A data set of the turbulence intensity profiles for three velocity components and the TKE in a pipe flow measured by LDV in Hi-Reff was presented in this paper. Measurements were conducted based on detailed consideration and correction for the measurement issues of LDV, including the spatial resolution. The turbulence intensity profiles for each component and the TKE profiles were consistent with DNS data at low Reynolds numbers, such as $Re_\tau \leqq 6000$. The highest Reynolds number examined was $Re_\tau =20\,750$, which is the largest Reynolds number currently reported for TKE profiles. The results of the present study can be summarised as follows.

The logarithmic regions of the turbulence intensity profiles for the $u$- and $w$-component are in the same region $0.055< y/R <0.25$ for $Re_\tau >11\,200$. Although the constant region of the $v$-component slightly deviates from those of the other components, logarithmic behaviour is clearly observed in the TKE profile at $0.055< y/R <0.25$.

Regarding the Reynolds number dependence of the streamwise inner peak $P_u$, spanwise peak $P_w$ and TKE peak $P_k$, the present results could fit both the asymptotic law and logarithmic law within the uncertainty of the measurement. Furthermore, $k^+_{bulk}$ increases with the Reynolds number, and this trend can also fit both laws. When the $Re_\tau ^{-1/4}$ asymptotic relation is applied, the maximum value at a Reynolds number of infinity is predicted as $k^+_{bulk}=11$ from the present result.

The Reynolds number dependence of the contribution for each velocity component was confirmed at $100< y^+<1000$. The contribution ratio $\langle u'^2\rangle /k$ increases with the Reynolds number in this region; however, the value reaches a constant and plateaus at $Re_\tau \geqq 11\ 200$. Although $\langle v'^2\rangle /k$ and $\langle w'^2\rangle /k$ have a weak dependence on position, they are almost balanced in this region at high Reynolds numbers as $\langle u'^2\rangle /k \simeq 1.25$, $\langle w'^2\rangle /k\simeq 0.5$ and $\langle v'^2\rangle /k\simeq 0.25$.

Funding

This research was partially supported by JSPS KAKENHI grant numbers JP19KK0098, JP22K04943.

Declaration of interests

The authors report no conflict of interest.

References

Abe, H. & Antonia, R.A. 2011 Scaling of normalized mean energy and scalar dissipation ratios in a turbulent channel flow. Phys. Fluids 25, 055104.CrossRefGoogle Scholar
Ahn, J., Lee, J.H., Lee, J., Kang, J. & Sung, H.J. 2015 Direct numerical simulation of a 30R long turbulent pipe flow at $Re= 3008$. Phys. Fluids 27, 065110.CrossRefGoogle Scholar
Albrecht, H.E., Borys, M., Damascheke, N. & Tropea, C. 2002 Laser Doppler and Phase Doppler Measurement Techniques. Springer.Google Scholar
Baidya, R., Philip, J., Hutchins, N., Monty, J.P. & Marusic, I. 2021 Spanwise velocity statistics in high-Reynolds-number turbulent boundary layers. J. Fluid Mech. 913, A35.CrossRefGoogle Scholar
Chen, X. & Sreenivasan, K.R. 2020 Reynolds number scaling of the peak turbulence intensity in wall flows. J. Fluid Mech. 908, R3.CrossRefGoogle Scholar
Chen, X. & Sreenivasan, K.R. 2022 Law of bounded dissipation and its consequences in turbulent wall flows. J. Fluid Mech. 933, A20.CrossRefGoogle Scholar
Chin, C., Monty, J.P. & Ooi, A. 2014 Reynolds number effects in DNS of pipe flow and comparison with channels and boundary layers. Intl J. Heat Fluid Flow 45, 3340.CrossRefGoogle Scholar
Cho, M., Hwang, Y. & Choi, H. 2018 Scale interactions and spectral energy transfer in turbulent channel flow. J. Fluid Mech. 854, 474504.CrossRefGoogle Scholar
Den Toonder, J.M.J. & Nieuwstadt, F.T.M. 1997 Reynolds number effects in a turbulent pipe flow for low to moderate Re. Phys. Fluids 9, 33983409.CrossRefGoogle Scholar
Durst, F., Jovanović, J. & Sender, J. 1995 LDA measurements in the near-wall region of a turbulent pipe flow. J. Fluid Mech. 295, 305335.CrossRefGoogle Scholar
Fu, M.K., Fan, Y. & Hultmark, M. 2019 Design and validation of a nanoscale cross-wire probe (X-NSTAP). Exp. Fluids 60 (6), 114.CrossRefGoogle Scholar
Furuichi, N., Terao, Y., Wada, Y. & Tsuji, Y. 2015 Friction factor and mean velocity profile for pipe flow at high Reynolds numbers. Phys. Fluids 27, 095108.CrossRefGoogle Scholar
Hultmark, M., Vallikivi, M., Bailey, S.C.C. & Smits, A.J. 2013 Logarithmic scaling of turbulence in smooth- and rough-wall pipe flow. J. Fluid Mech. 728, 376395.CrossRefGoogle Scholar
Kim, J., Moin, P. & Moser, R. 1987 Turbulence statistics in fully developed channel flow at low Reynolds number. J. Fluid Mech. 177, 133166.CrossRefGoogle Scholar
Laufer, J. 1954 The structure of turbulence in fully developed pipe flow. National Advisory Committee for Aeronautics. Tech. Rep., vol. 1174, pp. 417–434.Google Scholar
Lee, M. & Moser, R.D. 2015 Direct numerical simulation of turbulent channel flow up to $Re_\tau =5200$. J. Fluid Mech. 774, 395415.CrossRefGoogle Scholar
Marusic, I., Baars, W.J. & Hutchins, N. 2017 Scaling of the streamwise turbulence intensity in the context of inner-outer interactions in wall turbulence. Phys. Rev. Fluids 2, 100502.CrossRefGoogle Scholar
Marusic, I., Monty, J.P., Hultmark, M. & Smits, A.J. 2013 On the logarithmic region in wall turbulence. J. Fluid Mech. 716, R3.CrossRefGoogle Scholar
Monkewitz, P.A. 2021 The late start of the mean velocity overlap log law at-a generic feature of turbulent wall layers in ducts. J. Fluid Mech. 910, 128.CrossRefGoogle Scholar
Ono, M., Furuichi, N., Kurihara, N., Wada, Y. & Tsuji, Y. 2022 Reynolds number dependence of inner peak turbulence intensity in pipe flow. Phys. Fluids 34, 045103.CrossRefGoogle Scholar
Örlü, R., Fiorini, T., Segalini, A., Bellani, G., Talamelli, A. & Alfredsson, P.H. 2017 Reynolds stress scaling in pipe flow turbulence – first results from CICLoPE. Phil. Trans. R. Soc. A 375, 20160187.CrossRefGoogle ScholarPubMed
Perry, A.E. & Chong, M.S. 1982 On the mechanism of wall turbulence. J. Fluid Mech. 119, 173217.CrossRefGoogle Scholar
Pirozzoli, S., Romero, J., Fatica, M., Verzicco, R. & Orlandi, P. 2021 One-point statistics for turbulent pipe flow up to $Re_\tau \approx 6000$. J. Fluid Mech. 926, A28.CrossRefGoogle Scholar
Pope, S.B. 2000 Turbulent Flows. Cambridge University Press.CrossRefGoogle Scholar
Renard, N. & Deck, S. 2016 A theoretical decomposition of mean skin friction generation into physical phenomena across the boundary layer. J. Fluid Mech. 790, 339367.CrossRefGoogle Scholar
Samie, M., Marusic, I., Hutchins, N., Fu, M.K., Fan, Y., Hultmark, M. & Smits, A.J. 2018 Fully resolved measurements of turbulent boundary layer flows up to $Re_\tau =20\,000$. J. Fluid Mech. 851, 391415.CrossRefGoogle Scholar
Schiavo, L.A.C.A., Wolf, W.R. & Azevedo, J.L.F. 2017 Turbulent kinetic energy budgets in wall bounded flows with pressure gradients and separation. Phys. Fluids 29, 115108.CrossRefGoogle Scholar
Sillero, J.A., Jiménez, J. & Moser, R.D. 2013 One-point statistics for turbulent wall-bounded flows at Reynolds numbers up to $\delta \approx 2000$. Phys. Fluids 25, 105102.CrossRefGoogle Scholar
Sreenivasan, K.R. & Sahay, A. 1997 The persistence of viscous effects in the overlap region, and the mean velocity in turbulent pipe and channel flows. Adv. Fluid Mech. 15, 253270.Google Scholar
Townsend, A.A. 1951 The structure of the turbulent boundary layer. Math. Proc. Camb. Philos. Soc. 47, 375395.CrossRefGoogle Scholar
Townsend, A.A. 1976 The Structure of Turbulent Shear Flow. Cambridge University Press.Google Scholar
Vallikivi, M., Hultmark, M. & Smits, A.J. 2015 Turbulent boundary layer statistics at very high Reynolds number. J. Fluid Mech. 779, 371389.CrossRefGoogle Scholar
Wei, T. 2018 Integral properties of turbulent-kinetic-energy production and dissipation in turbulent wall-bounded flows. J. Fluid Mech. 854, 449473.CrossRefGoogle Scholar
Wei, T. 2020 Scaling of turbulent kinetic energy and dissipation in turbulent wall-bounded flows. Phys. Rev. Fluids 5, 94602.CrossRefGoogle Scholar
Willert, C.E., Soria, J., Stanislas, M., Klinner, J., Amili, O., Eisfelder, M., Cuvier, C., Bellani, G., Fiorini, T. & Talamelli, A. 2017 Near-wall statistics of a turbulent pipe flow at shear Reynolds numbers up to 40 000. J. Fluid Mech. 826, R5.CrossRefGoogle Scholar
Wu, X. & Moin, P. 2008 Direct numerical simulation of turbulence in a nominally zero-pressure-gradient flat plate boundary layer. J. Fluid Mech. 630, 541.CrossRefGoogle Scholar
Yamamoto, Y. & Tsuji, Y. 2018 Numerical evidence of logarithmic regions in channel flow at $Re_\tau =8000$. Phys. Rev. Fluids s 3, 012602(R).CrossRefGoogle Scholar
Yao, J., Rezaeiravesh, S., Schlatter, P. & Hussain, F. 2023 Direct numerical simulation of turbulent pipe flow up to $Re_\tau =5200$. J. Fluid Mech. 956, A18.CrossRefGoogle Scholar
Zhao, R. & Smits, A.J. 2007 Scaling of the wall-normal turbulence component in high-Reynolds-number pipe flow. J. Fluid Mech. 576, 457473.CrossRefGoogle Scholar
Zimmerman, S., et al. 2019 A comparative study of the velocity and vorticity structure in pipes and boundary layers at friction Reynolds numbers up to $10^4$. J. Fluid Mech. 869, 182213.CrossRefGoogle Scholar
Figure 0

Figure 1. (a) Experimental coordinates and measurement points. The red dashed line is the wall-normal axis. The glass pipe is submerged in a water chamber to reduce the reflection of the laser beam. (b) Definition of control length.

Figure 1

Table 1. Control lengths of LDV measurement.

Figure 2

Figure 2. Turbulence intensity profiles for the (a,b) $u$-component, (c,d) $v$-component, (e,f) $w$-component and (g,h) TKE. The blue and orange dashed lines represent data at $Re_\tau =1000$ and 2000 by Chin et al. (2014), and the black solid line indicates $Re_\tau =3000$ by Ahn et al. (2015). The black and brown dashed lines indicate data at $Re_\tau =3000$ and 6000 by Pirozzoli et al. (2021). The channel data are expressed by green and blue alternate long and short dashed lines at $Re_\tau =4000$ and 8000 (Yamamoto & Tsuji 2018). The regions shaded by grey indicate logarithmic region ($y/R=0.055\unicode{x2013}0.25$) and the yellow shaded is the constant region ($y/R=0.020\unicode{x2013}0.10$).

Figure 3

Figure 3. Comparison with other facilities at high Reynolds numbers. Orange diamond and green circle symbols denote data from the present experimental work at $Re_\tau =11\,200$ and 20 750, respectively, which are the same as those in figure 2. The cross symbols ($\times$) denote data from Superpipe by (a) Hultmark et al. (2013) and (b) Fu et al. (2019). Long and short dashed lines in (a) and (b) denote results from CICLOPE by Willert et al. (2017). The green triangle in (c) denotes data from CICLoPE by Zimmerman et al. (2019) for the spanwise component.

Figure 4

Figure 4. Reynolds number dependence of peak turbulence intensities for (a) streamwise component, $P_u$; (b) spanwise component, $P_w$; and (c) TKE component, $P_k$; $\blacktriangle$ (black) present; $\blacktriangle$ (blue) DNS data by Pirozzoli et al. (2021); $\blacktriangle$ (orange), Yao et al. (2023). The grey symbols $\blacktriangle$ (grey) are the results obtained by extrapolating the unmeasured $v$- and $w$-component values from the other Reynolds number results. The dashed lines indicate the logarithmic law, $P_u= 3.0+0.72 \ln (Re_\tau )$, $P_w=0.10+0.30 \ln (Re_\tau )$, $P_k=1.4+0.52 \ln (Re_\tau )$. The solid lines indicate the asymptotic law (Chen & Sreenivasan 2020), $P_u =11.5\unicode{x2013}19.3Re_\tau ^{-1/4}$, $P_w=3.9\unicode{x2013}10.2Re_\tau ^{-1/4}$, $P_k =7.7\unicode{x2013}15.5Re_\tau ^{-1/4}$. The constants for both lines are obtained by the fitting to the present data.

Figure 5

Figure 5. The Reynolds number dependence of $k^+_{bulk}$ integrated from $y/R=0.0043$ to centre. The error bars indicate the uncertainty due to the calculation without data in $y/R<0.0043$. The solid line indicates the $Re_\tau ^{-1/4}$ asymptotic laws proposed by Chen & Sreenivasan (2020), $k^+_{bulk}=11\unicode{x2013}15.7Re_\tau ^{-1/4}$. The dashed line indicates the logarithmic law, $k^+_{bulk}=4.8+0.51 \ln (Re_\tau )$. The constants for both lines are obtained by the fitting to the present data.

Figure 6

Figure 6. (a,b) The profile of the contribution ratio for each velocity component to TKE. Symbols are the same as in figure 2. The red bar indicates the region of constant contribution ratio ($100< y^+ <1000$), and the blue bar indicates the logarithmic region of mean velocity at $Re_\tau =20\,750$ ($430< y^+ <3100$). (ch) The contour maps of the contribution profiles for each component: (a,c,e,g) scaled by inner variable $y^+$, (b,d,f,h) scaled by outer variable $y/R$.