INTRODUCTION
Dengue fever (DF), dengue haemorrhagic fever (DHF) and dengue shock syndrome (DSS) are acute febrile diseases with a combined incidence of 20 million cases and 24 000 deaths in the past four decades [1]. These diseases are caused by dengue viruses, which belong to the genus Flavivirus, family Flaviviridae, with the main vector being the domestic mosquito with anthropophilic feeding habits, Aedes aegypti. Outbreaks of the disease often occur in South East Asian and Latin American countries, the Caribbean and West Pacific islands, and northern Australia [Reference Gubler and Trent2]. Environmental factors related to the spread of these diseases have been documented by studies done in Mexico, Puerto Rico and Taiwan, mostly following a case-control study design [Reference Lorono3–Reference Rodriguez6].
Using a computerized geographic information system is a new approach for both analysing the disease incidence and identifying disease-related risk factors [Reference Charles, Sperling and Broome7]. Disease incidence displayed by point data in a particular area may be misleading as it often ignores the size of a population in that area.
In Thailand the urban areas throughout the country are divided into enumeration district (ED) blocks, each with an approximately equal population size. In 1998 an outbreak of DF/DHF occurred in the Songkhla municipality, Southern Thailand. The current analysis was conducted using reliable surveillance systems for DF/DHF, and also explored the feasibility of using the ED blocks for geographic information purposes. The objectives of this study were to analyse the spatial pattern of DF/DHF incidence at the ED block level, and to test the hypothesis that ED block characteristics affected the incidence of the disease.
METHODS
Study area
Songkhla municipality is located 7° 12′ N, 100° 36′ E on the east coast of Southern Thailand, ~1000 km south of Bangkok. The municipality covers 9·3 km2 and lies on a small peninsula. Two large water bodies, Songkhla Lake and the Gulf of Thailand lie to the west and east of the town respectively. There were 20 745 households with a population of 60 127 in the year of study. The main occupations of the population include trading, fishing and government service. The municipality is divided into 146 ED blocks each containing about 140 houses and 400 residents. The average area of each block is 63 787 m2 with individual blocks ranging from 6517 to 1 710 000 m2. On the northern and eastern coasts, the blocks are large but have low population densities because they are occupied by the beach, government offices, a school and an airport. The central and western blocks, however, are densely populated by businesses involved in the fishing trade (western) and various other types of trading (central). Within the municipality there is one general hospital containing 600 beds, where the most serious DHF cases in the municipality are admitted (the next closest hospital being 30 km away).
The disease surveillance system
In all hospitals in Thailand, doctors undertaking care of paediatric patients are regularly updated on case management for DH, DHF and DSS patients. Definitions of suspected, clinically diagnosed and serologically confirmed cases follow the World Health Organisation criteria (WHO) [8]. Reports of clinically diagnosed cases of DF, DHF and DSS are compiled weekly at each hospital using a standard form containing essential patient information. These are then sent to the Provincial Health Offices who undertake local control measures and subsequently forward the information to the Epidemiology Department in Bangkok [Reference Chareonsook9].
Data collection
A map of the ED blocks, together with data on population, children in each age group and location of the houses in each block were obtained from the National Statistics Office (NSO), which had conducted a population census survey in 1997.
All the ED blocks in Songkhla municipality were examined between June and September 1998. Approximately 10% of all the houses in each block were selected for the study using simple random sampling methods. Ten staff from the Region Four Vector-Borne Disease Control Office, Songkhla, were given training and then deployed to observe and record housing data, which included: housing type, construction material, presence of water drainage, availability of window screens and waste disposal. Larval inspection was completed both in the house and within a radius of 5 m surrounding the dwelling. The number of containers with Aedes larvae in each house was compiled to determine the Breteau index (number of containers with larvae/100 houses). Each variable was summarized into a percentage for each block.
Using the WHO criteria, reported DF/DHF cases (including DSS) in Songkhla municipality from January to December 1998 were traced back to the hospital registration for a medical record review in order to verify case diagnosis [8]. Only verified cases were used in this study and their addresses were confirmed and mapped onto the NSO map, which provided precise locations for the houses.
Mapping
The Arc Info version 8.1 package (ESRI, Redlands, CA, USA) was used to digitize the map on which the ED blocks were demarcated. Individual house locations of DF/DHF cases were plotted on the map (Fig. 1). Annual DF/DHF incidence attributes were then linked to the blocks. For each block, the magnitude of DF/DHF was shown on the map as a solid circle with a diameter proportional to the incidence density (per 1000 per year) (Fig. 2). Attributes relating to the percentage housing per block were shown as gradation of shading (Figs 3, 4).
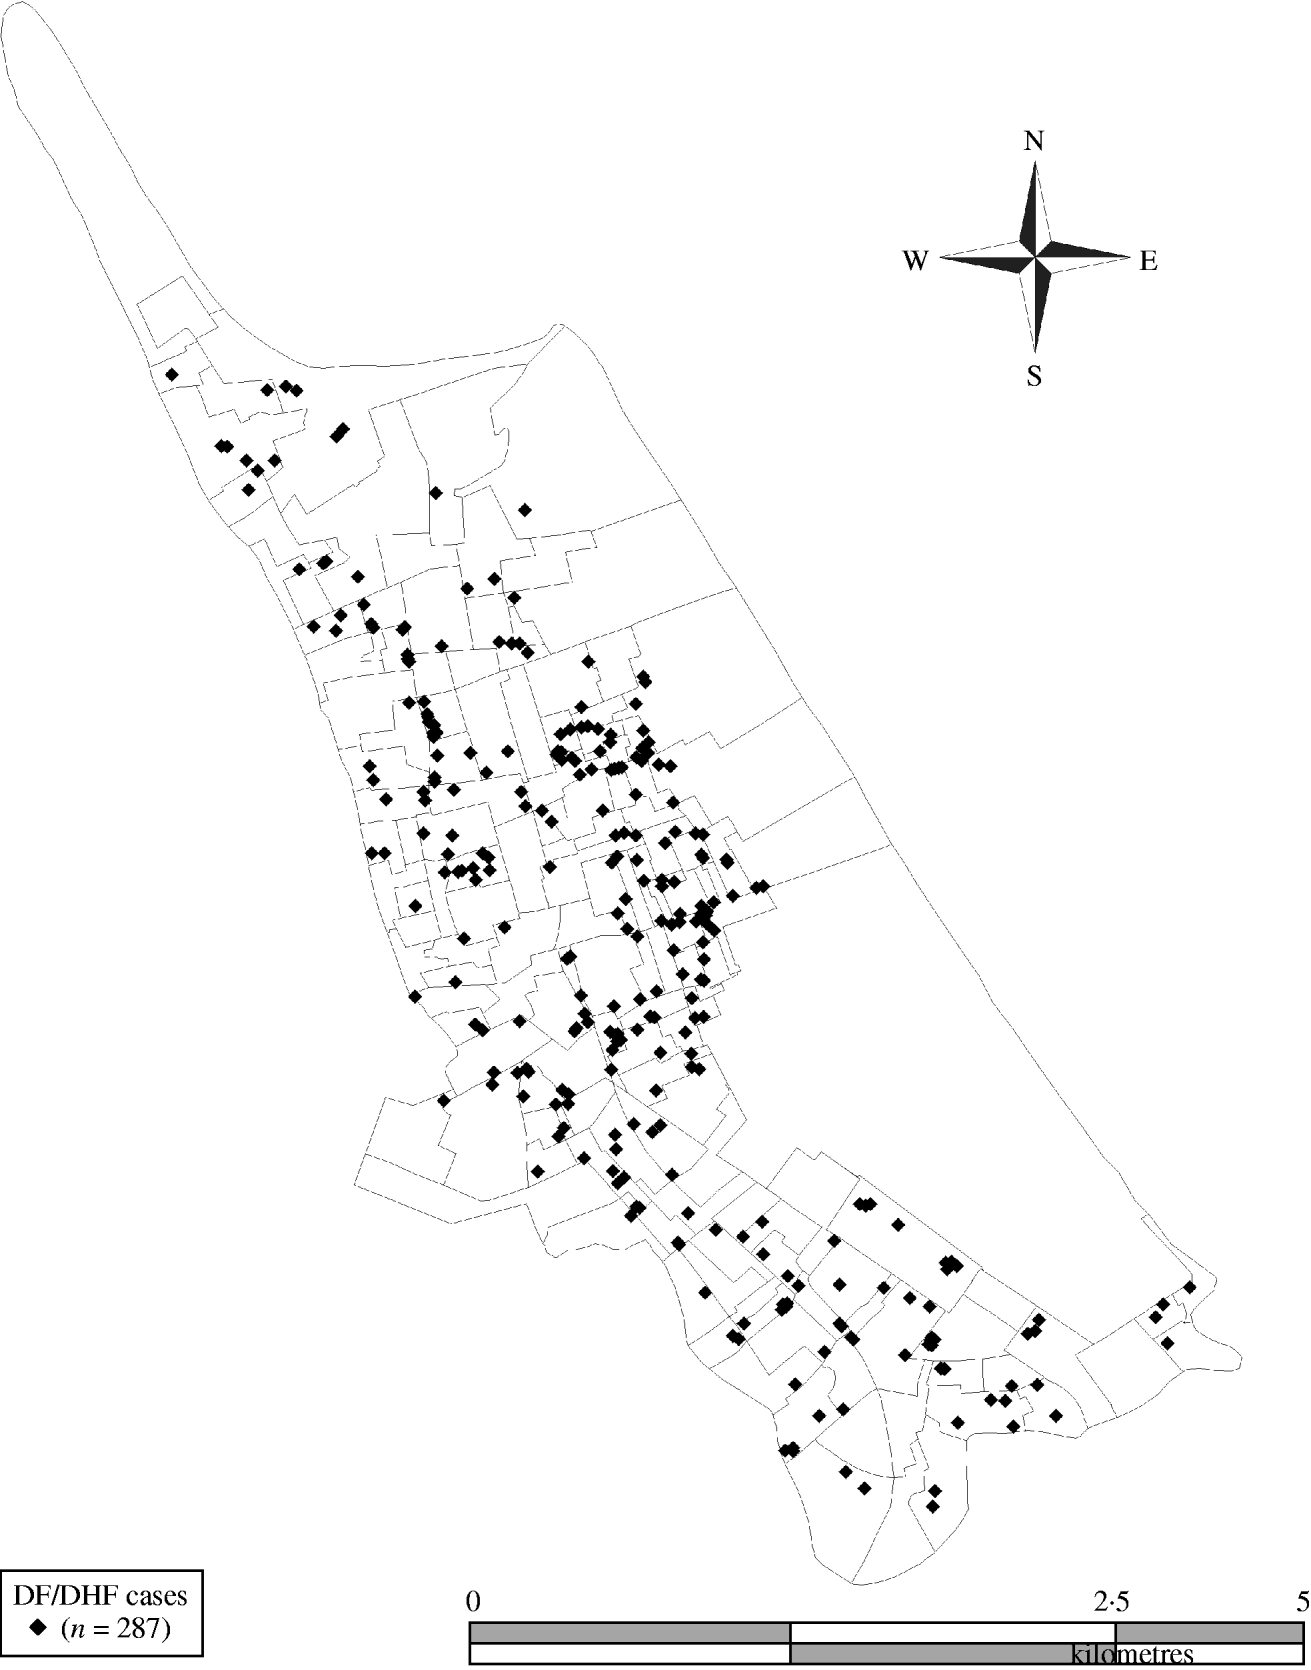
Fig. 1. Distribution of DF/DHF cases in Songkhla municipality (nearest-neighbour analysis Z=–8·03, P<0·0001).
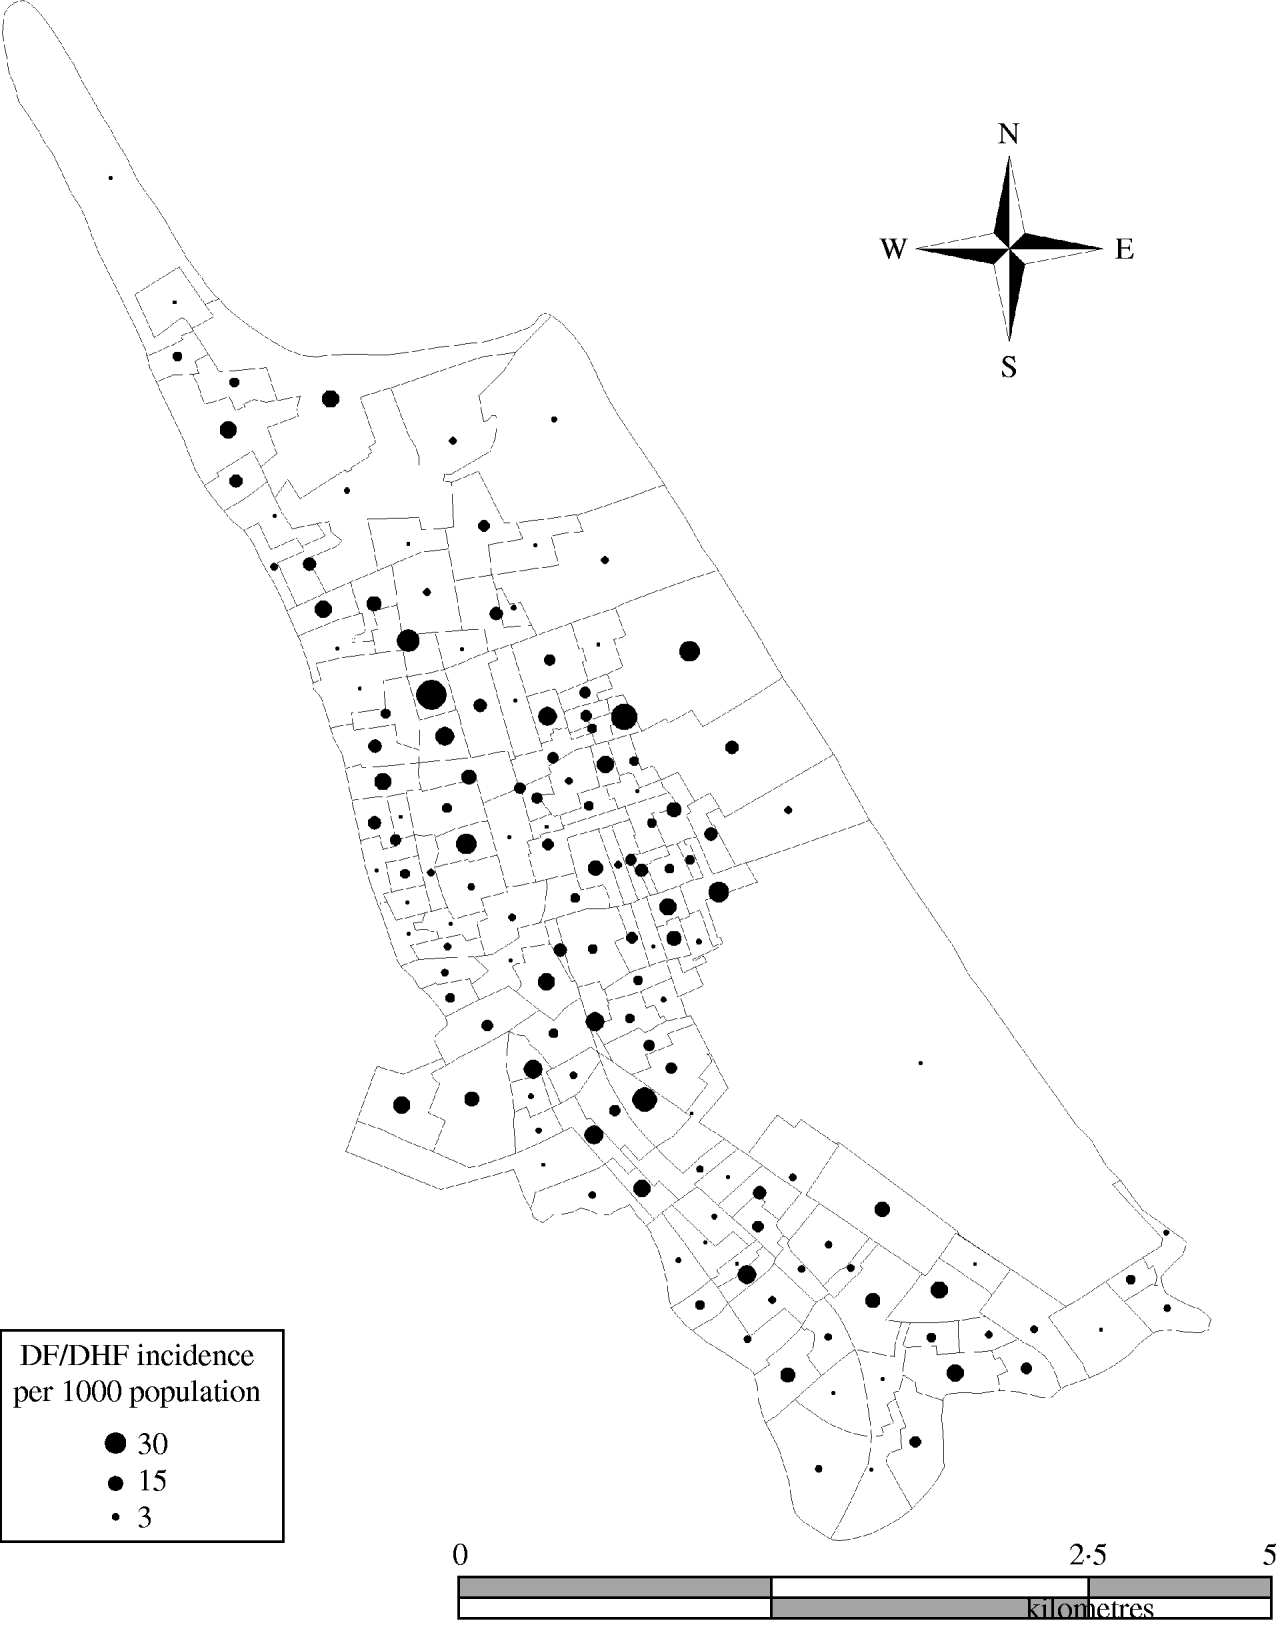
Fig. 2. DF/DHF incidence/1000 population in Songkhla municipality (Moran's I=0·01, P=0·32).
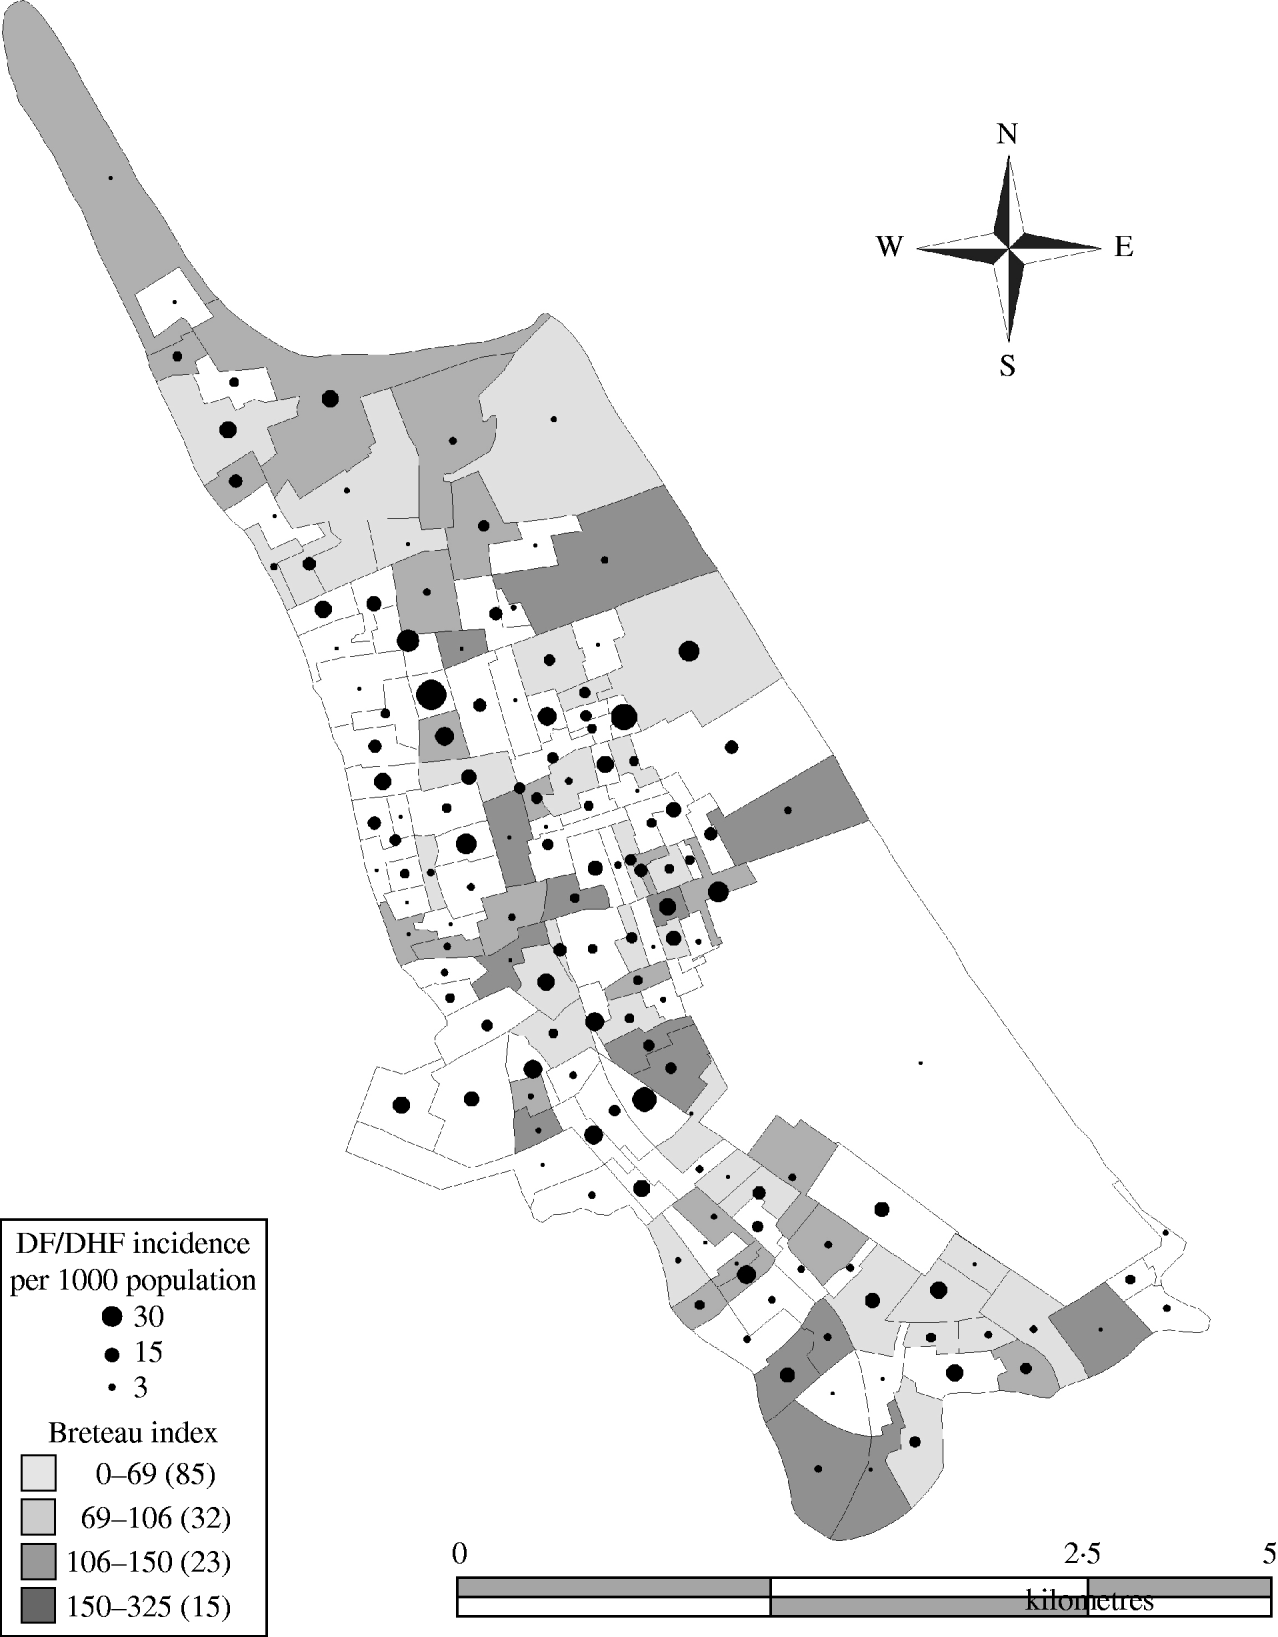
Fig. 3. DF/DHF incidence/1000 population and the Breteau index in Songkhla municipality (r=–0·17, P=0·03).
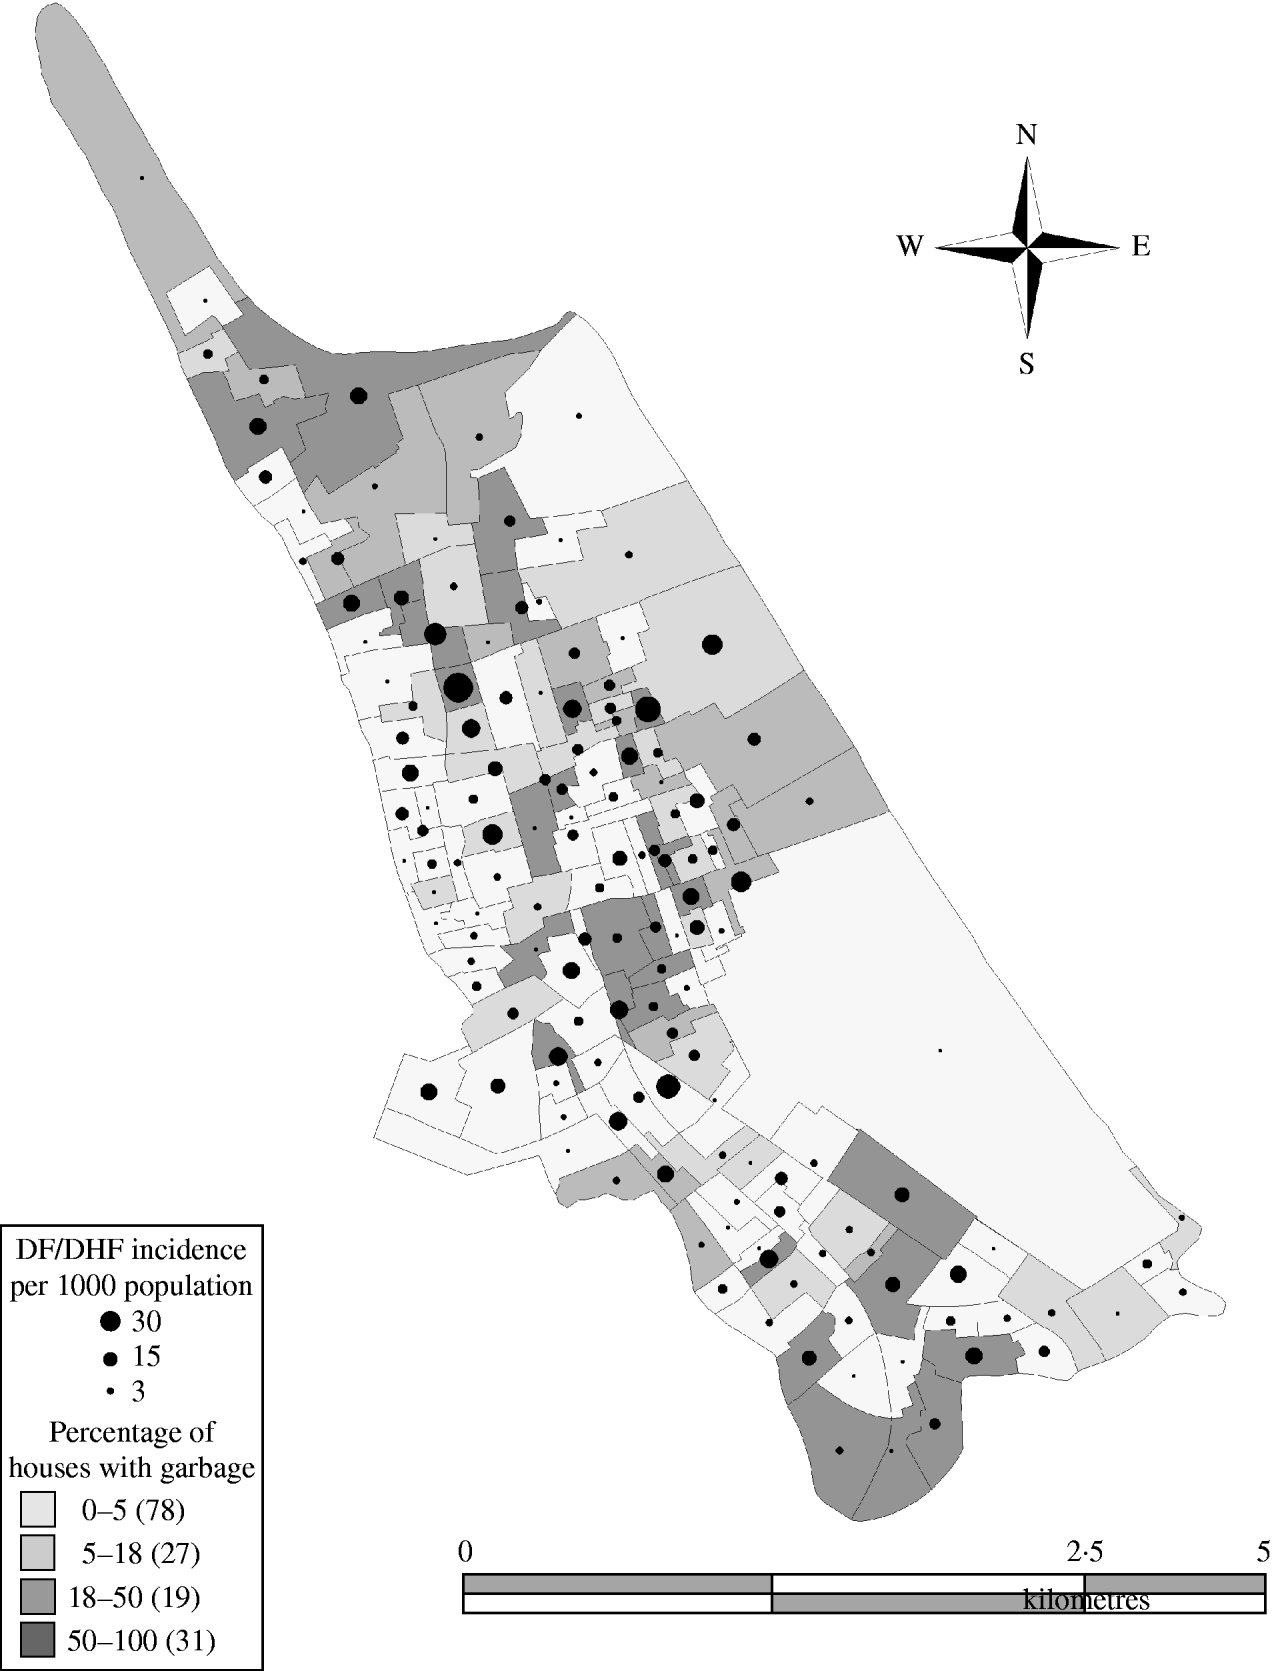
Fig. 4. DF/DHF incidence/1000 population and percentage of houses with garbage in Songkhla municipality (r=0·43, P=0·001).
Spatial autocorrelation analysis
A spatial autocorrelation statistic was applied to determine the degree of association between variables of points or blocks and their adjacent points or blocks. The point and areal data were analysed by the methods shown in the Appendix.
Statistical analysis
Both the incidence and housing attributes were displayed by superimposing the two parameters onto maps and then their correlation was assessed using Pearson's correlation coefficient. At the same time, the incidence was broken down by quartiles of percentage of housing attributes to explore possible dose–response relationships. The variables having statistically significant correlation with DF/DHF incidence were further tested using multiple negative binomial regression [Reference Rogriguez10]. The best model was selected based on backward elimination, sequentially removing each variable that made a non-significant reduction to the log likelihood. This process of backward elimination was continued until all independent variables remaining in the model could not be removed without significant reduction in the log likelihood. stata version 7 [11] was used for statistical analysis.
RESULTS
Distribution of cases and ED block incidence of DF/DHF
There were 287 reported cases all of which fulfilled the WHO criteria. The average number of DF/DHF cases per ED block was 1·95 (range 0–8). The average block incidence was 5·13±5·05/1000 head of population per year. Blocks with a high incidence of DF/DHF were found mainly in the central part of Songkhla town recording a maximum incidence of 30·6/1000 head of population per year in the market and trading areas. The blocks along the eastern coast had a rather low incidence (Figs 1 and 2). Nearest-neighbour analysis of the data shown in Figure 1 gave a Z value of −8·03 (P<0·0001), indicating significant point clustering but the global Moran's I figure was low (I=0·01, P=0·32) indicating there was no clustering of block incidence (Fig. 2).
Housing factors vs. block incidence of DF/DHF
The total number of houses visited was 1996. The overall percentages of ‘inhabited’ shop-houses, single houses, buildings and slums were 39, 37, 3, and 5·4%, respectively and 15·6% were empty. The proportions of houses made of bricks, a mixture of brick and wood, wood, corrugated iron and others materials were 42, 28, 24, 3 and 2%, respectively. Twenty two percent of the houses had refuse piled outside and scattered around the sites. Fifty-one percent of all the houses visited had window screens.
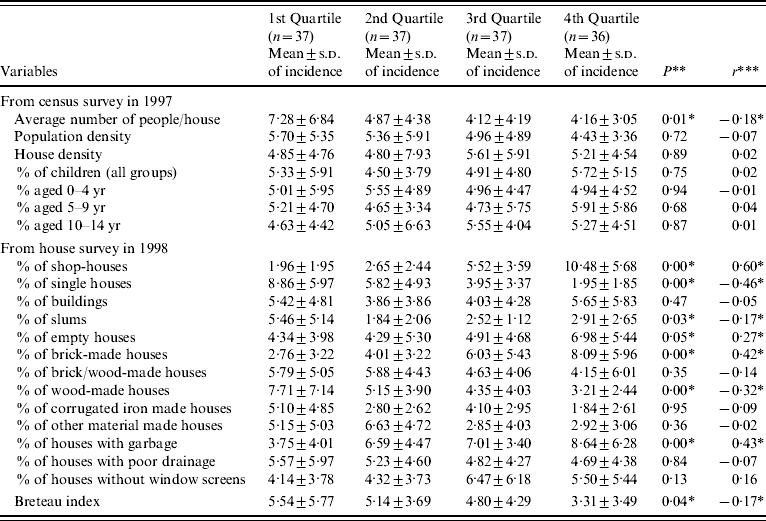
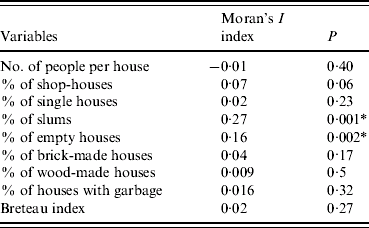
DF/DHF incidence per block had a positive correlation with the percentages of shop-houses, empty houses, brick-made houses and houses with poor garbage disposal and had a negative correlation with the average number of people per house, percentages of single houses, slum dwellings, wood-made houses and the Breteau index as shown in Table 1. There was a low negative correlation between the DF/DHF incidence and the Breteau index as shown in Figure 3 whereas the percentage of houses with poor garbage disposal was positively associated with DF/DHF incidence (Fig. 4). The potential housing risk factors showed no significant clustering except slum dwellings and empty houses (Table 2). The best model for predicting DF/DHF incidence contained only a percentage of shop-houses, brick-made houses and houses with poor garbage disposal (Table 3).
Table 1. The trend of mean±standard deviation of DF/DHF incidence/1000 population of the 1st–4th quartile of block housing attributes and the Pearson correlation coefficient of each variable to DF/DHF incidence
* P⩽0·05, ** ANOVA test, *** Pearson correlation coefficient.
Table 2. Moran's I value of block characteristics (those found to be significant in Table 1)
* P<0·01.
Table 3. The best model to predict DF/DHF incidence in Songkhla municipality using negative binomial regression

DISCUSSION
In this study we found no demonstration of block incidence clustering with the strong environmental predictors of housing pattern and the presence of garbage surrounding the house.
Although the nearest-neighbour analysis suggested point clustering of cases this may not in fact be a true clustering because higher densities of habitations and population would tend to produce a higher number of cases. The incidence of block clustering using Global Moran's I statistic gave statistically non-significant results. But this method is a more valid result because the block incidence was adjusted by population for each block. It is possible that the incidence of ED block clustering was not statistically significant in this study for some or all of the following reasons. First, risk factors such as those relating to the Breteau index, shop-houses, brick-made houses and houses with poor garbage disposal were found to have no clustering. Second, in this small business city the population is relatively mobile and the children frequently wander freely from house to house, thus the exposure to the infective mosquitoes can be quite homogeneous. Third, the incidence within each block might not be high enough to demonstrate any significant correlation. Thus, it would be more effective to test the hypothesis of housing factors on a larger scale. For example, in the future using a district as the study unit instead of an ED block would give a better overall statistic.
The statistics indicate that the pattern and structure of housing are major risk factors. The majority of shop-houses are interconnected, with their windows and doors open throughout the daytime, and inside each house there is usually no air-tight separation between adjacent rooms. As a result this allows the adult mosquitoes to travel relatively freely between houses and also from room to room. Moreover, window screens might not be an effective barrier to the ingress of mosquitoes, as having window screens had no correlation with the incidence of the disease. Houses constructed with bricks and concrete have a lower internal temperature and a higher humidity, which can attract the adult mosquitoes to rest and feed on the blood of residents [Reference Zeev, Maibach and Khan12]. Garbage disposal near a house was associated with a high incidence of DF/DHF. This was consistent with results obtained from other studies conducted using the case-control design [Reference Chen, Hwang and Guo13–Reference Hayes16].
Usually dengue incidence is expected to increase in areas with a high Breteau index. However, in our study the Breteau index had a negative correlation with the incidence in the crude analysis and this significance disappeared in the multivariate analysis. This might be explained by the fact that the data for the Breteau index were collected in the middle of the year when areas with a DF/DHF outbreak might be implementing more intensive control activities than those of the non-outbreak areas.
All the cases used in our study were clinically verified but no information on serology was available. Previous studies have shown that the WHO criteria have both a high sensitivity (96·8%) and specificity (90–100%) compared with serological information [Reference Teeraratkul17, Reference Kalayanarooj, Chansiriwongs and Nimmannitya18]. Thus, errors with diagnosis were unlikely to be a major problem in our study. However, it has been found that the proportion of symptomatic cases in some studies varied from 3% to 13% of the total infected cases in a community [Reference Burke19, Reference Tuntaprasart20].
In conclusion, the risk of DF/DHF is quite geographically homogenous, therefore control activities should be carried out over the whole area. The areas with a high population density living in shop-houses and brick-made houses will need special attention. Garbage littered around the houses needs proper waste disposal management. This important information should be disseminated to all concerned parties.
ACKNOWLEDGEMENTS
We thank the following people for their valuable contributions to this paper. First, to the staff of the Region Four Vector-Borne Disease Control Office, Songkhla, for their assistance in carrying out the house survey. To Professor Don McNeil, Macquarie University, Australia, Professor Peter A. Rogerson and Dr Goufa Zhou, University at Buffalo, USA, for their suggestions for the spatial analysis. Finally to Miss Apiradee Lim and Edward McNeil in the Epidemiology Unit, Prince of Songkla University for their assistance with data management and editing of the manuscript, respectively. This study was financially supported by the WHO (SEARO) grant no. SE/99/074416 and by the Epidemiology Unit, Faculty of Medicine, Prince of Songkla University.
APPENDIX
Point pattern analysis
The nearest-neighbour statistic [Reference Rogerson21] was used to analyse the spatial patterns of x and y coordinates of the houses with DF/DHF cases, using a Z score to identify their spatial pattern or randomness. The Z score was calculated as follows:
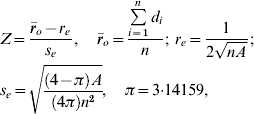
where &rmacr; o is the mean observed distance between each point (the house coordinates of a DF/DHF case) and its nearest-neighbour's points (the coordinates of the nearest cases' houses). r e and s e are the expected value and standard deviation associated with distances between points and their nearest-neighbour points from any random set of points. d i is the distance from point i to its nearest neighbour, while n is the number of houses with DF/DHF cases and A is the size of the study area. Z scores of −1·96 or lower suggests that the null hypothesis of spatial randomness should be rejected and that there is a statistically significant clustering of points whereas a Z score of 1·96 or higher indicates a dispersion of points. Z scores between −1·96 and 1·96 suggest that the points are distributed randomly.
Areal data analysis
The spatial pattern analysis of the DF/DHF incidence rates in each block was made by the use of Moran's I index. The Global Moran's I [Reference Oden22] was applied to determine the global clustering of ED block incidence (the centroid of each blocks), and calculated as follows:

where y i is the incidence of the index block, y j is the incidence of adjacent blocks, &ymacr; is the average block incidence, n is the number of blocks, and w ij is the weighting factor that defines the spatial relationship between blocks i and j. The simplest weight matrix is the nearest-neighbourhood weight, i.e. w ij=1 if blocks i and j are adjacent and 0 if they are not.
Moran's I value behaves similarly to a correlation coefficient, ranging from −1 to 1. Negative, zero and positive values indicate alternating, random and clustering patterns, respectively.
Software for spatial analysis
MapInfo Professional version 6.5 [Reference MapInfo23] software was used to create incidence maps and to demonstrate the distribution pattern of related block characteristics and the incidence of DF/DHF (Figs 1–4). Point Pattern Analysis (PPA) [Reference Chen and Getis24] was used for nearest-neighbour analysis. GeoDa version 0.95i software [Reference Anselin25] was used to test for clustering using Moran's I.
DECLARATION OF INTEREST
None.


