INTRODUCTION
The World Health Organization (WHO) ranks diarrhoeal diseases fifth in the world's top causes of mortality and responsible for 2·2 million deaths worldwide [1]. Furthermore, within low-income countries, diarrhoeal diseases rank third, illustrating the large burden of acute gastrointestinal illnesses (GI) to the global population, particularly in developing countries. Clean water, sanitation, and food safety are key components to preventing and controlling GI in the population [Reference Kaferstein2]. These public health areas remain priorities for international public health organizations and public health workers [Reference Schlundt3–Reference Flint6]. Accurately determining the burden of GI is important for its mitigation [Reference Jones7]. However, GI cases tend to be underreported by traditional surveillance techniques, which require cases to seek medical attention in order to be captured. To address this, numerous countries have conducted population-based studies to better estimate the disease burden [Reference Jones7–Reference Herikstad18]. With population-level baseline information, interventions, targeted surveillance and research activities can be implemented and evaluated. However, there are still unresolved methodological issues within population-based studies, including recall period selection and recall bias [Reference Wheeler17, Reference Boland19, Reference Rodrigues20].
In 2008, a partnership of the Pan-American Health Organization, the Public Health Agency of Canada, the University of Guelph, and the Ministry of Health in Chile completed the first population burden of GI study in the Metropolitan region of Chile. The objectives of this study were to determine the magnitude and distribution of GI in the population, describe the burden and clinical presentation of GI, and identify risk factors associated with GI. An additional objective was to assess the differences between a 7-day, 15-day and a 30-day recall period in the population-based burden-of-illness study design.
METHODS
Population baseline study
A cross-sectional, door-to-door survey of randomly selected residents of the Metropolitan region of Chile was administered 21 July–25 August 2008 (phase 1: low GI season) and 14 November–21 December 2008 (phase 2: high GI season). The Metropolitan region of Chile was selected as it is a diverse region consisting of 6 061 185 residents which account for 40·1% of the total population of Chile. ‘High’ and ‘low’ GI season designation was based on data from the Ministry of Health surveillance system on reported GI cases and outbreaks related to food and water.
The Metropolitan region is divided into 52 neighbourhoods which are further divided into districts, zones and blocks. Neighbourhoods are classified by the Instituto Nacional de Estadisticas (www.ine.cl) into five categories according to socio-economic level. The number of surveys administered per socio-economic category, was selected proportional to population size per category. Three neighbourhoods were excluded from the sample due to concerns for surveyor safety. Blocks were randomly selected proportional to the number of households in each block. SAS version 9.1 (SAS Institute Inc., USA) was used to conduct the proportional random selection. Households were conveniently selected from within the randomly selected block at the discretion of the surveyor in the field.
Face-to-face interviews were conducted by trained surveyors from the region. The individual in the household with the next birthday was selected to participate in the survey. If the selected individual declined or no one lived at the residence, the neighbouring house was selected as the replacement. If the selected individual was aged <12 years, the parent or guardian answered the survey on their behalf. If the selected individual was between the ages of 12 and 18 years, the parent, guardian or child answered the survey at the discretion of the parent or guardian. All surveys were administered in Spanish.
Sample size
Sample sizes were calculated using Epi Info 3.4.1 (Centers for Disease Control and Prevention, USA). Using an expected monthly prevalence of 8%, a 1% allowable error and a 95% confidence interval, a target sample size of 2826 was calculated, which was rounded to 3000 surveys per phase for an overall total sample size of 6000 surveys.
Data gathering
The survey tool (available from the author upon request) was developed by modifying the survey tools used previously in Argentina [Reference Thomas21] and using other similar cross-sectional population burden of GI studies as models [Reference Jones7, Reference Aguiar Prieto9, Reference Imhoff11, Reference Majowicz13–Reference Thomas16]. Respondents were asked if they had experienced any symptoms of diarrhoea or vomiting in the previous 7, 15 and 30 days, where diarrhoea was defined as ⩾3 loose stools in 24 h. Individuals who suffered chronic diarrhoea or diarrhoea caused by use of medications, laxatives, alcohol or medical conditions, were considered non-cases. Additional questions asked about sociodemographic factors, secondary symptoms, number of days absent from school or work, whether hospitalization was required and potential risk factors.
Ethics
The study was approved by the Human Subjects Committee of the University of Guelph Research Ethics Board (Guelph, Ontario, Canada) and by the Servicio de Salud Metropolitano Oriente Scientific Ethics Committee of the Government of Chile. Signed, informed consent was obtained from all participants or the parent/guardian in the event the participant was a minor.
Statistics
Data were manually entered into Epi Info 3.4.1 and managed using Microsoft Access. Analysis was performed using SAS 9.1. Individuals responding ‘don't know’ or ‘unsure’ were excluded from the analysis of that question. Whether cases had used antibiotics in the 4 weeks prior to illness was compared to whether non-cases had used antibiotics in the 4 weeks prior to interview to assess impact of recent antibiotic use.
The primary outcome measures of weekly, 15-day and monthly prevalence were defined as the number of respondents reporting GI in the previous 7, 15 or 30 days, respectively, divided by the total number of respondents. Prevalence, incidence rate and incidence proportion calculations [Reference Rothman and Greenland22] were performed for all three recall periods; the formulas are given in Appendix 1.
Analysis was performed on the total dataset using monthly cases as the outcome. The null hypothesis of no association between presence of GI and individual potential risk factors was tested using Fisher's exact test or the Monte Carlo estimation of Fisher's exact test in SAS. A multivariable logistic regression model was built manually using backwards elimination. Only variables with P<0·05 (Wald's test) were kept in the final model. All variables that were initially screened out of the final model were re-introduced to test for significance and visually assess confounding. Confounding was determined by looking for a change of ⩾30% in model coefficients. All possible interactions between variables in the final model were assessed at P<0·05 (Wald's test). The Hosmer–Lemeshow test in SAS was used to assess goodness of fit of the model, where a significant P value (P<0·05) indicates poor fit of the model. Differences between medians were tested using the Median test in SAS.
Recently Majowicz et al. [Reference Majowicz23] proposed a standard symptom-based case definition for GI of ⩾3 loose stools or any vomiting in 24 h excluding those (a) with cancer of the bowel, irritable bowel syndrome, Crohn's disease, ulcerative colitis, cystic fibrosis, celiac disease, or any other chronic illness with symptoms of diarrhoea or vomiting, or (b) who report their symptoms were due to drugs, alcohol or pregnancy. We calculated the minimum set of results, and report them here to facilitate future international comparisons.
Recall period comparison
There is no proper statistical test available to compare annual estimates generated from different recall periods as we did here. Thus, we used two approaches: (a) comparing 95% confidence intervals (CI) of the annual incidence rate and proportion estimates generated from the three different recall periods, 7 days, 15 days, and 30 days, and (b) a simple binomial test as described below. To compare the 15- and 30-day recall periods to the 7-day recall period, the observed number of GI cases of a recall period was tested by conducting a simple binomial test using as the expected probability the prevalence of the 7-day recall (fixed). P values for the tests were computed by using the probbnml function of SAS 9.1 (P<0·05 indicates a significant result). The expected probability of a case for the 15- and 30-day recall periods was calculated using the formula shown in Appendix 2, assuming that the probability of being a GI case in the 15- and 30-day recall periods was 2·14 and 4·29 times greater than the probability in the 7-day recall period, respectively. By fixing the 7-day results as the referent, we are ignoring the fact that the observed number of cases is a random variable (even holding the number of surveys fixed) and that there is dependence between the 7-day result and each of the 15- and 30-day results.
RESULTS
Burden and case description
In total, 6047 surveys were completed, 3033 in phase 1 and 3014 in phase 2, with an overall average response rate of 75·8%. The demographic distribution of residents of the Metropolitan region, along with survey respondents and monthly cases is illustrated in Table 1. In general, survey respondents were older, more educated and more likely to be female than residents. Overall, cases were significantly younger than non-cases with median ages of 33 and 39 years, respectively (P<0·001).
Table 1. Sociodemographic distribution of Metropolitan region residents, survey respondents and monthly prevalence of acute gastrointestinal illness by category, Chile, 2008
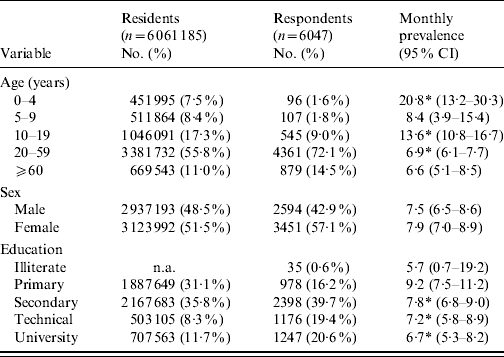
CI, confidence interval; n.a., not available.
* Proportion per category significantly different to all other categories combined (P<0·05).
Of the 6047 respondents, in total 467 (7·7%, 95% CI 7·1–8·4), 384 (6·4%, 95% CI 5·8–7·0) and 262 (4·3%, 95% CI 3·8–4·9) had symptoms of vomiting or diarrhoea in the 30, 15, and 7 days prior to interview, respectively (Table 2). The overall age-adjusted monthly prevalence was 9·2%.
Table 2. Number of cases by gastrointestinal illness symptom, prevalence, annual incidence rate and annual incidence proportion, by recall period and phase, Metropolitan region, Chile, 2008

Symptoms and severity
The majority of monthly cases suffered symptoms of ‘only vomiting’ followed by those with ‘only diarrhoea’ in phase 1, while the reverse was seen in phase 2 with the number of cases experiencing ‘only diarrhoea’ being greater than the number of cases with ‘only vomiting’ (Table 2). Symptoms of ‘both diarrhoea and vomiting’ peaked in cases aged 0–4 years, while symptoms of ‘only diarrhoea’ and ‘only vomiting’ peaked in cases aged 10–19 years (Fig. 1).
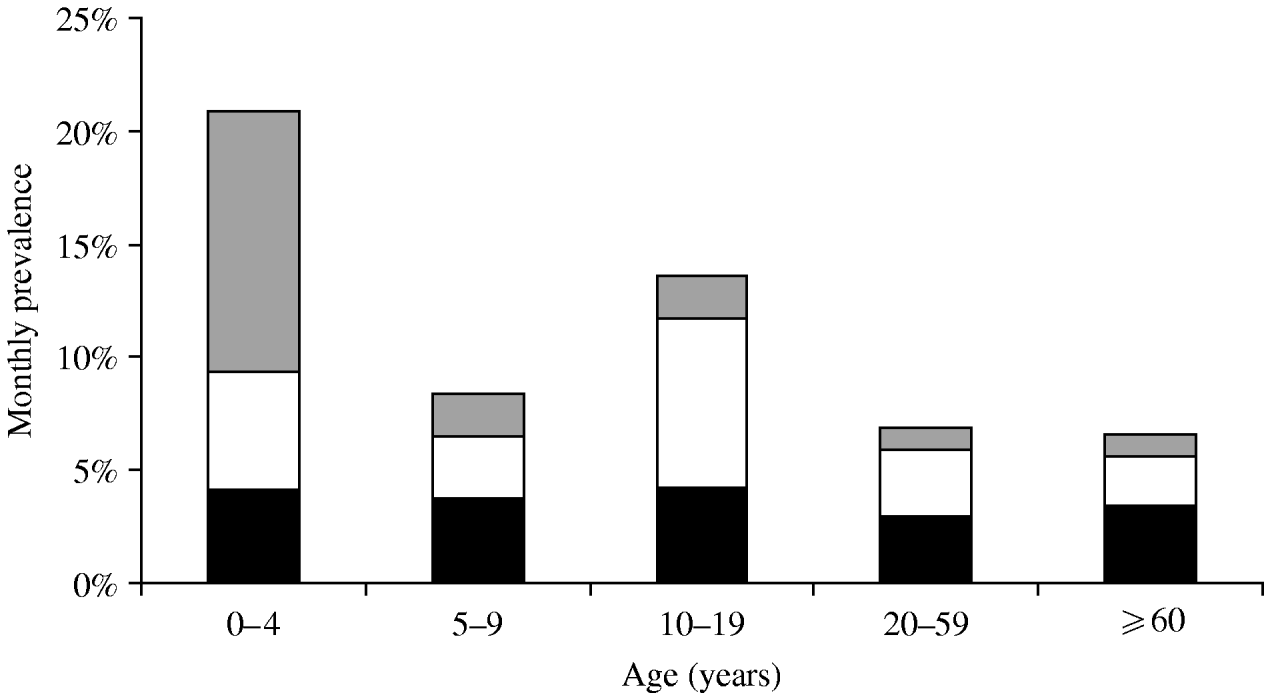
Fig. 1. Monthly prevalence of gastrointestinal illness by symptoms and age group, Metropolitan region, Chile, 2008. ![]() , Vomiting and diarrhoea; □, vomiting only; ▪, diarrhoea only.
, Vomiting and diarrhoea; □, vomiting only; ▪, diarrhoea only.
Of the 467 monthly cases, 110 (23·6%) had more than one episode of diarrhoea and 78 (14·3%) had more than one episode of vomiting in the 30 days prior to interview. Of the 292 cases that experienced diarrhoea, 11 (3·8%) had bloody diarrhoea. On the day of interview, 43 cases had diarrhoea and 20 cases had vomiting.
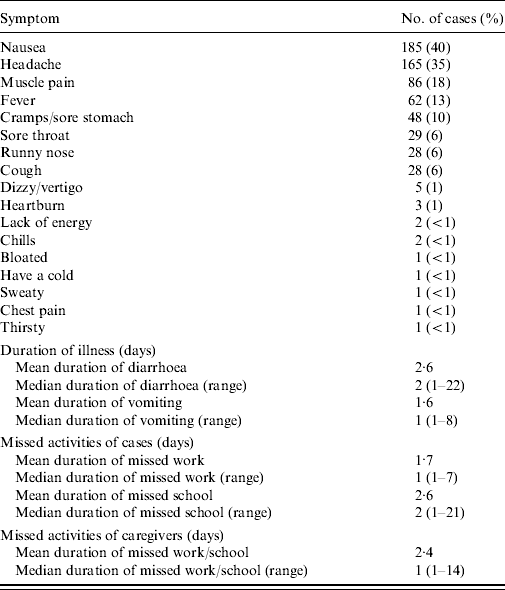
The most commonly experienced secondary symptoms were headache, nausea and muscle pain (Table 3). As a result of their illness 74 and 46 cases were absent from work or school, respectively, and 25 cases required someone else to miss work or school in order to provide care. Overall the median duration of diarrhoea and vomiting were 2 days and 1 day, respectively. Cases reported the maximum number of diarrhoeal events to be an average of 4·4 loose stools (range 3–20) and a maximum number of vomiting events to be an average of 3·0 (range 1–20) in a 24-h period.
Table 3. Number and percent of cases (n=467) by secondary symptoms, duration of gastrointestinal symptoms and duration of missed activities due to gastrointestinal illness, Metropolitan region, Chile, 2008
Medical system use
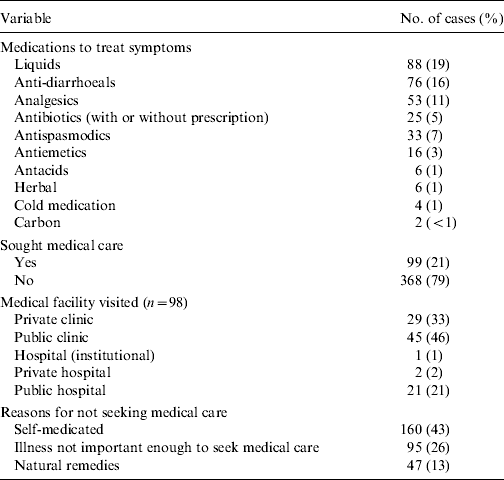
Medications used by cases to treat symptoms, medical facilities visited by cases and reasons for not seeking medical care are reported in Table 4. Liquids, anti-diarrhoeals and analgesics were the top choices for medications used by cases. Of those cases that sought medical care (n=99), public clinics, private clinics and public hospitals were the most frequently visited. Only one case required hospitalization for their illness for a total of 24 h. In total 11 (11%) cases were asked to submit a sample of which nine (82%) complied. Of the nine samples submitted only two cases knew that their test results were negative and the rest did not know the result. ‘Self-medicating’ and ‘not thinking the illness important’ were the most common reasons for not seeking medical care.
Table 4. Number and percent of cases (n=467) by treatments, use of medical care and reasons for not seeking medical care by gastrointestinal illness cases, Metropolitan region, Chile, 2008
Univariable and multivariable analysis
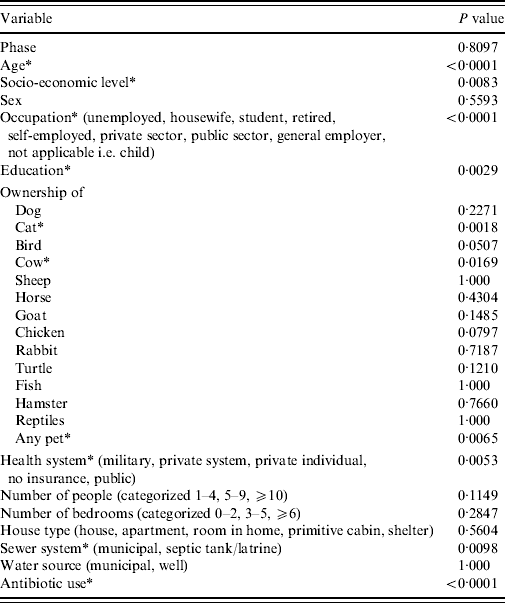
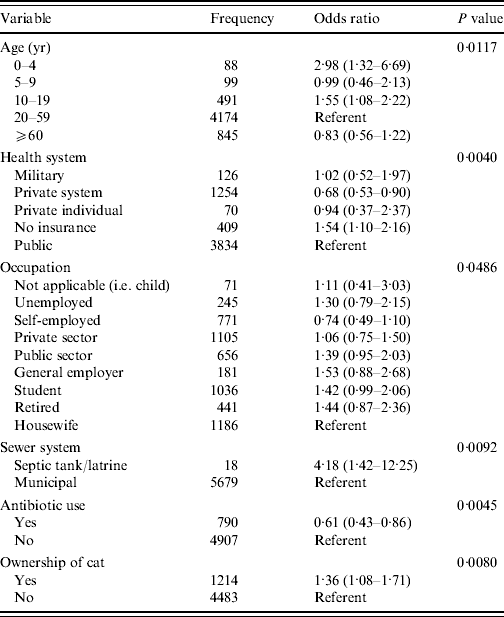
From univariable analysis of the full dataset (n=6047) age, socio-economic level, occupation, education, ownership of a cat, ownership of a cow, ownership of any pet, health system plan, sewer system and use of antibiotics in the 4 weeks prior to illness/interview were all significantly associated with being a monthly GI case (P<0·05) (Table 5). A final multivariable model included significant (P<0·05) predictor variables of age, health system, occupation, sewer system, antibiotic use and ownership of a cat (Table 6). Interaction between ‘antibiotic use’ and ‘ownership of a cat’, although significant in the final model, was excluded due to low frequency of respondents included by this interaction. The Hosmer–Lemeshow goodness-of-fit test P value was 0·86 indicating the model fit the data well.
Table 5. Univarable analysis results of association with acute gastrointestinal illness, Metropolitan region, Chile. 2008
* Indicates P<0·05.
Table 6. Final multivariable model of risk factors associated with acute gastrointestinal illness, Metropolitan region, Chile, 2008
Standard case definition comparison
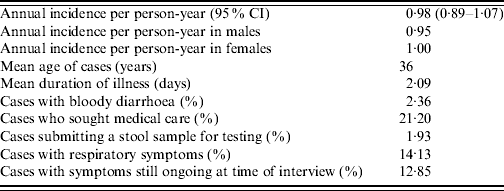
A summary of this study's results using the suggested symptom-based case definition are outlined in Table 7.
Table 7. Descriptive statistics of acute gastrointestinal illness based on 30-day recall period following the proposed standard case definition of gastrointestinal illness, Metropolitan region, Chile, 2008
Recall period comparison
Significant differences in annual incidence rate and annual incidence proportion estimates occurred between the 7-, 15- and 30-day recall periods, within each study phase and within the combined overall estimates (Appendix 2). The annual incidence rate estimate from the 7-day recall was about 2·2 times greater than the annual incidence rate estimate from the 30-day recall, for both study phases and overall (Table 2).
DISCUSSION
This study provides population-based estimates of GI for the Metropolitan region of Chile, illustrating that the incidence of GI is comparable to international estimates. An advantage of this study was using face-to-face methodology to administer surveys and a high average response rate of 75·8% was achieved compared to other telephone-administered surveys. Another unique contribution of this study was that we evaluated the impact of a 7-, 15- and 30-day recall period on estimates of the magnitude of GI from a survey.
Overall the age-adjusted monthly prevalence of 9·2% is similar to prevalences from studies in Canada, and Cuba [Reference Aguiar Prieto9, Reference Majowicz13, Reference Sargeant, Majowicz and Snelgrove15, Reference Thomas16] and somewhat higher than prevalences from studies in the USA, Australia, and Argentina [Reference Jones7, Reference Hall10, Reference Thomas21]. The overall range of annual incidence rates of 0·98–2·3 episodes per person-year in our study are higher than those reported in Ireland, the UK and The Netherlands [Reference Scallan14, Reference Wheeler17, Reference de Wit24]. In part, variations in case definition may explain differences in the magnitude of GI in the current study compared with other studies.
A standard case definition has been proposed [Reference Majowicz23] to assist with international comparisons and reports estimates from five countries: Australia, Canada, Ireland, Malta, USA. The incidence per person-year overall, incidence per person-year in females and the percentage of cases that sought medical care in the current study are similar to those reported by Australia and Canada. The mean age of cases, 36 years, is equivalent to that of Canada, which is the highest of all the countries. Mean duration of illness, and percentage of cases with respiratory symptoms in our study is lower than other countries, additionally, percentage of cases submitting a stool sample reported here is second lowest compared to the other countries. Percentage of cases with symptoms at time of interview (12·85%) is similar to Canada and in the middle of the range reported by other countries (8·22–18·20%). Similarly, the percentage of cases with bloody diarrhoea (2·36%) is in the middle of the range reported by other countries (0·87–5·10%). The annual incidence per person-year in males of 0·95 in our study was higher than all other rates reported (range 0·31–0·87).
The symptoms, severity and duration of illness we report are similar to other studies [Reference Jones7, Reference Aguiar Prieto9, Reference Imhoff11, Reference Majowicz13–Reference Thomas16, Reference Herikstad18], although the median duration and percentage of our cases with bloody diarrhoea are at the lower end of the spectrum of reported results. Similarly, percentages of cases reported here that sought medical care and submitted a stool sample are at the low end of the range of percentages reported from other studies [Reference Jones7, Reference Imhoff11, Reference Scallan14–Reference Thomas16, Reference Herikstad18]. However, we have a higher response rate, therefore it may not be a true difference or it may be a bias in other surveys where response rates are low. The lower percentage of individuals seeking care means fewer cases would be captured in a surveillance system, resulting in a larger underestimation of the true burden of illness.
From multivariable modelling, age, health system, occupation, sewer system, antibiotic use in the 4 weeks prior to illness/interview and ownership of a cat were significant risk factors to being a GI case. Children aged 0–4 and 10–19 years were 2·98 and 1·55 times more likely, respectively, to be cases compared to the referent group of 20- to 59-year-olds, which is similar to other reported studies where children and youths have higher odds of being a GI case [Reference Jones7–Reference Aguiar Prieto9, Reference Majowicz13–Reference Thomas16].
Residents who were members of a private healthcare system had significantly lower odds (OR 0·68) of being a case compared to those in the public system, whereas those who did not belong to any healthcare system had 1·54 times the odds of being a case compared to those in the public health system. This result is similar to studies in the USA, where those without medical insurance reported higher rates of GI than those with insurance and where rural residents had an increased rate of GI compared to urban residents [Reference Jones7]. Similarly, those using a septic tank or outdoor latrine in place of the municipal sewer system had 4·18 times the odds of being a GI case. Although socio-economic level was not significant in the final model, these results may, in part, reflect differences in socio-economic status; however, this needs to be explored further.
Those who did not take antibiotics in the 4 weeks prior to illness or interview had 1·64 times the odds of being a case as those that took antibiotics. This result does not support the theory that antibiotic-associated diarrhoea is a common side-effect of antibiotic use [Reference Hogenauer25]. However, the occurrence of antibiotic-associated diarrhoea is dependent on host factors as well as the type of antibiotic and method in which it is taken, which may in part explain the contrasting result found here [Reference Bartlett26–Reference Barbut and Meynard28]. Information on type of antibiotic and method of administration was not collected in this survey. Additionally, this information was self-reported and not verified with medical records or prescriptions.
Of the other non-sociodemographic risk factors, only ownership of a cat was significant, resulting in a 1·36 times increase in odds of being a GI case. Cats are known to carry a number of pathogens including Toxocara, Ancylostoma sp., Uncinaria, Dipylidium, Spirometra, Giardia, Toxoplasma, Cryptosporidium spp., Campylobacter spp., Salmonella spp., and rabies [Reference Robertson and Thompson29, Reference Lappin30] which can be transmitted to humans. In particular, contact with cats has been documented to be associated with being a case of campylobacteriosis [Reference Deming31], and recent work has studied pet cats as a potential risk factor for enteric infection in the home [Reference Hill32, Reference Spain33].
Although ‘phase’ was not significantly associated with being a GI case, it is of interest that symptoms of ‘vomiting only’ were more frequent in cases in phase 1, July and August (‘winter’) whereas ‘diarrhoea only’ was more frequent in cases in phase 2, November and December (‘summer’). This may indicate a seasonal difference in GI pathogens, where viral infections are associated with winter [Reference Mounts34] and bacterial and parasitic infections are associated with summer [Reference Naumova35].
The shorter 7-day recall period yields significantly greater annual estimates compared to the 15- and 30-day recall periods. This is similar to results reported from a population survey in an Argentine community where the 7-day recall period yielded 1·7–5·4 times the annual incidence rate compared to the longer 30-day recall period [Reference Thomas21]. However, this is contrary to the suggestion that ‘telescoping’ past illnesses into the observation period causes overestimates of disease in the population when using retrospective methods, as suggested by Wheeler et al. [Reference Wheeler17]. These results suggest an opposite effect of recall bias, such that the true burden of disease is underestimated when a longer recall period is used. Further investigation and international comparisons are needed to explore the impact of different recall periods.
A potential limitation of this study was the retrospective methodology used. Retrospective methods may be more subject to recall bias and thus under ideal conditions, prospective methodology is preferred [Reference Wheeler17]. Similar methods to other retrospective studies were used thereby enabling comparisons between studies. Furthermore, the exploration of shorter recall periods was an attempt to evaluate the impact of recall bias in a population survey.
Selection bias due to differences in age and gender of respondents and the referent community may be a limitation of this study. Additionally, institutions and hospitals were not included as part of the study population. Thus it is possible that cases of GI present in these locations were missed and may cause an underestimation of the true burden.
This study expands on the discussion of recall bias in retrospective population studies. It reports the first Chilean population-based burden and distribution of GI estimates and is one of only a handful of these types of studies conducted in developing countries, thus providing much needed information from an understudied and underreported part of the world.
ACKNOWLEDGEMENTS
The authors thank the Chilean Ministry of Health and the Instituto de Salud Pública for their support and assistance with this study, Dr Cecilia Parada for coordination and management of surveyors, the Universidad Iberoamericana de Ciencias y Tecnologia, Santiago, Chile for use of their rooms and facility for workshops and meetings, Dr Eduardo Alvarez of the Pan American Health Organization, Santiago, Chile for help with study coordination and William Sears of the University of Guelph for statistical assistance. This work was carried out with the aid of a grant from the International Development Research Centre, Ottawa, Canada (for information on the centre see: www.idrc.ca). Financial and in-kind support was provided by the Pan American Health Organization, the Public Health Agency of Canada, the University of Guelph, and the Ministry of Health, Chile.
APPENDIX 1
Formulas for calculating prevalence, incidence rate and incidence proportion [Reference Rothman and Greenland22].
![\openup4\hskip -1.5pt\eqalign{\tab {\rm Annual\ incidence\ rate} \cr \tab \equals {{{\rm no}{\rm .\ of\ cases}} \over \openup-6pt {\eqalign{\textstyle{{\rm 1}\over {2}} \ {\rm \left[\lpar total\ no. \ at\ risk\rpar \plus }\hskip 15pt\right.} \cr {\left. \lpar {\rm total\ no.\ at\ risk - no.\ of\ cases\rpar }\right] }}}} \cr \tab \times {{365} \over {{\rm no}{\rm .\ of\ days\ of\ recall\ period}}} \cr} \hfill](https://static.cambridge.org/binary/version/id/urn:cambridge.org:id:binary:20160921000604570-0592:S0950268810001160:S0950268810001160_eqnU2.gif?pub-status=live)
APPENDIX 2

n.a., Not applicable.
DECLARATION OF INTEREST
None.


