INTRODUCTION
Foot-and-mouth disease (FMD) is a livestock disease considered to have one of the highest economic impacts on national economies worldwide [Reference James and Rushton1]. Turkey has traditionally been considered a potential source of the spread of FMD into Europe [Reference Leforban and Gerbier2], where from 1962 to 1987 the European countries spent US$12 million on vaccination campaigns to create a buffer zone in Turkish Thrace and south-eastern Europe. After approval of the European policy of non-vaccination in 1992, FMD spread into Europe on several occasions, including three outbreaks in Greece and two outbreaks in Bulgaria [Reference Leforban and Gerbier2]. The high vulnerability of Turkey to FMD is due mainly to the intensive trade and movement of animals into Turkey from neighbouring countries. However, during the last decade Turkey has increased its efforts to control FMD, including implementation of vaccination campaigns, control of animal movements, and development of a system to monitor the spread of FMD throughout the country [Reference Aktas3].
Prediction and characterization of FMD occurrence in a region (e.g. a state or country) is important in FMD surveillance and control programmes, and in understanding when and where resources should be redirected to prevent or reduce projected increases in disease occurrence. For example, vaccination efforts can be focused in regions of a country where the predicted FMD occurrence exceeds a maximum acceptable threshold. Knowledge of high- and low-risk locations and time periods is important in directing surveillance programmes, including increasing both frequency and amount of sampling to high-risk areas and/or time periods [Reference Thurmond4]. The spatiotemporal distribution of FMD in a country also can be used to validate control programmes, and information on expected locations of disease may also be used to facilitate trade of animals and animal products among neighbouring regions and to redirect vaccination efforts.
A flexible spatiotemporal regression model for FMD was used to characterize the annual incidence of reported FMD cases in each province of Turkey from 1996 to 2003. Because the time trend of FMD cases (the number of such cases over time) in Turkey varied appreciably from province to province over this time period, we allow the longitudinal component to be arbitrary for each province, and modelled them as flexible continuous-time Gaussian processes. Use of these flexible structures yields data-driven estimates of arbitrary temporal trend for each province. This semi-parametric specification of longitudinal trend coupled with the use of generally applicable methods for spatial correlation has broad application not only for predicting FMD, but also for predicting changes in spatiotemporal distributions of other diseases throughout the world.
Whereas one of the aims of our work is to contribute to the understanding and quantification of FMD occurrence in Turkey, a key contribution of this paper is the development of methods for analysis of spatiotemporal count data, as applicable to predicting future occurrences of an infectious disease. Although FMD was used as the example disease here, the flexible modelling framework applies generally to any disease and to any region of the world.
The literature on the statistical modelling and analysis of spatial and spatiotemporal data is now vast. A detailed presentation of methodology for the analysis of spatial data is provided by Cressie [Reference Cressie5]. Moreover, the monograph of Banerjee et al. [Reference Banerjee, Carlin and Gelfand6] covers frequentist and Bayesian modelling of spatial data.
There has been considerable recent research on the analysis of FMD data and simulation studies from several regions of the world. For instance, studies have focused on FMD outbreaks in the United Kingdom [Reference Lawson and Zhou7–Reference Gerbier9], while FMD dynamics from Korea [Reference Yoon10], Australia [Reference Doran and Laffan11], and Argentina [Reference Perez, Ward and Carpenter12] have also been modelled.
METHODS
Data
The number, date, and location (province) of FMD cases in Turkey between 1996 and December 2003 were obtained from the International Office des Epizooties (OIE) website [13]. The data obtained through OIE were collected by the Turkish Ministry of Agriculture and Rural Affairs (MARA), which routinely reports all diagnosed cases of FMD to the OIE. In Turkey, it is mandatory that all FMD cases and all cases with signs resembling FMD are reported to the authorities [Reference Tufan14]. The definition of a case applied here is, according to OIE, ‘occurrence of the disease in question in an agricultural establishment, breeding establishment or premises, including all buildings and all adjoining premises, where animals are present’.
Model
Because temporal trends in FMD occurrence varied from province to province, we used a flexible semi-parametric structure for the longitudinal component of the model. Y(s, t) denotes the annual number of reported FMD cases in province s during year t and μ(s, t) denotes the mean number of FMD cases. Covariate information for province s at year t is denoted by x(s, t) with β as the corresponding regression coefficient. The spatiotemporal Poisson regression model considered was
The function g(s, t) models the longitudinal trend (on the log scale) of annual FMD cases for province s, and was specified as a Gaussian process. Gaussian processes do not impose unrealistic parametric constraints on time trend, and because data-driven estimates are obtained they are able to capture a wide variety of temporal shapes. Specifically, g(s, t) was modelled as an Ornstein–Uhlenbeck process with an exponential covariance function, which is a mean zero Gaussian process with covariance function given by
Hence, the covariance between g(s, t) and g(s, t*) for each province s is a function of the number of years separating t and t*.
Residual spatial correlation was modelled using a spatial process η(s), which was assumed to have a conditionally autoregressive (CAR) structure [Reference Besag and Kooperberg15]. The CAR structure incorporates spatial correlation into a model by specifying the distribution of the random effect for a province as being dependent on the collection of random effects for all neighbouring provinces (neighbouring provinces were defined as provinces that share a common border). Specifically, the CAR structure models the random effect for province s as
where N*(s) denotes the set of neighbours corresponding to province s, n(s) denotes the number of elements of N*(s), ![]() (s) denotes the mean of the neighbouring random effects for province s (i.e.
(s) denotes the mean of the neighbouring random effects for province s (i.e. ![]() ), and τ is an unknown precision parameter. Therefore, the random effect, η(s), for region s and the random effect, η(
), and τ is an unknown precision parameter. Therefore, the random effect, η(s), for region s and the random effect, η(![]() ), for a neighbouring region
), for a neighbouring region ![]() are correlated.
are correlated.
In addition to the Gaussian process model for longitudinal trend, we also considered other semi-parametric structures such as penalized splines [Reference Eilers and Marx16] and mixtures of cosine basis functions. Model selection was carried out using the Deviance Information Criterion (DIC) [Reference Spiegelhalter17]. The minimum DIC was 1249 among all linear spline models considered and was 1265 among the quadratic spline models. The minimum DIC among the cosine basis function models was 1208. However, we selected the Gaussian process model because the DIC was 1199.
Predictive factors and model implementation
The available predictors for each province included the number of cattle and sheep per province, and whether the province bordered a body of water. These factors are used because they are predictively related to FMD and it should be noted that it was not our intention to investigate whether they were risk factors of FMD because, for instance, cattle population is known to be a risk factor for FMD occurrence. We did not see the covariate for water borders being confounded by other more important factors, rather the covariate represents a surrogate for an important factor of ‘animal movement barriers’. Comments on this relationship are provided in the Discussion. Other predictive factors such as animal movement and vaccination coverage would be expected to influence the occurrence or non-occurrence of FMD, however, information on vaccination coverage and animal movement was unavailable at the time so we were unable to include these predictors. In general, spatial data on large geographic scales are often sparse due to the considerable amount of resources that would be needed to capture information on all potentially important predictors.
One province (Hatay) was missing covariate information and was excluded from the analysis. All covariates and their corresponding regression coefficients were assumed to be constant from 1996 to 2003 so that x(s, t)≡x(s). A Bayesian approach, which was implemented using the WinBUGS software [Reference Spiegelhalter, Thomas and Best18], was used to fit all models. The components of the vector β were modelled with independent diffuse N(0, 100) prior distributions. The precision parameter τ and the parameters θ1 and θ2 of the covariance function of the Gaussian process were modelled as uniform(0, 100). A sensitivity analysis was conducted for these parameters. Each model was fitted using 50 000 iterations after a burn-in of 5000 iterations was discarded.
RESULTS
This section presents results from an exploratory data analysis of the Turkish FMD data from 1996 to 2003. We then detail model selection and present model-based estimates of the mean longitudinal FMD trend for nine representative provinces. Maps displaying mean FMD incidence in 1996 and 2003 also are presented. Predictive inference is also discussed.
Descriptive analysis
Figure 1 presents a trellis plot of the reported annual number of FMD cases in each province. There is appreciable heterogeneity among the FMD longitudinal trends across provinces. For instance, several provinces reported zero FMD cases over the entire 8-year period while others had approximately constant (positive) FMD occurrence (e.g. Kutahya; row 3, column 3). Moreover, there were provinces that experienced an overall decreasing trend in annual FMD incidence (e.g. Aydin; row 2, column 6) and in some provinces the number of reported FMD cases fluctuated (e.g. Kars; row 9, column 4). From this figure it is clear that a flexible longitudinal model is required to account for such vastly different trends.
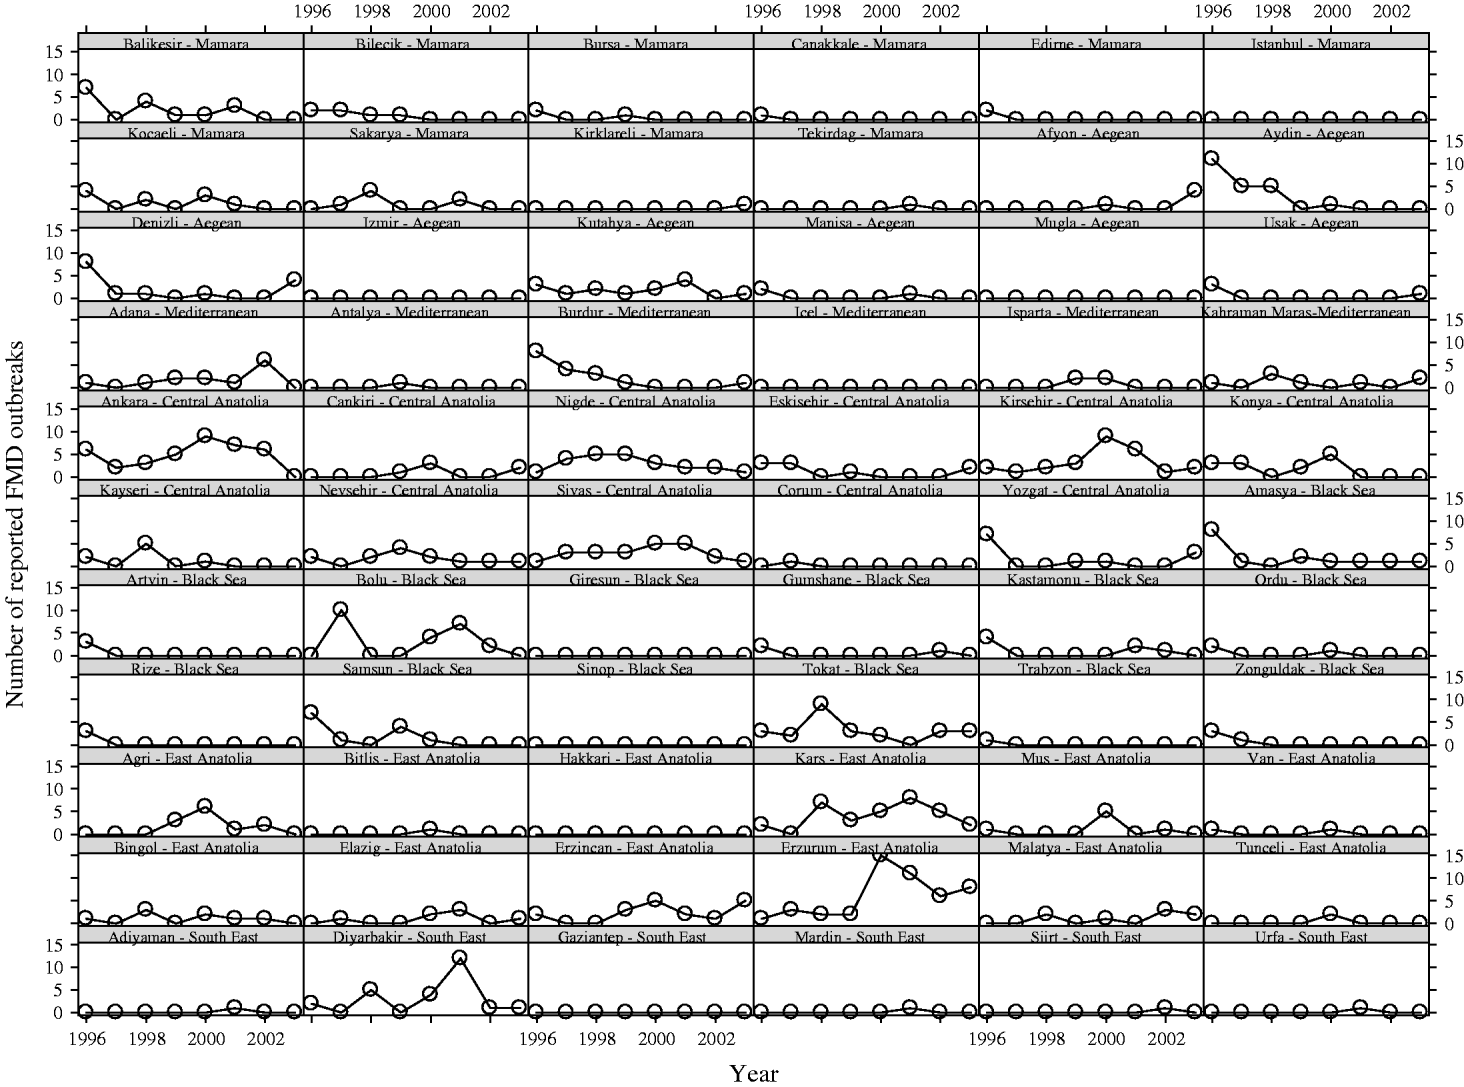
Fig. 1. The annual reported number of cases of foot-and-mouth disease from 1996 to 2003 for each province in Turkey. The labels for each subplot give the province name and region, e.g. the data for the province Balikesir in the Mamara region are plotted in the top left subplot.
Moran's I statistic [Reference Moran19] provides a measure of spatial association. The values 0·29 and 0·26 of Moran's I (each with standard error 0·07) suggest a significant spatial association for years 1999 and 2000. The maximum value of Moran's I for the other years was 0·12.
Model-based inference
The covariates included in the analysis were number of cattle in each province and whether the province bordered the Mediterranean, Aegean, or Black Sea. We also considered models that included number of sheep and an interaction between cattle and sheep population sizes, but these variables were excluded because of high DIC values and also because the posterior probabilities that the regression coefficients for number of sheep and the interaction term were positive were 0·80 and 0·77, respectively.
The model used for inference was:

where Cattle(s) denotes the standardized number of cattle in province s and Water(s)=1 if province s borders a body of water and equals 0 otherwise. To standardize the covariate number of cattle, we subtracted the sample mean and divided by the sample standard deviation. This was done to facilitate the Monte Carlo sampling procedure used to fit the model. We also fitted a model that allowed for different spatial random effects across years for each province, but this model was not selected because of its DIC value.
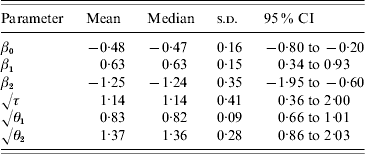
Posterior medians and 95% credible intervals for the model parameters are provided in Table 1. Bordering a body of water was a significant protective effect against FMD occurrence, which follows because Pr(β2<0|data)=1. As expected, provinces with large cattle populations experienced more FMD cases relative to provinces with small cattle populations [Pr(β1>0|data)=1].
Table 1. Posterior means, medians, standard deviations (s.d.), and 95% credible intervals (CI) for the parameters in the spatiotemporal model
While the posterior estimated regression coefficients may be somewhat imprecise, the focal point of our analysis was to quantify the trend in mean counts, μ(s, t), which were estimated precisely. Estimates and pointwise posterior credible intervals for μ(s, t) for nine provinces are plotted in Figure 2. These nine provinces were selected because they are spatially dispersed throughout Turkey and are representative of the observed FMD longitudinal trends among all provinces in Turkey during this time period. The estimated means in Figure 2 were obtained by fitting model (1) to the data from 1996–2003 and subsequently estimating μ(s, t). These estimates demonstrate that the model can account for a variety of longitudinal trends in FMD across provinces.
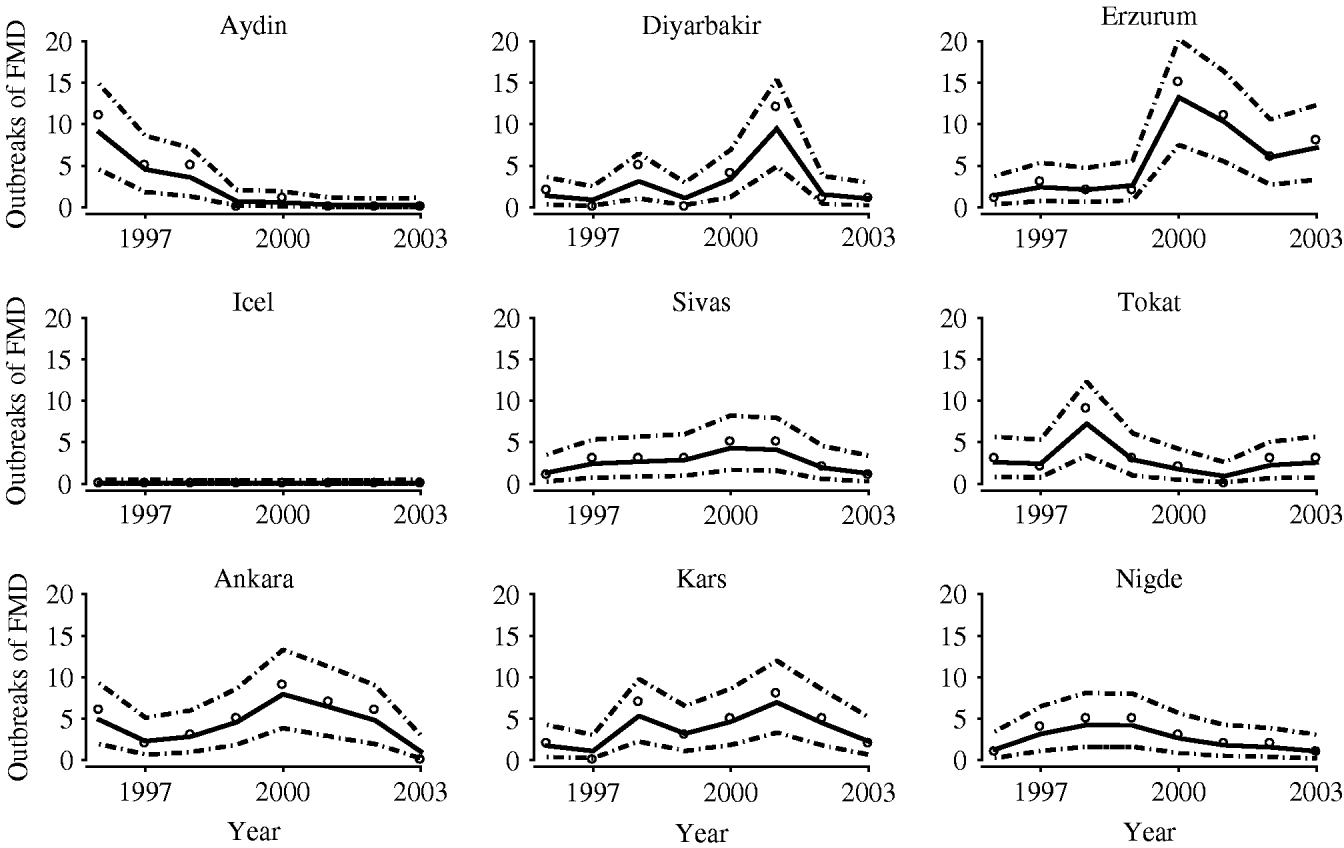
Fig. 2. The estimated foot-and-mouth disease (FMD) temporal profiles of nine representative (spatially and temporally) provinces in Turkey. The solid lines correspond to the estimated mean number of FMD cases and the dashed lines to pointwise 95% credible intervals. The observed data are plotted as open circles.
Figure 3 shows maps of Turkey displaying the estimated mean number of reported FMD cases in 1996 and 2003. Overall, there is a decreasing trend in the occurrence of FMD in western Turkey, and an increasing trend in eastern Turkey.

Fig. 3. Estimated mean number of reported foot-and-mouth disease cases in Turkey in (a) 1996 and (b) 2003. Shading is defined by the four quartiles of the estimated means in 1996: □, 0–0·13;![]() , 0·13–0·80;
, 0·13–0·80;![]() , 0·80–1·4; ■, >1·4 cases.
, 0·80–1·4; ■, >1·4 cases.
We also investigated the predictive ability of the model by fitting the data from 1996 to 2002 and then predicting the number of FMD cases for each province in 2003. Table 2 presents predictions and 95% upper limits on the predicted number of FMD cases in 2003 for the nine provinces considered in Figure 2. Icel had 0 reported FMD cases from 1996 to 2002 and the predicted value for 2003 was 0 (the true value in 2003 was also 0) with a 95% upper limit of 1. The time trend in FMD in Kars fluctuated from higher values to lower values from 1996 to 2002 and the predicted value for 2003 was 4 (the true value was 2). Because of the fluctuation in FMD cases in Kars during this time period, there is considerable uncertainty in the predicted value which is reflected by the 95% upper limit of 23. The point predictions [the medians of the predictive distributions of Y(s, 2003) for all provinces s] were accurate across provinces and upper limits for one-sided 95% prediction intervals contained the true reported number of FMD cases in 2003 for all provinces. For provinces with oscillatory temporal profiles, the 95% upper prediction limits were relatively large reflecting a higher degree of uncertainty for these provinces due, in part, to fluctuations in the number of FMD cases over time. For all other provinces not included in Table 2, the 95% upper limits for the predicted numbers of FMD cases were <10, except for Adana where the true value was 0 and the predicted value was 2 with a 95% upper limit of 10.
Table 2. Reported and predicted number of foot-and-mouth disease cases for nine representative provinces in Turkey
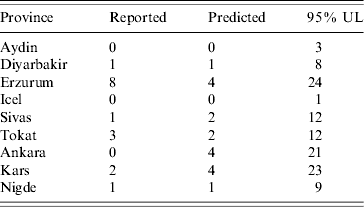
UL, Upper limit of one-sided 95% prediction intervals.
The predicted values were obtained by fitting the model to the data from 1996 to 2002 and predicting the values for 2003.
Based on our analysis of these data, it is clear that predictive accuracy of FMD counts in Turkey is partially impeded due to the lack of an underlying common structure that models FMD trend over time. If such a common trend were present, then more precise predictive inferences would be available. Additional covariate information and/or prior information would also increase forecast precision for FMD counts. However, the ability to accurately predict exact counts is secondary to being able to predict changes in trends and to understand the processes that underlie these trends.
The spatially correlated random effect, η(s), is a measure of the propensity of province s to experience FMD cases (adjusted for covariates). We monitored the ranks of these random effects using WinBUGS. The highest ranked provinces in terms of their η(s) values were Kirsehir, Kocaeli, Sakarya, Bolu, and Nigde, which are located in the Marmara, Central Anatolia, or Black Sea regions in western and central Turkey. The lowest ranked provinces were Hakkari, Mardin, Urfa, Van, and Siirt, which are located in the East Anatolia region or in the South East region of eastern Turkey.
We also fitted models with independent uniform(0, 10) and gamma(0·01, 0·01) distributions for τ, θ1 and θ2. A gamma(0·5, 0·0005) distribution was also used for τ, as suggested in [Reference Kelsall, Wakefield, Bernardo, Berger, Dawid and Smith20]. In each case posterior inferences for the mean number of reported FMD cases over time and across provinces, and predictive inferences for the future number of cases across provinces, were not appreciably altered. In all analyses, history plots (see Fig. 4) and the Gelman and Rubin diagnostic [Reference Gelman and Rubin21] indicated no lack of convergence.
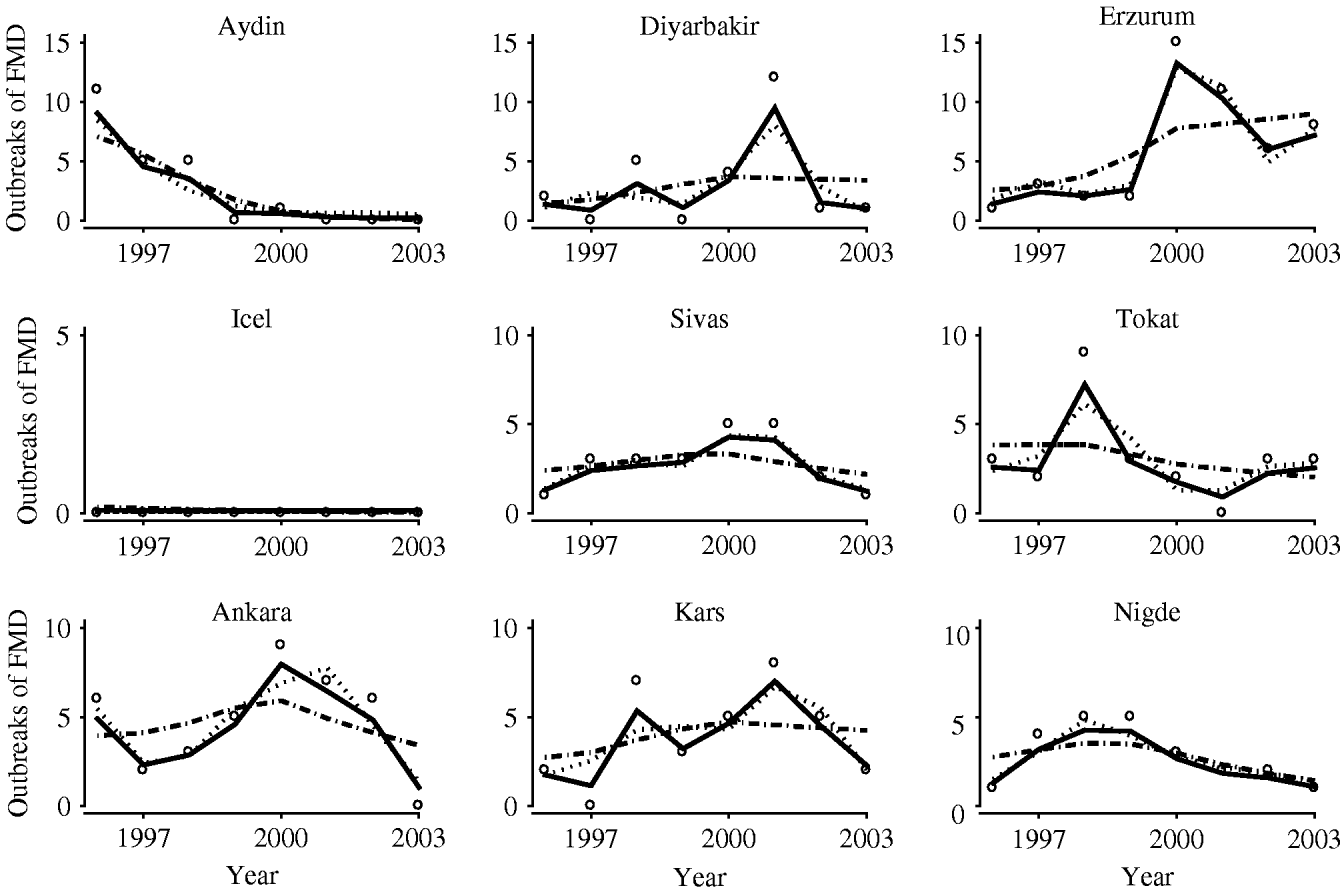
Fig. 4. Comparison of the estimated temporal profiles of mean number of foot-and-mouth disease cases in nine representative provinces in Turkey. ––, Stochastic process model; · · · · · ·, cosine basis function model; ·-·-·, linear spline model. The observed data are plotted as open circles.
In Figure 5, we compared the estimated mean FMD occurrence over time in the provinces highlighted in Figure 2 under three models, namely based on the stochastic process model, a cosine basis function model, and a linear splines model. The same covariate structure and spatially correlated random effects were incorporated into each analysis as described above for model (1).
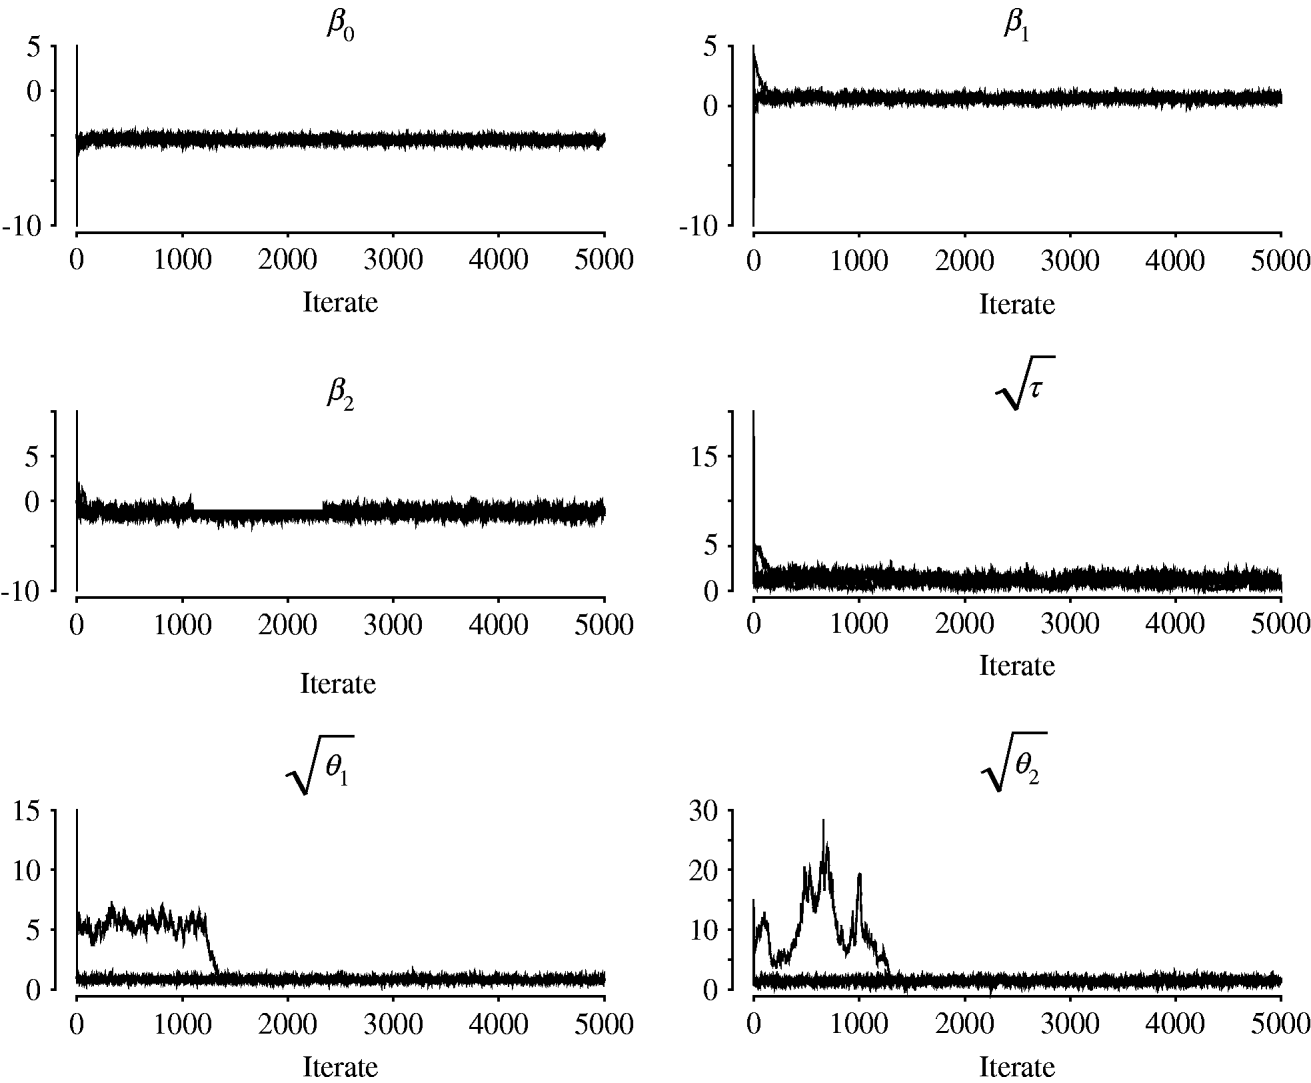
Fig. 5. History plots of the first 5000 Gibbs sampler iterates using separate chains with five disperse starting values.
In the cosine basis model, province-specific longitudinal components were specified as linear combinations of basis functions of the form
where φj(t)=cos (jπ (t−0·5)/8) for j=1, …, J=5. We modelled αj(s)~N(0, σα2) and placed a gamma prior with mean 1 and variance 1000 on σα2.
A linear spline model was also used where
where (x)+=max (x, 0). Four equally spaced fixed knots (denoted by κj) were used. The random regression coefficients were modelled as N(0, σ2) and a diffuse gamma prior centred at 1 was placed on σ2.
As previously mentioned, the DIC was smallest for the stochastic process model. Figure 5 is consistent with preference for the stochastic process model since it appears best at capturing the variety of longitudinal trends in these nine representative provinces.
DISCUSSION
This paper presents results of a Bayesian analysis of spatiotemporal data on reported FMD cases from 1996 to 2003 in Turkey, a region that is considered to be a potential source for the introduction of FMD into Europe [Reference Leforban and Gerbier2]. Key FMD findings include (i) the evaluation of factors that are predictive of FMD in Turkey (e.g. bordering on a body of water, and cattle population), (ii) designation of provinces that have a propensity for FMD, and (iii) a trend towards diminishing FMD occurrence in western Turkey and increasing occurrence in eastern Turkey during this time period. In addition, we present a flexible spatiotemporal model that could be used in its generalizable form to help predict when, where, and under what conditions future changes in diseases might occur. Such prediction models can help to identify risk factors operating to impede control progress and to clarify and retarget control efforts in regions projected to experience high occurrence of disease.
The 8-year trend indicating diminishing FMD occurrence in western Turkey is probably the result of intensive vaccination campaigns in which over 92% of the cattle and almost 80% of the sheep in Turkish Thrace were vaccinated in 2002 [Reference Tufan14]. In contrast, vaccination coverage in 2002 was at most 70% in Anatolia, the Asian portion of Turkey. The easternmost region of Anatolia has the most extensive animal agriculture production system in Turkey and is the most susceptible region for introduction of animals from neighbouring FMD-positive countries. These factors might have contributed to the persistence of FMD in eastern Turkey. The increase in reported FMD cases in eastern Turkey may be the consequence of increased FMD surveillance in this region, where surveillance efforts were increased, in part, to reduce transmission westwards into Turkish Thrace. Interestingly, FMD occurrence remained relatively unchanged in central Turkey, where most of the human population and most of the animal markets and slaughterhouses are located.
The finding that provinces bordering on water had fewer cases of FMD than landlocked provinces has general implications for the modelling of infectious diseases, as well as to understanding the distribution of FMD in Turkey. Natural or man-made barriers to animal movement, such as lakes, rivers, oceans, mountains, and fences, should be considered, at least initially, in developing models for animal diseases and for movement and spread of animal diseases, where obstacles to animal movement could serve to restrict or retard the spread of disease. Our analysis demonstrated that provinces bordering a body of water tended to experience less FMD cases than those that did not (see Fig. 3).
The number of cattle in a province was also predictive of the number of FMD cases, which was not unexpected. It is anticipated that as the number of animals at risk for FMD increases, so will the number of reported cases, even if the (true) incidence remains unchanged. Based on our analysis of these data, the positive association between cattle population and FMD occurrence, in contrast to sheep population which was not statistically significant (adjusted for cattle population), may be due to the more severe and noticeable clinical signs seen generally in cattle, thereby making diagnosis of FMD in cattle more obvious than in sheep [Reference Kitching22, Reference Kitching and Hughes23]. Cattle also lend themselves to more individual husbandry and thus can be observed frequently and in close proximity, whereas sheep tend to be raised under extensive management systems that preclude frequent and close individual animal scrutiny necessary to observe subtle signs of FMD in sheep. Another possible reason for the size of the cattle population serving as a predictor of FMD, compared to the size of the sheep population, is that because infected cattle shed more virus over a longer period of time [Reference Kitching22], environments populated by cattle would be expected to be more heavily contaminated with FMD virus. Consequently, areas with a high cattle population would have a heavier burden of virus that would impose a higher risk of infection for susceptible animals.
The statistical analysis presented here has several features that are worthy of consideration in modelling spatiotemporal data. The model was applied to FMD data, but is applicable to general infectious disease data. The generality of our approach is due, in part, to allowing the longitudinal component to be arbitrary, thus yielding flexibility in terms of the variety of shapes of time trends that can be accommodated (see Fig. 2). Moreover, spatial association can be accounted for in the model and covariate information can be incorporated into the analysis.
Our modelling approach is well-suited to a broad scope of applications, including characterizing the occurrence of disease, predicting future occurrences, and assessing surveillance systems. For example, as indicated here for FMD in Turkey, this model can be used to help predict when and where a disease is likely to increase or decrease. As noted above, such information can be used to anticipate changes in the spatiotemporal distribution of disease and to reallocate or adjust resources accordingly. Similarly, the model would be useful in strategic targeting of surveillance efforts, whereby surveillance sampling could be intensified in areas and at times when FMD was predicted to increase.
In summary, results of our analysis of reported province-specific cases of FMD in Turkey support the hypothesis that there exists both spatial and temporal components in the occurrence of FMD during the 8 years between 1996 and 2003. Our findings suggest an overall decreasing trend of FMD in Turkey, but the trend is not homogeneous throughout the country (see Fig. 3). The Bayesian model identified provinces with a propensity for FMD and found cattle population size, and not sheep population size, to be predictively related to FMD, with provinces having a larger number of cattle experiencing more cases of FMD, relative to provinces with smaller cattle populations. Further, provinces bordering on water had fewer cases of FMD. The modelling approach used here has application to predicting the temporal and spatial occurrence of diseases, such as FMD, that have a complex epidemiology with numerous risk factors that can vary over both time and geographic space.
APPENDIX
The following WinBUGS code presents the general syntax for fitting the Gaussian process spatiotemporal Poisson regression model used in this paper. The code below involves two continuous covariates, x 1 and x 2, but can be modified appropriately for different kinds of covariates. The variable n denotes the number of regions and J denotes the number of sampling dates, which are stored in the vector t 1. The hyper-parameters, a k and c k, are specified by the user and typically μ0 is set equal to the 0 vector.

ACKNOWLEDGEMENTS
The study was supported in part by funding through the US Armed Forces Medical Intelligence Center.
DECLARATION OF INTEREST
None.


