


High Na intake is one of the leading dietary risk factors for death and disability-adjusted life years worldwide, especially in East Asia and high-income Asia-Pacific regions(1). The WHO advocates < 5 g of salt intake per d(2), but few countries have achieved this goal(Reference Powles, Fahimi and Micha3). In addition, salt intake is higher in East Asian countries, including Japan, than in Western countries(Reference Powles, Fahimi and Micha3). According to a simulation conducted in a US study, a 3-g/d reduction of salt intake in the US population would reduce the incidence of CVD and related deaths and decrease annual health medical care expenditure by 10–24 billion US dollars(Reference Bibbins-Domingo, Chertow and Coxson4). Population-based approaches to salt reduction are needed throughout the world.
To implement a public nutritional approach to reducing salt intake, it is necessary to determine which dishes and foods have high salt levels, identify situations in which people consume salt and examine the determinants of an individual’s salt intake. Several studies have been conducted worldwide to investigate the sources of dietary salt(Reference Bhat, Marklund and Henry5). In Western countries, processed foods such as processed cereals and processed meat account for a large proportion of salt intake(Reference Bhat, Marklund and Henry5). In the UK, salt reduction in processed foods such as bread, processed cereal and processed meat resulted in an approximately 15 % decrease in average salt intake over a 7-year period(Reference He, Brinsden and MacGregor6). On the other hand, in Japan, The National Health Promotion Movement in the twenty-first century with several goals, including salt reduction, was launched in 2000(7). The goal of the first term (2000–2010) was to increase the number of food service establishments offering healthy menus(8), and nutrition education tools such as the ‘Japanese Food Guide Spinning Top’ (2005)(Reference Yoshiike, Hayashi and Takemi9) were developed and used together. In the 10 years since 2001, it has decreased by 1·5 g (from 12·1 g to 10·6 g per adult per d in average)(10,11) . In the second term (2013), the goal is to increase the number of industry firms supplying low-salt foods(12), and the legal obligation of nutritional labelling for processed foods by salt equivalent (2013) was also enacted. In the second phase up to 2019, the decrement was only 0·5 g (10·1 g per adult per d in average)(13,14) . Also, in China, a school-based cluster-randomised controlled trial was reported a successful effect of salt intake reduction in both children and their families by education on the harmful effects of salt and how to reduce salt intake for the children in the school(Reference He, Wu and Feng15). In East Asian countries, including Japan, seasonings such as soya sauce and miso (fermented soyabean paste), followed by soup, seafood and salted foods such as pickled products, account for a large proportion of salt intake(Reference Bhat, Marklund and Henry5). A policy similar to that implemented in the UK may not be sufficiently effective in East Asian countries, where traditionally prepared dishes are eaten with a discretionary amount of seasonings at home, or in other countries where the sources of salt intake differ from those in the UK. In most previous studies conducted in Japan(Reference Anderson, Appel and Okuda16–Reference Asakura, Uechi and Masayasu22), the source of salt intake was classified only by food groups (according to ingredients), but in one, classification was based on whether the food was seasoned at home or outside the home (commercially)(Reference Asakura, Uechi and Masayasu22). Moreover, although foods that contribute to overall salt intake may not be consistent with the determinants of individual habitual salt intake, effects of such foods on 24-h urinary Na excretion have been examined in few studies(Reference Asakura, Uechi and Masayasu22,Reference Liu, Ho and Tang23) .
In this study in Japan, we examined the sources of salt intake listed in four 3-d weighed food records (WFR) according to the following classifications, as well as the association of those sources with 24-h urinary Na excretion: by discretionary or non-discretionary intake, by the situation in which dishes were cooked and consumed, by the food group, and by the type of cuisine.
Experimental methods
Study design and participants
The study was initially aimed at examining the validity of the FFQ and was conducted on 253 generally healthy middle-aged and elderly residents (107 men and 146 women), 35–80 years of age, from five rural areas (Yokote, Saku, Chikusei, Murakami and Uonuma) in the Japan Public Health Centre-based Prospective Study for the Next Generation (JPHC-NEXT) as in their protocol of the cohort study. As Fig. 1 shows, four 3-d WFR and five 24-h urine samples obtained over a 1-year period including four seasons served as the reference measures. Details of the study design and methods of data collection were reported previously(Reference Yokoyama, Takachi and Ishihara24).
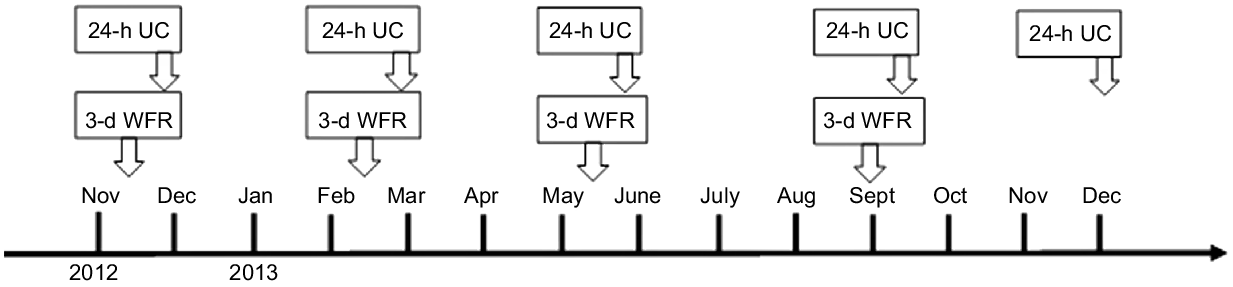
Fig. 1. Data collection sequence of WFR and 24-h UC. 24-h UC, 24-h urinary collections; 3-d WFR, 3-d weighed food record.
Ethical approval
This study was conducted according to the guidelines laid down in the Declaration of Helsinki, and all procedures were approved by the Institutional Review Boards of the National Cancer Centre in Tokyo, Japan (No. 2012-062) and of all other collaborating research institutions, including Nara Women’s University (No. 16-04). Written informed consent was obtained from all subjects.
Data collection
Participants filled out four 3-d WFR and provided five 24-h urine samples between November 2012 and December 2013. The WFR were filled out over three consecutive days during each season, at approximately 3-month intervals. Five 24-h urine samples were collected, one each on the last day of the four 3-d WFR and 1 year after the start of the survey. Participants also filled out a self-administered questionnaire to provide information about age and anthropometric data.
Weighed food record
Each 3-d WFR was filled out for three consecutive days: two weekdays and one day during the weekend. The participants recorded all foods, including seasonings and drinks that they consumed during the survey. Each participant measured food portions during meal preparation by using a portable precise digital cooking scale (Tanita Co. Ltd), which we supplied, and measuring spoons and cups. For foods purchased or consumed outside the home, the participants were instructed to record the approximate quantity of all foods in the meal, the names of the product and venue or both. Trained dietitians checked the WFR with the participants the day after each 3-d WFR at the study venue in each study area, and the foods and weights were coded. In some cases, the 3-d WFR was submitted by fax or regular mail to the study office, and the dietitian checked with the participant over the telephone.
Urine collection
The participants collected 24-h urine samples by using a portable urine measurement device (sumius U-Container, Sumitomo Bakelite Co., Ltd), and a 1/50 portion of all collected urine samples was analysed. The data of five participants with three or more collection errors (who did not collect urine twice or more during each collection day) a total of five times were excluded from the analysis of urinary Na excretion. For participants who missed a single urine collection, the mean value of the urine volumes was recorded for that collection. There were no inaccurate urine collections in terms of the volume as > 10 l/24 h(Reference Sun, Bertrand and Franke25). In addition, we checked the accuracy of urine collections using creatinine coefficients = creatinine (mg/d)/body weight (kg). Creatinine coefficients of 14·4–33·6 in men and 10·8–25·2 in women were considered acceptable for 24-h urine collection(Reference Sasaki, Kobayashi and Tsugane26). We calculated 24-h urinary excretion of salt equivalents according to the following formula: 24-h urinary Na excretion = urine Na concentration (mmol/l) × obtained amount of excretion (ml) × 50 × 23.
Definition of the classification
Based on self-reports by the participants and detailed interviews by trained dietitians, we classified all foods, ingredients and dishes listed in the 3-d WFR. The definitions of these classifications are illustrated in Fig. 2. We classified the sources of dietary Na intake in four ways; each ingredient and each dish were exclusively classified in different categorisation.
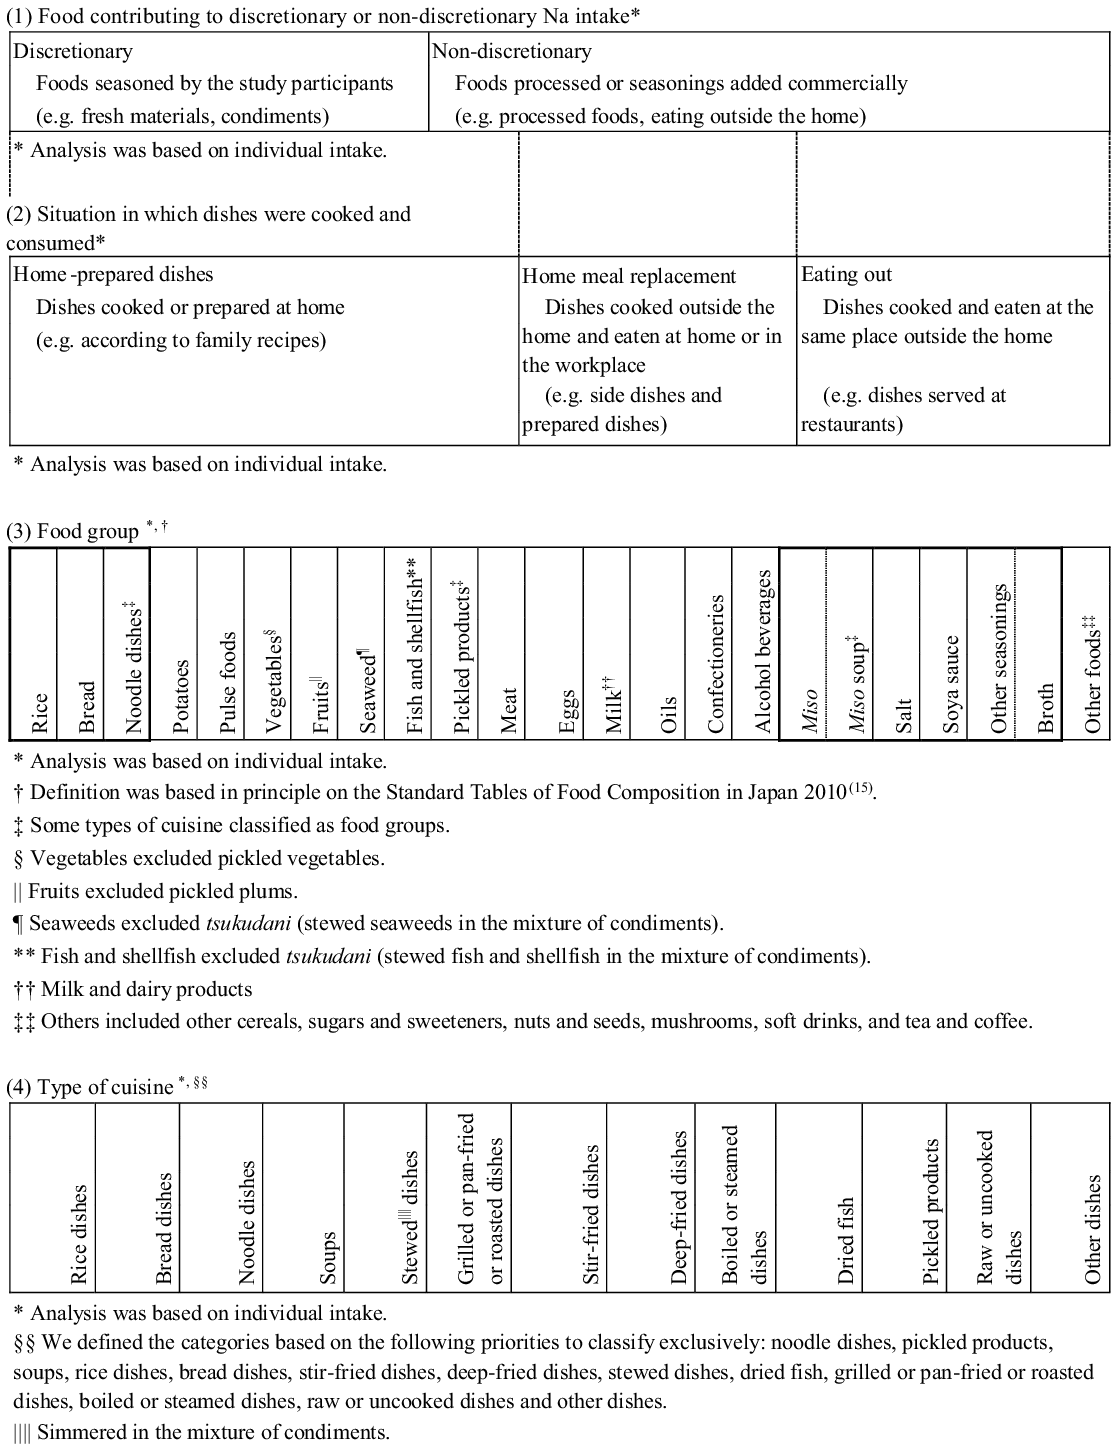
Fig. 2. Classification of recorded foods and dishes: (1) all foods contributing to discretionary or non-discretionary Na intake; (2) home-prepared dishes, home meal replacement or eating out; (3) twenty-eight food groups; and (4) thirteen types of cuisine.
Food contributing to discretionary or non-discretionary sodium intake(Reference Asakura, Uechi and Masayasu22)
All ingredients were classified as contributing to either discretionary or non-discretionary Na intake. Seasonings such as miso and soya sauce were also classified into either category according to the conditions in which they were eaten. The foods contributing to non-discretionary Na intake included processed foods or those in which seasonings had been added commercially, such as those not prepared at home. The foods contributing to discretionary Na intake included all foods in which the participants added seasonings.
Situation in which dishes were cooked and consumed(Reference Asakura, Uechi and Masayasu22)
All dishes were classified as home-prepared dishes, home meal replacements or those eaten outside the home. The home-prepared dishes included those cooked or prepared at home, such as those prepared according to family recipes; the home meal replacements included dishes cooked outside the home and eaten at home or in the workplace, such as commercially prepared dishes; and those eaten outside the home included dishes cooked and eaten at the same place outside the home, such as dishes served at restaurants. All dishes categorised as home meal replacements or those eaten outside the home were classified as non-discretionary.
Food group
This classification was based in principle on the Standard Tables of Food Composition in Japan 2010(27). We further classified three types of cuisine as food groups because of their relatively large contributions to Na intake in the Japanese population(Reference Anderson, Appel and Okuda16,Reference Takimoto, Saito and Htun17,Reference Ogawa, Tsubono and Nishino19–Reference Asakura, Uechi and Masayasu22) : noodle dishes (e.g. all ingredients in all dishes with noodles, such as pasta, ramen, soba and udon), pickled products (e.g. tsukudani: stewed fish in soya sauce, in addition to pickled vegetables and pickled plums) and miso soup (all ingredients in all soups in which miso has been added as a condiment). All ingredients were classified into twenty-eight food groups: rice, bread, noodle dishes, other cereals, potatoes, sugars and sweeteners, pulse foods, nuts and seeds, vegetables (excluding pickled vegetables), fruits (excluding pickled plums), mushrooms, seaweed, fish and shellfish, pickled products, meat, eggs, milk and dairy products, oils, confectioneries, alcoholic beverages, soft drinks, tea and coffee, broth, salt, soya sauce, miso (any kind of miso except miso soup), miso soup, and other seasonings. Furthermore, foods in the fish and shellfish category and the meat category were subclassified as ‘fresh’ or ‘processed’ in the multiple regression analysis (described in the ‘Statistical analysis’ section). The purpose of this subdivision was to consider whether those foods were discretionary or non-discretionary.
Type of cuisine
Classification of cuisine reflected the use of a combination of staple foods and cooking methods. All dishes were classified into one of thirteen types of cuisine: noodle dishes (as described in the ‘Food group’ section), pickled products (as described in the ‘Food Group’ section), soups (including miso soup), rice dishes, bread dishes, stir-fried dishes, deep-fried dishes, stewed dishes (simmered in a mixture of condiments), dried fish, grilled or pan-fried or roasted dishes, boiled or steamed dishes, raw and uncooked dishes, and ‘other dishes’. All dishes made with rice or bread were defined as rice dishes or bread dishes, respectively. The ‘raw and uncooked dishes’ category included raw vegetables, salads, fruits, sashimi (raw fish), tofu (soyabean-curd), yogurt and so on. ‘Other dishes’ included confectioneries, beverages and so on.
Statistical analysis
The percentages of Na in foods were determined according to the four sources of Na described. We calculated the ratio of the mean Na intake from the relevant category to the mean total Na intake for each participant. Na intake from the relevant category per 4184 kJ (1000 kcal) was also calculated in the same way.
Next, we conducted a multiple regression analysis to examine the extent to which Na intake from the sources contributed to each participant’s habitual urinary Na excretion, by each of the four classifications separately. Because five participants had missed two or more urine collections in a day, data from 248 participants (103 men and 145 women) were used in the multiple regression analysis. Of these participants, 215 (86·7 %; 89 men and 126 women) completed five 24-h urine collections. In the multiple regression analyses, the amount of the food or the dish intake (in grams) from each category was an independent variable, and 24-h urinary Na excretion was the dependent variable. In the initial regression model, sex and age (continuous) were also used as independent variables. Results were presented as partial regression coefficient (B) with standard error. In addition, to compare which category of food or dish strongly influenced each participant’s urinary Na excretion, we calculated the standardised coefficient (β) in this regression analysis using the mutually adjusted (simultaneous) model in which all categories of food or dish intake (in grams) in each of the four classifications were included as independent variables. We verified the variance inflation factor in order to check the multicollinearity and found that all values of the variance inflation factors were less than 2·3 in food groups. In the multiple regression analysis of intake by food group, seasonings were not included as independent variables, because the purpose of the analysis was to examine the relationship between the intake of each food group and urinary Na excretion. We also conducted regression analyses further adjusted for energy intake or BMI and physical activity in metabolic equivalent of tasks.
Lastly, we determined the Na intake per serving in each type of cuisine, based on 57 451 dishes consumed by 253 participants. In addition, we used analyses of covariance to compare age- or sex-adjusted least-squares mean values of the percentage of Na consumed according to sex or the age category (< 60 years or ≥ 60 years), respectively.
P-values of < 0·05 were considered statistically significant. To perform all analyses, we used SAS version 9.4 (SAS Institute Inc.).
Results
The characteristics of the participants are presented in Table 1. Their energy intake, salt intake and BMI were similar to those in the 2012 and 2013 National Health and Nutrition Surveys(13,28) . Of the participants with higher urinary Na excretion, higher percentages were men, were older and had higher BMI, in comparison with participants with lower urinary Na excretion.
Table 1. Characteristics of the study participants
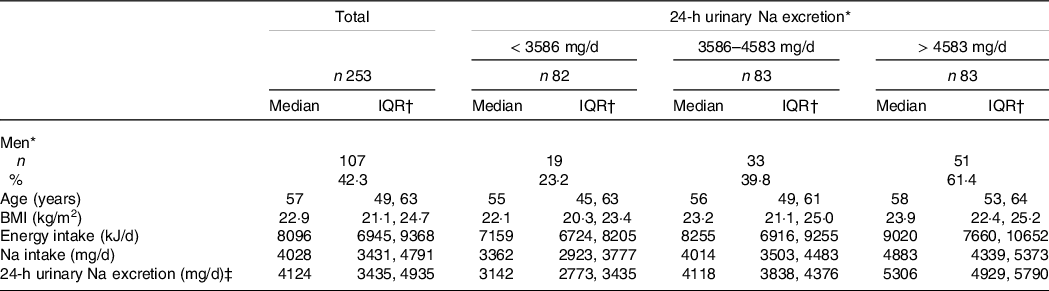
* Number.
† Inter quartile range (25th, and 75th percentile).
‡ Two hundred and forty-eight participants (103 men and 145 women) successfully collected urine.
The contributions of foods to Na intake and the results of multiple regression analysis according to the classifications are presented in Table 2. Na intake from discretionary foods accounted for 60 % of the total Na intake, although in the multiple regression analysis for urinary Na excretion, the standardised coefficient for non-discretionary Na intake was larger than that for discretionary Na intake. With regard to where dishes were cooked and consumed, the home-prepared dishes accounted for > 80 % of the total Na intake, which was consistent with the fact that the standardised coefficient for home-prepared dishes was the largest in the multiple regression analysis for urinary Na excretion. Of the food groups, seasonings such as soya sauce and salt accounted for the highest amount of Na intake, followed by miso soup, noodle dishes, fish and shellfish and pickled products, the last of which accounted for 6 % at most. In the multiple regression analysis of the food group (other than seasonings) with regard to urinary Na excretion, the standardised coefficients were the largest for pickled products, followed by those for rice, fresh fish and shellfish and miso soup. Noodle dishes also showed significant association with urinary Na excretion. In the age- and sex-adjusted models, bread was negatively related to urinary Na excretion (although not significantly), and fruits were significantly and negatively related to urinary Na excretion.
Table 2. Mean percentage contribution by foods or dishes to Na consumption*
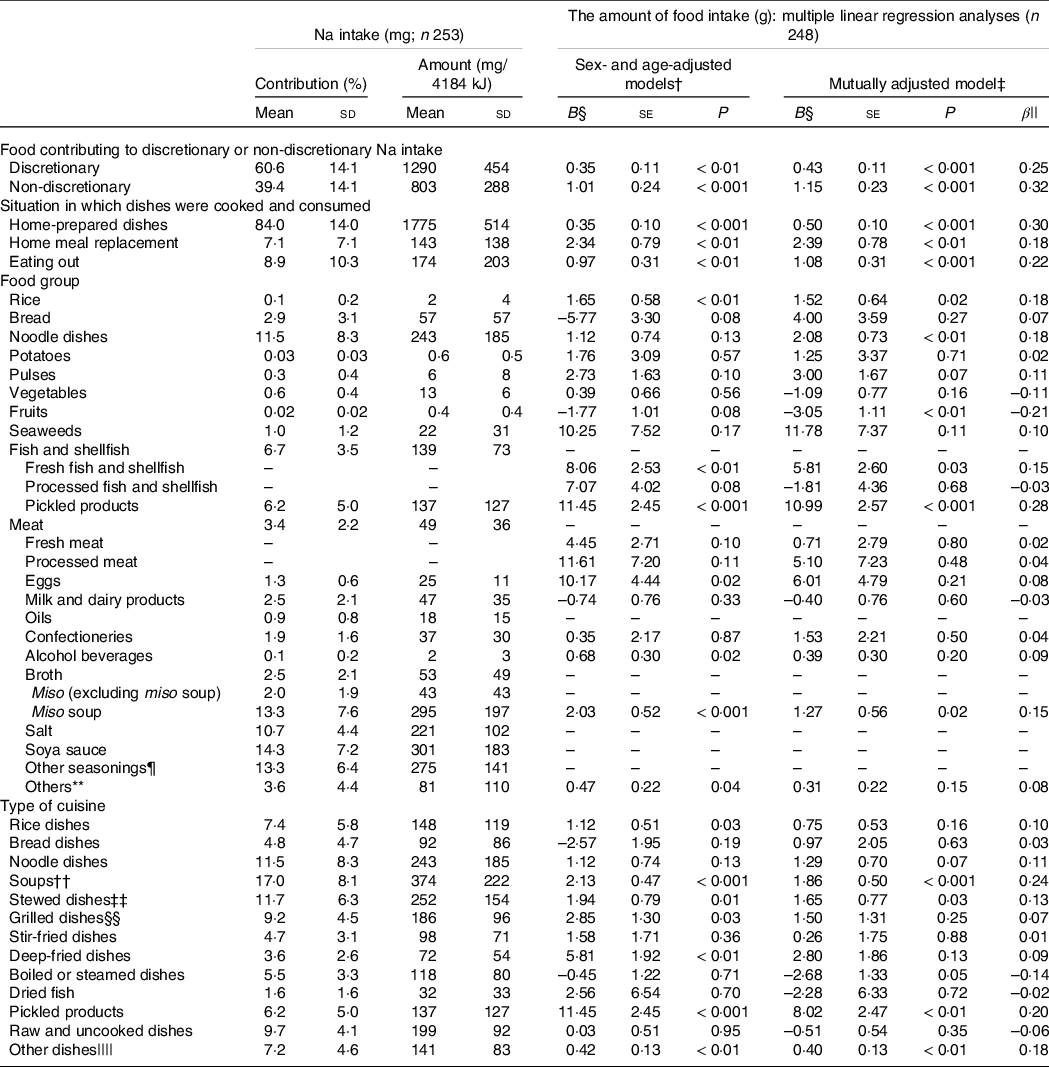
* In multiple linear regression analyses, 24-h urinary Na excretion was a dependent variable and the amount of food intake (in grams) in each category was an independent variable.
† The amounts of food intake (grams) of each category, sex and age were included as independent variables, and multiple 24-h urinary Na excretion was used as a dependent variable.
‡ The amount of food intake (grams) of every category, sex and age were included as independent variables, and multiple 24-h urinary Na excretion was used as a dependent variable.
§ B: the partial regression coefficient.
|| β: standardised coefficient.
¶ Other seasonings included dressings, spices, vinegars, Worcestershire sauces and ready-made mixed seasonings.
** Others included other cereals, sugars and sweeteners, nuts and seeds, mushrooms, soft drinks and tea and coffee.
†† Soups included miso soup.
‡‡ Simmered in the mixture of condiments.
§§ Grilled, pan-fried or roasted dishes.
|||| Other dishes included confectioneries, beverages and so on.
With regard to the type of cuisine, soups (including miso soup) and stewed dishes together accounted for approximately 30 % of the total Na intake. In the multiple regression analysis, the standardised coefficient was the largest for soup, followed by those for pickled products and stewed dishes. The amount of Na intake per serving of soup was also higher than that per serving of other dishes (online Supplementary Table 1). The percentage of Na intake from rice dishes in general was not small, although the amount of Na per serving was relatively low (online Supplementary Table 1), and it was significantly and positively associated with urinary Na excretion. In contrast, the percentage of Na intake from noodle dishes was larger than that from rice dishes, and although noodle dishes had the highest amount of Na per serving (online Supplementary Table 1), they were not significantly associated with the level of urinary Na excretion. Levels of Na intake per 4184 kJ (1000 kcal) for all categories were similar to the percentages contributed by the categories to the total Na intake. In addition, the results of multiple regression analyses did not change after further adjustment for total energy intake or BMI and physical activity in metabolic equivalent of tasks (online Supplementary Table 3). However, the regression coefficients were attenuated and more so for higher energy food groups or types of cuisine. Moreover, the results did not change after excluding urine samples (6·3 % of total samples, including eleven excluded subjects) with an inaccurate creatinine coefficient (data not shown).
The results of the comparisons of percentages of total Na intake according to sex and the age group are presented in online Supplementary Table 2. The proportion of Na intake from discretionary foods was significantly higher in women and elderly participants, but the proportion of discretionary Na intake was almost 60 % in men and relatively younger participants. With regard to the situation in which dishes were cooked and consumed, the proportion of Na intake contributed by home-prepared dishes was significantly higher in elderly participants, but home-prepared dishes also accounted for more than 80 % of Na intake in younger participants.
Discussion
In this study, approximately 60 % of the salt intake was contributed by discretionary foods and more than 80 % was contributed by home-prepared dishes, according to the four 3-d WFR. Seasonings, followed by miso soup, noodle dishes, fish and shellfish and pickled products, contributed the largest amount of Na among all food groups. Soups and stewed dishes contributed larger amount of Na than other types of cuisine. Non-discretionary foods and home-prepared dishes, as well as pickled products, fresh fish and shellfish, miso soup and rice, accounted for high urinary Na excretion.
Our study had some strengths in comparison with several previous reports. First, we identified the sources of salt intake in the habitual diet of Japanese participants by conducting a dietary survey for a total of 12 d over four seasons. The number of days necessary to estimate habitual Na intake within a range of ±10 % in Japanese adults was reported to be 8–12 d(Reference Fukumoto, Asakura and Murakami29,Reference Ogawa, Tsubono and Nishino30) . However, in most of the previous studies, the dietary record covered 1–7 d(Reference Bhat, Marklund and Henry5). In only one study (conducted in Japan), the investigators did examine the sources of salt intake with dietary records for 12 d(Reference Ogawa, Tsubono and Nishino19). According to a 1-d survey by the National Health and Nutrition Survey in Japan, seasonings accounted for at least 50 % of Na intake(Reference Takimoto, Saito and Htun17). Moreover, in the International Study of Macro- and Micro-Nutrients (the INTERMAP study), a 24-h dietary recall was conducted four times among 1145 Japanese participants; it revealed that soya sauce accounted for approximately 20 % of the total dietary salt intake, and pickled products and miso soup each accounted for approximately 10 %, percentages that were similar to our results. The INTERMAP study also revealed that the contribution of discretionary seasoning was larger in Japan than in Europe and the USA(Reference Anderson, Appel and Okuda16).
Very few studies in Asia(Reference Ogawa, Tsubono and Nishino19,Reference Jeong, Kim and Lee31) have focused on contributions of dietary Na by the type of cuisine. A Japanese study(Reference Ogawa, Tsubono and Nishino19) demonstrated that miso soup was the largest contributor (17·1 %), followed by pickled products (12·4 %), according to 12-d worth of food records among 119 participants, and a Korean study(Reference Jeong, Kim and Lee31) demonstrated that noodle and dumpling dishes were the largest contributors (15·6 %), followed by kimchi (14·0 %) and soups (10·6 %), according to one 24-h dietary recall among 7167 participants. These findings are the same as our results. Moreover, we examined determinants of individual salt intake by using five 24-h measurements of urinary Na excretion of foods in different categories. Few studies have focused on the relationship between food intake by some categories, as estimated from dietary records and urinary Na excretion(Reference Asakura, Uechi and Masayasu22,Reference Liu, Ho and Tang23) . In a Chinese study(Reference Liu, Ho and Tang23), the researchers used only one 3-d food record and one 24-h urine collection, and Japanese researchers used 4-d WFR and two 24-h urine collection.
Because bread contains salt but rice does not(27), the analysis by food groups revealed that the percentage of Na contributed by rice itself was smaller than that contributed by bread. In contrast, the percentage contributed by rice dishes was larger than that by bread dishes. Moreover, the intake of rice and rice dishes had the strongest positive association with urinary Na excretion, whereas bread and bread dishes had a negative association with urinary Na excretion. This might be explained not only by the salt content of the food itself but also by the effect of salt intake from the food that was eaten with rice. Nanri et al.(Reference Nanri, Shimazu and Ishihara32) identified three dietary patterns in a subsample of 498 individuals in the JPHC study and reported that the traditional Japanese dietary pattern was positively associated with the intake of rice, miso soup, pickles and salty fish, whereas the westernised Japanese dietary pattern was positively associated with the intake of bread and negatively associated with the intake of rice, miso soup, pickles and salty fish. In addition, the INTERMAP study(Reference Anderson, Appel and Okuda16), which was an international comparison of sources of dietary salt intake, demonstrated that soya sauce, soup (especially miso soup), pickled products and fresh and salted fish contributed large proportions of dietary salt intake in the Japanese population, which is consistent with our findings. These results suggested that when Japanese people ate rice as a staple food, they also ate miso soup, pickled products and salty fish or seafood seasoned by soya sauce, which contributed heavily to the total salt intake and thus accounted for increased urinary Na excretion. These results strongly suggest that Japanese people need not only personal education about food but also a new approach based on their food culture.
The large contribution of seasonings, soups and fish and shellfish to Na intake in this study was consistent with the findings in many Japanese studies in which dietary salt sources were examined by food groups(Reference Anderson, Appel and Okuda16–Reference Shimbo, Imai and Yasumoto21). In addition, the high contribution of discretionary foods and home-prepared dishes to Na intake was consistent with the findings of previous studies carried out not only in Japan(Reference Asakura, Uechi and Masayasu22) but also in other East Asian countries, such as China and Korea(Reference Bhat, Marklund and Henry5). In countries where home-prepared and discretionary seasoned meals contribute heavily to salt intake, people should be encouraged to reduce their discretionary use of seasonings, inasmuch as the stronger the preference for salty foods, the higher the urinary Na excretion(Reference Takachi, Ishihara and Iwasaki33). In particular, not only personal educational approaches but also dietary–cultural approaches may be needed to raise awareness about soups (especially miso soup), which contain high levels of Na and are significantly associated with urinary Na excretion: for example, reducing portion sizes or reducing the frequency of consumption (i.e. intervention to provide meals to a specified population continuously, such as an educational intervention for school lunch, by downsizing the tableware and reducing the frequency of soup dishes consistently and feasibly according to the National Health Promotion in Japan). Moreover, in the long term, policy interventions in food industries, as in the UK, should be emphasised on condiments than on food service and home meal replacement.
On the other hand, we found that the major non-discretionary food eaten at home and the major determinant of Na excretion was pickled products, although their contribution to Na intake and the amount of Na per serving were not the highest. These results suggest that approaches such as reducing the salt content of processed foods, such as pickled products, may be restrictive for reduced dietary salt in the whole population as the home-prepared and discretionary sources were the major salt intake sources. Regarding noodle dishes, regression analyses revealed no significant relation between noodle dishes and Na excretion despite of their notable contribution to salt intake per serving and percentage contribution to Na intake. This finding may be due to an attenuation of the correlation between Na intake from noodle dishes and Na excretion in the initial sex- and age-adjusted model as a potential confounder, because the noodle dishes are more eaten among men and relatively young people (online Supplementary Table 2). However, further analysis without adjusting for sex or age showed a significant and larger regression coefficient (se, p-value) for Na excretion with noodle dishes by 1·8 (0·72, P = 0·01) than that in the initial model.
Our study had several limitations. First, because food composition tables in Japan are based on ingredients, comparison with diets in other countries is limited. For example, in the Standard Tables of Food Composition used in the USA(34), pizza is listed as one kind of food, but in Japan, the Standard Tables of Food Composition(27) lists its ingredients. Similarly, fast food eaten at restaurants is also categorised broadly as bread, meat, vegetables and seasonings. We categorised these dishes based on self-reports and detailed interviews; however, the amount of ‘home meal replacement’ or ‘eating out’ consumption may have been underestimated. Second, the study was conducted only in rural areas; therefore, the dietary behaviours of the study participants might differ from those of urban populations, although the rural areas studied in this report did not differ much from the overall Japanese population in terms of mean Na intake(28). The contribution of non-discretionary Na intakes, such as that from home meal replacements and meals eaten outside the home, might have been underestimated; however, the degree of underestimation may be negligible, because even the national survey in Japan, which included urban populations, revealed that only 41 % of men and 29 % of women regularly (at least twice a week) either ate outside the home or consumed home meal replacements(Reference Sasaki, Kobayashi and Tsugane26). Also, young adults were not included in this study, although they have lesser Na excretion than older adults(Reference Asakura, Uechi and Masayasu22). Finally, dietary habits may have changed after this survey was conducted. However, the main target of the populational approach to salt reduction has probably not changed, inasmuch as seven previous studies conducted in Japan(Reference Anderson, Appel and Okuda16–Reference Asakura, Uechi and Masayasu22) between 1977 and 2013 have shown consistent percentages and rankings of salt intake contribution by food group, despite the 36-year gap. Furthermore, we could not rule out all of the possible residual confounding, such as self-reported bias for anthropometry. Also, selection bias from social desirability for WFR could not be ignored.
Conclusion
In the population of this study, the contribution of discretionary foods, such as soups (including miso soup), to the total Na intake was large, whereas non-discretionary foods with high Na, such as pickled products, strongly affected individual urinary Na excretion. To reduce salt intake for a whole population, the main targets may be home-prepared dishes and the use of discretional seasoning; however, reducing the salt content of processed foods, such as pickled products, may be restrictive for individuals with high salt intake.
Acknowledgements
The authors thank Ms. T. Komata and all the member dietitians for the food record data collection and Ms. M. Sugihara, Ms. M. Toya, Ms. M. Okamoto, Ms. Y. Ito and all the members of the Laboratory of Public Health Nutrition, Nara Women’s University, for the food record data classification. The authors also thank members of the JPHC-NEXT Protocol Validation Study Group for various cooperation of the surveys, including subject recruitment: S. Tsugane (Principal Investigator), M. Inoue, S. Sasazuki, M. Iwasaki, N. Sawada, T. Yamaji, T. Shimazu, H. Charvat, A. Noda, A. Hara, I. Mishiro, Y. Ishii, Y. Shinozawa and J. Umezawa (National Cancer Center, Tokyo, Japan); T. Takahashi (JA Hiraka General Hospital, Yokote, Japan); Y. Ito (Akita Prefectural Yokote Public Health Centre, Yokote, Japan); K. Kobayashi (Nagano Prefectural Saku Public Health Center, Saku, Japan); H. Iso (Osaka University, Suita, Japan); J. Ishihara (Azabu University, Sagamihara, Japan); Chikusei City and Ibaraki Prefectural Chikusei Public Health Centre, Chikusei, Japan; and K. Nakamura, J. Tanaka, K. Kitamura, and R. Takachi (Niigata University, Niigata, Japan).
This work was funded by a grant from the Ministry of Agriculture, Forestry and Fisheries commissioned study, ‘Project for the Realisation of Foods and Dietary Habits to Extend Healthy Life Expectancy’ Grant Number JPJ009842, the National Cancer Centre Research and Development Fund (2011–) and the Funds for Integrated Promotion of a Social System Reform and Research and Development by the Ministry of Education, Culture, Sports, Science and Technology of Japan (2011–2013).
All authors contributed to the study conceptualisation and design. The material preparation, data collection and data analysis were performed by F. O., R. T., J. I., M. Y., S. M., Y. I., K. K., K. N., J. T., T. Y., H. I., M. I., S. T. and N. S. The first draft of the manuscript was written by F. O., and all the authors reviewed previous versions of the manuscript. All authors read and approved the final manuscript.
The authors declare no competing interests.
Supplementary material
For supplementary material/s referred to in this article, please visit https://doi.org/10.1017/S0007114522002653


