

The first part of this volume provided a thorough description of where Benin stands in terms of economic, social, political, and institutional development. Chapter 1 briefly reviewed the country’s deep historical legacies and reviewed its recent political history, insisting on the implications of the tipping-over from the Marxist–Leninist period to the present liberal political and economic regime. Chapter 2 summarised Benin’s main economic development challenges, especially the limitations of the two current major activities, cotton exports and cross-border trade with Nigeria, as potential development engines, the lack of dynamism of the rest of the economy, and the heavy dependence on foreign financing. Benin has underperformed against other sub-Saharan countries, in terms of growth and poverty reduction, over the last twenty years. Given the growth of the population, the prospects for improving Benin’s standard of living and providing decent jobs for newcomers to the labour force in the next twenty years look dim. Chapter 3 focused on the quality of institutions, implicitly seen as an important determinant of the development potential of a country. It reviewed the perceptions held by different types of experts regarding the way institutions work in Benin, pointing to several major weaknesses, most notably a high level of corruption, a dysfunctional public management system, and an excessive degree of informality.
The main points made in those three chapters are closely related. The binding constraints identified in Chapter 2 and in other growth diagnostic exercises have clear roots in existing institutional weaknesses, and the state of institutions is strongly dependent on the political economy of policy making and institutional reform. The three chapters in Part I of this study provided a thorough description of those three aspects of development in Benin, without, except occasionally, really getting into the mechanics that closely link them together. It is now time to do this, in order to establish later on a diagnostic of how the way institutions work in Benin hinders development, and to explore possible directions for reform.
Such an analysis of the complex three-way relationship between political economy, institutions, and economic development cannot be conducted at the aggregate economic level – it would be extremely artificial. Institutions affect economic development through their role in the functioning of sectors or activities, public or private, that are key for economic development. In turn, it is the revenue from these activities and the way it is distributed among actors, whether individual or collective, as well as the relative political power of these actors, that lead to institutions being maintained as they are, or to attempts to reform them. The aim of Part II of the institutional diagnostic aims precisely to understand better this relationship and the central role of institutions in it, through deep-dive analyses of specific economic sectors and political economy practices.
Five thematic studies were undertaken with this objective in mind. The selection of themes was very much guided by the descriptive analysis in the preceding chapters and the major development challenges that it uncovered. Quite naturally, these themes include the functioning of the two major sectors of activity in Benin: cotton production and exports, and the illegal cross-border trade with Nigeria. As far as public management or state capacity is concerned, the choice has been to focus on the tax administration, singled out in many studies as particularly inefficient despite its key role in generating revenues for public investment. The reform of land laws launched in 2013 provides an opportunity for studying an attempt at modifying a key traditional institution in a country with an agricultural comparative advantage and a strong urbanisation drive. Finally, the political economy aspect of economic management, whose crucial importance has been stressed on various occasions in the previous chapters, is approached through a rather original study of the financing of electoral campaigns by the business sector and the rewards offered by politicians to their private sponsors.
The thematic studies are authored by Beninese or foreign scholars with a deep knowledge of Benin. Each study is complemented by a discussion by another scholar, with the aim of broadening the reflection and often bringing to it some knowledge and experience that go beyond Benin.
I Introduction
A large number of studies show that patron–client relationships between politicians and voters deter democratisation and development (Bardhan and Mookherjee, Reference Bardhan and Mookherjee2017; Gallego et al., Reference Gallego, Li and Wantchekon2018; Robinson and Verdier, Reference Robinson and Verdier2013; Stokes, Reference Stokes2005; Stokes et al., Reference Stokes, Dunning, Nazareno and Brusco2013; Wantchekon, Reference Wantchekon2003). However, while most studies focus on the interaction between politicians and voters, and more recently on the role of political brokers,Footnote 1 they often fail to characterise the influence of interest groups, particularly firms, on political distortions.
The consequences of leaving aside the role of firms in studies of patron–client relationships between politicians and voters are twofold. First, by assuming that sponsoring interests and political parties are unified actors that hold the same incentive structure, studies fail to recognise the independent effect of the political connections firms and politicians on governance, particularly on corruption.
Second, the clientelism literature has understudied firms’ strategic decision-making when facing political uncertainty: firms might undermine democratic consolidation – which thrives with electoral uncertainty – through increasing levels of intervention, corruption, and capture. In other words, democracy thrives with electoral uncertainty through political turnover. However, electoral uncertainty also leads to higher financial risk by sponsoring firms.
We show that as electoral uncertainty increases so does the incentive for firms to mitigate financial risk through the appointment of cronies to key government positions, making politicians irrelevant to policy implementation. In other words, increasing risk leads firms to arrange contracts with candidates that replace political intermediaries with direct patrons. Patrons then act as electoral risk-mitigating tools for special interests.
From the latter, demand-side viewpoint, as electoral uncertainty, politicians’ electoral power diminishes vis-à-vis other political contenders, decreasing their bargaining power at the politician–firm contractual arrangement phase, allowing stronger forms of capture.
In that regard, this chapter uses a novel database on contractual arrangements between politicians, political brokers, and businesspeople in Benin to investigate the way the nature of these arrangements depends on the level of political competition. To do so, the chapter pursues four objectives.
First, we propose a reconfiguration of the clientelism and political distortion literature by bringing it together with the ‘political connection’ and clientelism literatures. The cronyism and special interests and lobbying literatures have moved separately from the clientelism literature and have focused on showing, among other things, that political distortions from clientelism are ‘fundamentally different in nature from elite capture’ (Bardhan and Mookherjee, Reference Bardhan and Mookherjee2012, p. 2). With regard to distributional politics, for instance, clientelism is typically progressive, as poor voters are willing to sell their votes at a lower ‘price’. Capture is regressive, as richer interest groups are willing/able to pay more. Moreover, clientelism decreases public goods allocation by favouring private use of public resources, while the implications of capture for public goods remains ambiguous and highly dependent on interest groups’ preference and type. In other words, the special interest literature has stressed that while clientelism and capture represent important forms of political distortion and institutional weakness, especially in developing countries, they are qualitatively different. However, by doing so they have overlooked what politicians do with the financial and non-financial resources provided by firms, and thus they have theoretically misspecified their utility function, and the effect of electoral constraints on firms’ investment maximisation problem. Consider, for instance, that politicians’ strategies of voter mobilisation have to be financed. Thus, campaign finance affects the decision to choose one mobilisation strategy over another.Footnote 2
Second, we characterise empirically the existent firm–politician–broker–voter contractual arrangement, focusing mainly on the relationship between the gifts/resources given to politicians and the different payback demands established by corporations. The chapter uses a novel database on contractual arrangements between politicians, political brokers, and (local and foreign) businesspeople in Benin to investigate the nature of these arrangements and their dependence on the degree of electoral competition. Obtaining information on the underlying ‘sponsoring system’ is difficult, and to our knowledge no study has tried to depict the bilateral relation in terms of resources and pay cheques between firms and national and local politicians. To do this, we carried out structured interviews with key political actors to build a contractual-level dataset covering Benin’s twelve departments and twenty-four electoral districts from 1991 to 2018, for legislative and municipal-level elections. The results allow us to construct national- and local-level contractual arrangements between politicians, political brokers, and firms, including both the financial amounts given to politicians as well as specific concessions granted to interest groups.
Third, we look at determinants of the form of firm–politician contracts. To do so, we consider two alternatives. First, we estimate the effect of political competition as proxied by municipal-level winning margins on firms’ strategic decision-making at the local level, controlling for various cross-municipal socio-demographic differences, surveyor, and municipal fixed effects. To push forward causal identification we provide placebo tests on legislative-level elections. Elections for Members of Parliament (MPs) in Benin provides an ideal placebo, since they do not hold control over national- or regional-level procurement and budgeting, and they have no say in national or regional bureaucratic positions. Contrary to other settings, MPs are not allocated to relevant committees in parliament in charge of budgeting, but rely on party and executive lines for general voting patterns in the assembly. Thus, electoral shocks that modify the overall electoral uncertainty faced by MPs should not lead to firms’ stronger preference for more direct forms of state capture or the appointment of cronies to key government positions. Second, we exploit a quasi-exogenous shock introduced by the 2018 electoral reform that – among other features – collapsed the existent multiparty system into a two-party block competition.Footnote 3 The reform allows us to compare those communes and electoral districts with multiple parties competing for office and suddenly collapsed to one of the two proposed party blocks, decreasing electoral competition (our treatment group), to those districts that were already under a de facto two-party system (our control). Our expectation, later confirmed empirically, is that those districts that experience a decrease in electoral uncertainty experience a decrease in firms’ preference for direct forms of state capture. Both empirical strategies then allow us to observe the existent simultaneity of democratic consolidation – which thrives with electoral uncertainty through political turnover – and special interests’ state capture.
Finally, the fourth objective of the chapter is to contribute to the study of institutional reforms that aim to reduce the influence of interest groups and the negative effects of clientelism in developing countries. In particular, we pinpoint the need for multilevel reforms to prevent business interference, limit bureaucratic capture by brokers, promote transparent appointment processes, and strengthen accountability through the promotion of voter civic engagement in Benin.
In fact, since the democratic renewal of Benin in 1991, political actors have initiated reforms aiming to reduce the cost of campaigning. However, the reforms yield mixed results. The attempts include the following. The first was the imposition of campaign spending caps according to election type (presidential, parliamentary, and local). However, the caps have not been respected or enforced. Furthermore, by 1998, a provision in the electoral code removed the verification capacity of the Supreme Court – the institution in charge of the control of campaign spending of candidates and parties. By 1999 a new electoral restriction was introduced forbidding the distribution of campaign gadgets (T-shirts, caps, pens, etc.) with parties’ and candidates’ logos within six months of national elections (presidential and parliamentarian). The electoral change had mixed results, with parties and candidates utilising specific colours for branding instead of logos. Lastly, a limitation of the campaign period to two weeks was established (contrary to countries where there is no limitation at all like Ghana or where the campaign period is long such as Nigeria’s three months). This restriction is supposed to contribute to the reduction of campaign costs. Except for the incumbent, this measure has seemed to be by and large successful.
It is important to note that Benin has three traits that make it an ideal setting in which to study the relationship between economic and electoral risk and firms’ state capture strategies. First, the dynamics of electoral competition and economic power vary substantially across the country’s seventy-seven communes and twelve departments. The winning margins by political party for the commune-level 2015 elections are substantially low (less than 1 per cent). Moreover, Benin can be characterised as a low concentrated party system in terms of vote share. Moreover, between communes and within communes across time we notice large variability in the actions taken by influence groups to achieve their desired outcomes. Second, Benin provides a case of thriving democratisation mixed with poor governance and various degrees of local state capacity, an important mediator to consider when studying politician–private-sector contracts. Lastly, a pseudo-decentralised political system allows for local politicians to have substantial freedom to shape local campaigns and agree to different contractual arrangements with their financial sponsors.
Our results show three main findings. First, around 34 per cent of mayors and city councils competing for municipal-level positions, and deputies competing for legislative seats, face budget constraints in regard to developing their political campaigns. This creates a need to negotiate their budget deficit with businesspeople in order to run for elections, allowing for contracts through narrow commitment over policies. Second, the most recurrent policy concessions made by businessmen are public procurement arrangements (71 per cent of contracts include such concessions), followed by policy commitments related to firms’ interests (46 per cent of cases), and the direct appointment of businessmen’s relatives to public positions (39 per cent of cases). In part, this rank ordering is due to the fact that public procurement allows for firms to cash in and for politicians to keep a share of the procurement (a minimum of 10 per cent in Benin’s case). Note that policy concessions add more than 100 per cent, which implies that contracts contain more than one concession petition.
Most interesting are firms’ strategic decisions when faced with political uncertainty. If incumbents do not comply with the contract with firms, the latter may finance riots against the former to increase economic concessions and payment. Moreover, firms seek to support challengers with contracts that are characterised by higher concessions, increasing the overall control of firms over local governments and national politics. Regarding the estimation of the effect of winning margins on firms’ capture preferences, we find that a 1 standard deviation increase in winning margin decreases the reliance on more direct forms of state capture by –0.1684 standard deviation for municipal-level elections, a result that is significant to the 1 per cent level and robust to surveyor and municipal fixed effects and socio-demographic controls. However, interestingly, positive and non-significant results are found for MPs’ elections, showing that electoral shocks only have an effect on firms’ capture preferences when political actors are relevant for electoral risk management.
Relative to the status quo concession benchmark, when elections become more uncertain due to the introduction of more challengers, firms modify their demands in relation to incumbents. In particular, they rely more heavily on demanding that incumbents’ platform commitments are similar to firms’ interests during the electoral campaign (a prevalence of 68 per cent), while decreasing the proportion of public procurement petitions to 67 per cent, holding second place, followed by an increase in pushing forward the political careers of businessmen’s acquaintances, which reaches an occurrence of 64 per cent. Moreover, in this case of higher electoral uncertainty the influence and control over the recruitment in all public sectors increases from 17 to 51 per cent. Lastly, in the absence of what firms consider a ‘good’ candidate to fund, firms increase their participation in elections by running for election themselves.
These results are tied to those on the effect of Benin’s 2018 electoral reform on party collapse in that electoral uncertainty drives firms’ capture preference. In particular, multiparty districts affected by the reform show a decrease of –0.259 standard deviation on firms’ capture preferences in the 2019 commune-level elections. In other words, as the number of candidates decreases – and thus the cost of bribes – firms rely less heavily on more direct forms of state capture, such as the appointment of firms’ agents or cronies to key government positions. Specifically, firms decrease their use of patronage to move forward the political careers of friends and family members (decrease of –0.437 standard deviation), they decrease their use of patronage of members from the company (–0.436), and they reduce the demands on bureaucratic recruitment control (–0.606). The results are robust to including controls on politician-level characteristics, as well as commune fixed effects. Moreover, we demonstrate that the sample of politicians used show a balance on multiple covariates between districts that hold multiparty competition in the 2015 elections (the treatment) to those with de facto two-party competition (the control). While this balance does not rule out commune- and firm-level differences between treatment and control, they show that the results are not driven by sample selection bias. As with the effect of winning margins on firms’ capture preferences, we also find positive and non-significant effects for legislative-level elections, which provides an important placebo to take into consideration.
We believe that differentiating sponsoring interest groups, politicians, and voters will lead to interesting developments in the clientelism literature. First, this chapter provides an explanation of the coordination between politicians and private interests in order to marginalise poor voters, especially in the face of increasing demands for redistribution. Second, it makes it possible to explain the paradoxical result of stronger degrees of direct involvement of interest groups through personal nominations in highly democratised (i.e. highly uncertain) settings. Third, the chapter helps increase our understanding of the variation in strategic decision-making of interest groups between different levels of uncertainty across time and space, either caused by variation in electoral risk or interest groups’ risk. In the spirit of Kitschelt and Wilkinson (Reference Kitschelt and Wilkinson2007), where politicians prefer to use clientelism when they can predict voters’ electoral conduct and elasticity, interest groups prefer to rely on direct capture strategies when uncertainty is high, and they rely on sponsoring political campaigns only when politicians can predict voters’ behaviour well. This point is closely related to the literature on the link between economic and political structural conditions and strategic choices made by firms to mobilise citizens (Diaz-Cayeros et al., Reference Diaz-Cayeros, Estevez and Magaloni2016; Magaloni et al., Reference Magaloni, Diaz-Cayeros, Estevez, Kitschelt and Wilkinson2007).
This chapter is closely related to work on mapping de facto institutions. Starting with Dahl’s (Reference Dahl1961) description of the power structure in New Haven and moving to more recent literature on family networks and politicians (for example, Cruz et al., Reference Cruz, Labonne and Querubin2017; Querubin, Reference Querubin2016), there has been a need to characterise the full power dynamics affecting electoral politics. Moreover, this chapter speaks directly to the large literature on interest groups and cronyism. The crony governance literature focuses on systems in which economic policies are chosen with the goal of benefiting connected actors (Klor et al., Reference Klor, Saiegh and Satyanath2017). Our study, in contrast, focuses on showing how interest groups develop crony networks in local institutions as the degree of uncertainty increases. Most importantly, this chapter connects the seemingly distant but actually highly related literatures of clientelism and cronyism, showing that electoral risk encountered in clientelism settings affects firms’ (sponsors’) strategic decisions to create and fund networks in high-level bureaucratic and political positions.
This chapter is more closely related to the literature on elite capture of local institutions in developing countries. Ch et al. (Reference Ch, Shapiro, Steele and Vargas2018), for example, show that illegal armed interest groups in Colombia – both left-wing guerrilla forces and right-wing paramilitary groups – shaped policy outcomes by influencing local officials who implemented the groups’ policy preferences. Likewise, Sanchez-Talanquer (Reference Sanchez-Talanquer2018) and Pardelli (Reference Pardelli2018) find that landowners transform local institutions in their favour by appointments to key local bureaucracy and political positions, which result in pushing forward beneficial policies in terms of taxes, property rights, and property land values, and increase the relative power of local governments vis-à-vis higher levels of government. This chapter shows how firms use various strategies to control local institutions, and not only promote policy change through violence (as in the case of Colombia), policy change, political campaign sponsoring, or direct appointments to bureaucratic positions.
II Theory and Testable Hypotheses
Consider Anderson et al.’s (2015) clientelistic relationship analysis in India, where elite minorities can undermine policies that push forward redistribution in favour of the poor majority. In this case, the capture mechanism runs through land ownership dominance and the use of cultural hierarchies to achieve political control. However, while empirical evidence shows that elites undermine democracy even in a non-coerced setting, the existent strategic relationship between firms and politicians is not clearly described and is actually not considered. There could be at least two possible types of relationships between firms and politicians, depending on the source of uncertainty. First, politicians could renege on delivering investments to sponsors. Under this setting firms face uncertainty due to politicians’ type, which allows a cheap-talk strategic setting: politicians act as agents who hold a private information advantage in respect to their sponsors or the principal, and ‘bad’ politician types renege on their contractual arrangement or benefit from their advantageous information standpoint. Second, firms might face uncertainty coming not from politicians’ type but from the political environment and institutional design. From a supply-side standpoint – that is, from the perspective of political sponsors like firms – high electoral competition leads to high risk on campaign financial investments. As a response to higher financial risk, firms increase their demand for more direct forms of capture, moving from procurement demands to requesting political appointments and recruitment bureaucratic control. Cronies are then selected for such positions, bypassing politicians entirely.
From a demand-side standpoint, high electoral competition implies politicians’ bargaining power is weaker at the time of negotiating the terms and conditions of the contractual arrangements with firms. Not only is there at least one other candidate with similar electoral strength that could compete for funding, but electoral competition increases both the marginal cost of a vote as well as total campaign costs. The result is needy politicians facing risk-averse firms who move to stronger preferences for direct forms of state capture through the appointment of key government positions.
What does the contract look like? Sponsors fund politicians in order to receive a payback. The payback takes a wide range of forms, running from more indirect to more direct forms of state hijacking: refunds on financial investment, policies and platform changes, public procurement, control of budget lines, patronage, and bureaucratic recruitment control.
III Data and Methodology
To test how political competition affects firms’ uncertainty and modifies their preference for more direct forms of state capture, we study the relationship between international and domestic companies and electoral politics at various levels of aggregation – national and local – in Benin, covering all elections from 1991 to 2019. Benin exemplifies a thriving nascent democracy, with poor governance and economic performance. While being what has been labelled a successful democracy, Benin has been characterised by a high level of corporate capture of local and national politics. As noted by Fujiwara and Wantchekon (Reference Fujiwara and Wantchekon2013), the country’s institutional development has allowed for clientelistic promises to narrow groups of citizens and has favoured private use of local government resources. Benin contains over 3,000 villages (called quartiers) in seventy-seven communes, and they vary widely in the type of productive activities carried out, as well as in the political competition in a multiparty system.
Our methodology exploits two sources of variation. First, variation in firms’ political investment or contractual choice. To measure this, we rely on a novel database on contractual arrangements between politicians, political brokers, and firms in Benin. In particular, we carried out structured interviews with key players, including campaign managers, CEOs of politically connected firms, local brokers, and politicians and candidates, among others.Footnote 4 The result is a dataset with a sample of more than 300 Beninese politicians (deputies, ministries, mayors, etc.), as well as political brokers, covering Benin’s twelve departments and seventy-seven communes.
The data collection took place in Beninese constituencies with targeted populations from 6 February to 21 February 2019. Given the difficulty in identifying potential subjects to survey, a snowball sampling technique (or chain-referral sampling) was used. This is a non-probability sampling technique where existing politicians surveyed recruited future subjects from among their acquaintances. Prior to the interviews, the controller – in charge of coordinating interviews – arranged an appointment with the politician via a phone call to establish contact between the latter and the enumerators to prepare the interview. Then, enumerators met the politician alone, or in a team of two or three, depending on the category (national or local) and/or the agenda of the politician to conduct the interviews. Overall, 311 political actors and brokers were surveyed: 256 politicians, including 191 local politicians (mayors, councillors, etc.), and 83 national politicians (deputies, ministries, cabinets staff, etc.), with 18 who have run for both local and national positions, and 55 brokers (18 per cent of the full sample). Given that elections were scheduled for March and April 2019, we were able to acquire information on contemporary campaigns as well as past ones since 1991. Of the full sample, 76 per cent were running as candidates for the next elections. This dataset allowed us to depict existent politician–firm contracts (such as funding amounts and sources, for instance) and contract types, ranging from those that demand policy and procurement concessions from politicians, to those that seek to influence political platforms during campaign periods, and those that seek to influence direct appointments of firms’ acquaintances, or direct intervention through control of budget lines or key bureaucratic positions.
It is important to note some overall characteristics of the politicians in the database. First, 54 per cent of the 215 surveyed individuals who were running for the next election were running for municipal-level elections, while the rest were competing for legislative ones. On average, individuals are 47 years of age and hold a high variety of education degrees, especially high-level ones, with the majority having either undergraduate or graduate degrees. Moreover, only 27 per cent are first-time runners and those who have recurrently participated in elections in the past have participated in a large number of different types of elections, from commune- to presidential-level ones. It is important to note that Benin is characterised as a highly dynamic electoral setting: more than half of the surveyed politicians have switched political parties. A wide majority have switched not due to opposition to their former political parties, but in opposition to party platform changes. In other words, the highly dynamic party system hides a seemingly conservative underlying ideology spectrum. Noteworthy, additionally, is the fact that almost all politicians and political brokers (87 per cent) are members of a political party. Lastly, it is important to see that of the full sample, 36 per cent say they have held private positions in the past.
The second source of variation we exploit is national and local variation in electoral uncertainty. We rely on two measures of electoral uncertainty: first, the use of winning margins; second, the number of political candidates contending for office. We believe the former constitutes a benchmark measure of electoral competition, given that winning margins are positively related to a candidate’s likelihood of winning office or the risk associated with a candidate losing. Related to the latter, as the number of political candidates increases, so does the total amount of bribes that firms need to allocate in order to achieve their desired policy preference. In other words, the number of candidates represents a cost of contractual arrangements. Both the costs and electoral competition form part of what we define as electoral uncertainty in this particular setting. As an example, the highest level of electoral uncertainty will be that where low winning margins coincide with a plethora of political candidates running for office with relatively equal electoral strength.
For identification we rely on two empirical tests, given these two sources of variation, firms’ preferences for direct capture and electoral uncertainty. First, we analyse the relationship between winning margins and firms’ state capture preferences as stated in contractual arrangements. In particular, we estimate the following ordinary least squares (OLS) specification:
 (1)
(1)where yd is either a dummy of any of the preferences for state capture or intervention pushed by firms on politicians, including demanding a refund of resources, and demanding policy and programme modification during a campaign; demanding support for future candidates close to firms; demanding a local budget line; demanding public procurement; patronage both for close family members and for friends or members of the firm; and taking control of bureaucratic recruitment control in a district d; Winning Margind is a continuous variable on the winning margin of the incumbent relative to the second contender for the 2015 commune-level elections; Xd is a vector of commune-level control variables;Footnote 5 and Wi is a vector of politician-level characteristics, listed in Table 4.1, including age, education, title, former occupation, political experience, a dummy to account for party switch and reasons for such a switch, and electoral political experience as candidates in different types of elections. We also include a district fixed effect, γd, to account for any district-level time-invariant heterogeneity. Thus, our estimates account for the change in firms’ preferences for direct forms of state capture in districts that have experienced high electoral uncertainty, as proxied by smaller winning margins. We report robust standard errors (SEs) throughout, clustered at the electoral district level.Footnote 6
Table 4.1 Balance table, list experiment on politicians’ affiliation with firms
| Mean control | Mean treatment | Diff. | Diff. SE | p | |
|---|---|---|---|---|---|
| Title: politician (=1) or broker (=0) | 0.836 | 0.796 | 0.04 | 0.047 | 0.395 |
| Deputy | 0.047 | 0.071 | –0.024 | 0.028 | 0.379 |
| Minister | 0.005 | 0 | 0.005 | 0.007 | 0.498 |
| Mayor | 0.066 | 0.02 | 0.045 | 0.027 | 0.093 |
| Municipal council member | 0.333 | 0.306 | 0.027 | 0.057 | 0.635 |
| Cabinet director | 0.005 | 0.031 | –0.026 | 0.014 | 0.06 |
| Other | 0.545 | 0.571 | –0.027 | 0.061 | 0.66 |
| Age | 49.286 | 44.122 | 5.164 | 1.314 | 0 |
| Years living in region | 38.756 | 35.122 | 3.633 | 2.096 | 0.084 |
| No education | 0.019 | 0.01 | 0.009 | 0.015 | 0.578 |
| Elementary | 0.038 | 0.02 | 0.017 | 0.022 | 0.427 |
| College 1st cycle | 0.15 | 0.041 | 0.109 | 0.039 | 0.005 |
| College 2nd cycle | 0.155 | 0.122 | 0.032 | 0.043 | 0.451 |
| University 1st cycle | 0.169 | 0.153 | 0.016 | 0.045 | 0.725 |
| University 2nd cycle | 0.254 | 0.367 | –0.114 | 0.055 | 0.04 |
| Graduate | 0.216 | 0.286 | –0.07 | 0.052 | 0.181 |
| Member of political party | 0.967 | 0.98 | –0.012 | 0.021 | 0.544 |
| Participated in elections as candidate | 0.751 | 0.643 | 0.108 | 0.055 | 0.049 |
| Participated in commune-level elections | 0.881 | 0.857 | 0.024 | 0.049 | 0.627 |
| Participated in legislative-level elections | 0.362 | 0.397 | –0.034 | 0.072 | 0.635 |
| Participated in presidential-level elections | 0.013 | 0.016 | –0.003 | 0.017 | 0.845 |
| No. of participations in commune elections | 1.5 | 1.429 | 0.071 | 0.127 | 0.575 |
| No. of participations in legislative elections | 0.562 | 0.651 | –0.088 | 0.141 | 0.531 |
| No. of participations in presidential elections | 0.006 | 0.063 | –0.057 | 0.041 | 0.163 |
| Party switch | 0.476 | 0.625 | –0.149 | 0.109 | 0.17 |
| Party switch 2 | 0.739 | 0.667 | 0.072 | 0.141 | 0.61 |
| Ideology reason | 0.439 | 0.595 | –0.155 | 0.071 | 0.029 |
| Poor project definition | 0.291 | 0.365 | –0.074 | 0.066 | 0.263 |
| Personal interest | 0.534 | 0.432 | 0.101 | 0.071 | 0.156 |
| Opposition to movement | 0.568 | 0.514 | 0.054 | 0.071 | 0.448 |
| Movement towards opposition | 0.149 | 0.149 | 0 | 0.051 | 1 |
| Running for next elections (2019) | 1.319 | 1.286 | 0.034 | 0.057 | 0.554 |
| Running for commune elections (2019) | 0.724 | 0.671 | 0.053 | 0.066 | 0.429 |
| Running for legislative elections (2019) | 0.414 | 0.514 | –0.1 | 0.072 | 0.166 |
| Running for presidential elections (2019) | 0 | 0.029 | –0.029 | 0.014 | 0.041 |
| First-time runner | 0.255 | 0.3 | –0.045 | 0.065 | 0.49 |
| Holds political position | 0.779 | 0.724 | 0.055 | 0.052 | 0.293 |
| Holds private position | 0.352 | 0.388 | –0.036 | 0.059 | 0.545 |
Note, however, that this specification does not allow us to rule out time-variant and other sources of potential endogeneity. To push forward the identification we estimate equation (1) for municipal-level elections and run a placebo test on legislative-level elections. Elections for MPs in Benin provide an ideal placebo, since MPs do not exercise control over national- or regional-level procurement and budgeting, and they have no say in national or regional bureaucratic positions. In contrast to other settings, MPs are not allocated to relevant committees in parliament in charge of budgeting, but rather they rely on party and executive lines for general voting patterns in the assembly. Thus, electoral shocks that modify the overall electoral uncertainty faced by MPs should not lead to firms’ stronger preference for more direct forms of state capture or the appointment of cronies to key government positions.
As a second identification strategy, we use quasi-exogenous variation introduced by the electoral reform in Benin in 2018, which collapsed the multiparty system to an effective two-party block competition.
The reform allows for the existence of multiple parties, but forces parties to join a block to compete, and no more than two blocks can contend for any political position in the country. The reform allows us to compare those communes (or seats) that had multiple parties competing for office and higher degrees of electoral competition and suddenly were affected by the reform (our treatment group) to those communes that already had an effective two-party system (our control). The expectation is that communes affected by the electoral reform reduce the number of effective political parties and thus candidates, decreasing the overall financial costs of bribery faced by sponsoring firms, making them less desirous of more direct forms of state intervention. Interestingly, the number of candidates is highly negatively correlated with the winning margin, and positively correlated with voter turnout for the commune-level 2015 elections (see Figures 4.A.1a–4.A.1d in the Appendix). Thus, while we believe that the effective number of parties (and candidates) acts as a proxy for the capture costs of firms, it also represents an indirect measure of electoral competition, and thus electoral uncertainty. In short, for the identification of the effect of contract type we will rely on cross-municipal competition variation triggered by quasi-exogenous shocks in electoral competition. Specifically, we estimate an OLS specification at the electoral district level for commune-level elections on the effect of the electoral reform as a quasi-exogenous shock to electoral uncertainty on firms’ strategic capture of government in the current 2019 elections:
 (2)
(2)where yd is a dummy for any of the demands pushed by firms on politicians, including demanding a refund of resources, demanding policy and programme modification during the campaign, demanding support for future candidates close to firms, demanding control over the local budget line, demanding control over public procurement, demanding patronage both for close family members and for friends or members of the firm, and taking control of bureaucratic recruitment control in a district d; Electoral Reformd is a dummy that takes a value of 1 if a commune-level electoral district had more than 2.5 effective parties, as measured by a Molinar Index for the 2015 commune-level elections, and 0 otherwise;Footnote 7 Xd is a vector of commune-level control variables;Footnote 8 and Wi is a vector of politician-level characteristics, listed in Table 4.1, including age, education, title, former occupation, political experience, a dummy to account for party switch and reasons for such a switch, and electoral political experience as candidates in different types of elections. We also include the district fixed effect, γd, to account for any district-level time-invariant heterogeneity. We are thus working with between-electoral district variation in firms’ government capture, controlling for a range of district- and politician-level characteristics. Hence, our estimates account for the change in firms’ strategies in districts that experienced less electoral uncertainty than the electoral districts mean. We report robust standard errors throughout, clustered at the electoral district level, as done with equation (1).Footnote 9
For both equations (1) and (2) we construct a firm capture index with all available demands made by firms in their contractual arrangements with politicians. The index ranges from 0 to 6, with 6 being the highest degree of capture. In particular, capture demands are categorised in the following way: financial refunds get a value of 0; policies and programme changes a value of 1; support for future candidates close to firms’ interests a value of 2; control of a budget line a value of 3; public procurement a value of 4; patronage 5; and, lastly, bureaucratic recruitment control a value of 6. We believe this ordering fits well the notion of increasing capture in firms’ actions as depicted in the Beninese study case.
Our identifying assumption with this approach is that electoral uncertainty variation occurs due to a quasi-exogenous shock conditionally independent from future firms’ capture demands. Our controls tease out district-level dynamics, especially pre-treatment competition levels. One concern, however, is that this approach could simply pick enduring cross-sectional within-electoral district differences, correlated with both electoral uncertainty and firms’ demands. To rule this out we include a set of regressions controlling for firms’ demands in the 2015 election and identify whether pre-treatment demand differences between control and treatment districts are non-existent.Footnote 10 Furthermore, we show that sampled politicians in treatment and control districts do not have statistically different characteristics.Footnote 11 This gives high confidence regarding avoiding sample selection bias, as well as treatment and control similarity. Lastly, as done with the estimation of equation (1), we use MPs’ elections as a placebo test.
A Descriptive Statistics on Campaign Funding
In this section, we provide a short description of the data, based on the preliminary descriptive statistics related to the central tendency of key variables of the study. This is followed by a short discussion. At a first glance at the data we notice that businessmen invested, on aggregate, a total of CFA Franc 7,567,560,000 (US$13,080,443) in the recent electoral campaigns as financial support to politicians, according to the 189 who responded to this question. On average, the former invested, all elections combined, an amount of CFA Franc 40,040,000 (US$69,252) in the campaigns of a candidate. Considering the type of elections and the location, the financial package is about CFA Franc 10,900,000 (US$18,838) and CFA Franc 47,600,000 (US$82,288) for municipal elections, respectively, in rural and urban areas. These figures are higher according to the importance of elections. For instance, CFA Franc 37,300,000 (US$64,470) and CFA Franc 67,600,000 (US$116,842) are invested in legislative campaigns of a candidate in rural and urban locations, respectively.
While political parties’ charters predict CFA Franc 1,500,000 (US$2,592) and CFA Franc 30,000,000 (US$51,853) for municipal and legislative campaigns, out of the 27 per cent of those who really know these amounts, 34 per cent find it insufficient for the corresponding elections, including those who ran or will run for commune and legislative elections. Note, however, in Figure 4.1a that those who believe politicians have a ‘reasonable amount of funding’ or ‘more than needed’ greatly surpass the campaign costs of those that believe funds are insufficient.

Figure 4.1a Campaign cost by type of election and evaluation of funds
Actually, as noted in Figure 4.1b, we see that those who believe that ‘campaign funds are reasonable or more than needed’ believe that campaign costs should be decreased substantially, especially in commune-level elections. Subsequently, on average, they reported CFA Franc 115,000,000 (US$198,772) and CFA Franc 163,000,000 (US$281,691) as the amount necessary for legislative elections in rural and urban constituencies, respectively.

Figure 4.1b Ideal vs real campaign costs, by election type and evaluation of funds
Furthermore, business monetary involvement in electoral campaigns is substantial. Figures 4.2a–4.2b show a striking result: for commune-level elections, firms account for 54.3 per cent of the total campaign costs on average. More impressive is the fact that 15.7 per cent get funding from businesses that surpass the total campaign costs, sometimes holding budgets up to three to four times more than needed. These results are even greater for legislative-level elections, with firms accounting for 76.3 per cent of total campaign costs.Footnote 12 In other words, as we move up the federalist ladder in Benin we notice more business intervention in monetary terms.

Figure 4.2a Ratio of firms’ funding to campaign costs by type of election: Community level

Figure 4.2b Ratio of firms’ funding to campaign costs by type of election: Legislative level
IV Results
The former evidence points to the high intervention of businessmen in elections at different levels. However, the actual proportion of politicians affiliated with firms suffers from social desirability bias and thus politicians might not truthfully answer sensitive questions, creating a measurement challenge. Moreover, given the complexity of businessmen’s interests, it is difficult to capture such dynamics either observationally or through surveys.
One way to address such challenges is the use of a list experiment. As noted by Blair and Imai (Reference Blair and Imai2012) and a large range of studies (Biemer et al., Reference Biemer, Jordan, Hubbard, Wright, Kennet and Gfroerer2005; Gonzalez-Ocanto et al., 2010; Jamison et al., Reference Jamison, Karlan and Raffler2013; Kane et al., Reference Kane, Craig and Wald2004; Kuklinski et al., Reference Kuklinski, Sniderman and Knight1997), this methodology protects respondents’ confidentiality, allowing them to reveal sensitive information. The underlying mechanism in a list experiment is to compare two groups: a treatment and a control group. The control group is asked to report the number of non-sensitive items called a short list, while the treatment group is asked to report the number on that same short list plus an additional sensitive item. The average response for each group is estimated and differenced out. The difference in means represents the proportion of the population for whom the sensitive item applies. Design effects are tested, as well as ceiling and floor effects, to validate the list experiment estimate (for details, see Ch et al., Reference Ch, Hounkpe, Wantchekon, Bourguignon, Houssa, Platteau and Reding2019).
Specifically, the list experiment question tested to measure politicians’ affiliation to business interests was the following:
How many of the following five individuals or groups do you consider yourself politically affiliated with? Please indicate HOW MANY in total: I don’t want to know which ones, only how many of them.
The list of answers that the control groups received included:
the mayor of this commune;
a member of the communal council;
the prefect of this department;
the MP; and
the president/president’s political party.
The list that the treatment group received included the following sensitive item (in the sixth position on the list):
national or local businessman/firm/business group.
In order to separate respondents into the treatment and control groups, we used their birthday months. Those born in January, March, May, July, September, and November were assigned to the control group, while those born in February, April, June, August, October, and December made up the treatment group.
Table 4.1 shows the balance between the treatment and control groups of the list experiment across a wide range of covariates on politician characteristics. Out of thirty-eight covariates we notice a significant difference in four, giving us confidence regarding the balance to the 10 per cent level.
Table 4.2 shows the results of the list experiment by running a t-test comparing the treatment and control means on politicians’ affiliation with firms’ interests. The difference shows a prevalence of firms’ interests of 48.1 per cent, a difference significant to the 1 per cent level. In other words, almost half of politicians and political brokers in Benin are affiliated with either local or national business interests.
Table 4.2 List experiment: Politicians’ affiliation with local and national business interests
| Mean control | Mean treatment | Diff. | Diff. SE | p | |
|---|---|---|---|---|---|
| Affiliation with firm/business interest | 3.54 | 4.02 | −0.481 | 0.167 | 0.004 |
| Commune/municipal elections: Affiliation with firm/business interest | 3.576 | 4.406 | −0.83 | 0.275 | 0.003 |
| Legislative elections: Affiliation with firm/business interest | 3.683 | 4.139 | −0.456 | 0.281 | 0.109 |
If we distinguish by election type, we notice that business affiliation is higher in commune municipal elections, with a proportion of 83 per cent, significant to the 1 per cent level. Legislative elections show a lower proportion, of 45.6 per cent, with a significance barely reaching 10 per cent. In other words, as we move up the administrative ladder, we notice a decrease in business intervention. A plausible explanation to explore in the future is that business interference might be higher at lower administrative levels due to national government lack of monitoring and state capacity.
It is important to compare these results with those shown in Table 4.3. This table presents a list of different sources of funding provided to politicians for commune and legislative elections. Numbers represent the percentage of funds coming from a particular source. Related to business interests we note that firms, local and national, account for 16 per cent of total funding at the commune level and 17 per cent for legislative elections. Both estimates contrast significantly with the results of the list experiment, showing the effect of social desirability bias.Footnote 13
Table 4.3 Clientelist contracts – descriptive statistics
| Mean | SD | Min | Max | N | |
|---|---|---|---|---|---|
| Firm–politician contract | |||||
| Sources of funding: Commune level | |||||
| National funding | 0.01 | 0.04 | 0 | 0 | 117 |
| Department funding | 0 | 0.02 | 0 | 0 | 117 |
| Party/party coalition funding | 0.31 | 0.26 | 0 | 1 | 117 |
| President/president’s party funding | 0.21 | 0.27 | 0 | 1 | 117 |
| Local firms funding | 0.1 | 0.11 | 0 | 0 | 117 |
| National firms funding | 0.06 | 0.1 | 0 | 0 | 117 |
| Local politicians funding | 0.05 | 0.12 | 0 | 1 | 117 |
| Local/national unions funding | 0.01 | 0.02 | 0 | 0 | 117 |
| Percentage coming from others | 0.39 | 0.26 | 0 | 1 | 75 |
| Sources of funding: Legislative level | |||||
| National funding | 0.04 | 0.12 | 0 | 1 | 96 |
| Department funding | 0 | 0.01 | 0 | 0 | 96 |
| Party/party coalition funding | 0.31 | 0.24 | 0 | 1 | 96 |
| President/president’s party funding | 0.2 | 0.2 | 0 | 1 | 96 |
| Local firms funding | 0.09 | 0.11 | 0 | 1 | 96 |
| National firms funding | 0.08 | 0.1 | 0 | 0 | 96 |
| Local politicians funding | 0.03 | 0.06 | 0 | 0 | 96 |
| Local/national unions funding | 0 | 0.02 | 0 | 0 | 96 |
| Percentage coming from others | 0.38 | 0.27 | 0 | 1 | 63 |
| Types of funding: Commune level | |||||
| Financial instruments | 0.78 | 0.42 | 0 | 1 | 117 |
| Goods/non-financial services | 0.56 | 0.5 | 0 | 1 | 117 |
| Economic/political advisers | 0.23 | 0.42 | 0 | 1 | 117 |
| Labour for campaign | 0.35 | 0.48 | 0 | 1 | 117 |
| Provision of space | 0.45 | 0.5 | 0 | 1 | 117 |
| Support for advertisement | 0.49 | 0.5 | 0 | 1 | 117 |
| Other forms of financing | 0.02 | 0.13 | 0 | 1 | 117 |
| Types of funding: Legislative level | |||||
| Financial instruments | 0.82 | 0.38 | 0 | 1 | 96 |
| Goods/non-financial services | 0.65 | 0.48 | 0 | 1 | 96 |
| Economic/political advisers | 0.25 | 0.44 | 0 | 1 | 96 |
| Labour for campaign | 0.48 | 0.5 | 0 | 1 | 96 |
| Provision of space | 0.46 | 0.5 | 0 | 1 | 96 |
| Support for advertisement | 0.44 | 0.5 | 0 | 1 | 96 |
| Other forms of financing | 0.02 | 0.14 | 0 | 1 | 96 |
| Firm–politician contract | |||||
| Payback time: Commune level (=1 after election, 0=before) | |||||
| Policies | 0.71 | 0.46 | 0 | 1 | 49 |
| Public procurement | 0.63 | 0.49 | 0 | 1 | 91 |
| Patronage | 0.55 | 0.5 | 0 | 1 | 47 |
| Patronage from firm | 0.33 | 0.48 | 0 | 1 | 45 |
| Support future candidate | 0.47 | 0.51 | 0 | 1 | 17 |
| Programme modification | 0.5 | 0.52 | 0 | 1 | 12 |
| Refund | 1 | 0 | 1 | 1 | 3 |
| Recruitment control | 0.26 | 0.45 | 0 | 1 | 19 |
| Budget line | 0.4 | 0.55 | 0 | 1 | 5 |
| Payback time: Legislative level (=1 after election, 0=before) | |||||
| Policies | 0.79 | 0.42 | 0 | 1 | 42 |
| Public procurement | 0.68 | 0.47 | 0 | 1 | 73 |
| Patronage | 0.62 | 0.49 | 0 | 1 | 37 |
| Patronage from firm | 0.47 | 0.51 | 0 | 1 | 40 |
| Support future candidate | 0.58 | 0.51 | 0 | 1 | 19 |
| Programme modification | 1 | 0 | 1 | 1 | 8 |
| Refund | 0.33 | 0.52 | 0 | 1 | 6 |
| Recruitment control | 0.33 | 0.49 | 0 | 1 | 12 |
| Budget line | 0.5 | 0.55 | 0 | 1 | 6 |
| Politician–voter contract | |||||
| Commune level | |||||
| Mass communication policy and agenda | 0.95 | 0.22 | 0 | 1 | 117 |
| Political appointments | 0.38 | 0.49 | 0 | 1 | 117 |
| Vote-buying attempt | 0.5 | 0.5 | 0 | 1 | 117 |
| Non-conditional transfer (NCT) | 0.24 | 0.43 | 0 | 1 | 117 |
| Ethnic strategy | 0.44 | 0.5 | 0 | 1 | 117 |
| Legislative level | |||||
| Mass communication policy and agenda | 0.9 | 0.31 | 0 | 1 | 96 |
| Political appointments | 0.42 | 0.5 | 0 | 1 | 96 |
| Vote-buying attempt | 0.53 | 0.5 | 0 | 1 | 96 |
| NCT | 0.38 | 0.49 | 0 | 1 | 96 |
| Ethnic strategy | 0.4 | 0.49 | 0 | 1 | 96 |
A Contracts between Firms and Politicians
A wide variety of types of funding types characterise the contract between firms and politicians in Benin. As noted in Table 4.3, firms hold a wide range of resources available for politicians. Besides the primacy of financial instruments and non-pecuniary goods and services provided by firms, politicians utilise advisers and labour to support their political campaigns. A large proportion of politicians (45 per cent for commune elections and 46 per cent for legislative ones) also utilise space provided by firms for their political campaigns.
Most interestingly, the results show that public procurement arrangements have a prevalence in firm–politician contracts of 71 per cent, followed by policy commitments narrowed down to businessmen’s interests with a proportion of 46 per cent. In third place comes the appointment to public positions of businessmen’s relatives or people they suggest. Depending on the type of elections, this appointment could be in the local administration as an office head or as a member of the central government (ministry, cabinet chiefs, etc.), with a proportion of 39 per cent. These are the most preferred means for businessmen to recover what they have invested in candidates’ electoral campaigns and to ensure their control over the implementation of policies. In other words, these numbers should be considered the country’s baseline actions by firms.
According to the respondents, businessmen prefer public procurement overall, because of the direct cash flows it generates. Interestingly, they place it in first place because it is also a means for incumbents to make money as they find a way to keep a minimum of 10 per cent of the total amount for themselves, in agreement with the businessmen. It is worth emphasising that the amounts of these public procurements are sometime tenfold greater or even more than the money invested by the businessmen, and it may happen that they execute more than three to five projects during their tenure.
A good illustration of procurement and how effective it is for both actors is the recent scandal involving the building of a new national assembly in Benin: between two offers, one from a Chinese company that is accredited and well recognised for its insight and expertise in the domain, with a value of CFA Franc 14,000,000,000 (US$24,194,397), and another from a national company affiliated with government officials, with a value of CFA Franc 18,000,000,000 (US$31,107,082), the government attributed the procurement to the latter, representing an overspend of CFA Franc 4,000,000,000 (US$6,914,643), which is twice the amount invested by the businessman to support the presidency of the Beninese former President Boni Yayi. Interestingly, this represents tenfold the money (CFA Franc 400,000,000, so US$691,464) the same businessman invested to support the legislative campaigns of a candidate. From these examples it appears clear why businessmen prefer public procurement over the narrow implementation of policies and the appointment of relatives, which might take a bit longer to yield the expected results.
B Contracts between Politicians and Voters
On the contracts between politicians and voters, politicians apply a wide range of strategies to increase public support. As Table 4.3 shows, a large proportion of politicians and political brokers use non-programmatic strategies: half of politicians in commune-level elections utilise vote-buying attempts, while 38 per cent rely on promising political appointments, and 24 per cent use non-conditional transfers to citizens. For legislative elections these numbers increase to 53 per cent for vote-buying attempts, 42 per cent for political appointment promises, and 38 per cent for non-conditional transfers. In the context of Benin, the use of ethnic strategies surges as an important strategy for promoting voter support. Ethnic strategies mostly target promoting policies that benefit the in-group instead of the out-group.
C Political Uncertainty and Firms’ Strategic Decision-Making
If it happens that incumbents do not comply with the deal they have made with businessmen, the latter may finance riots against the former. Sometimes aided by state institutions, firms’ actions affect politicians’ political careers by either causing them to lose future elections or reducing their winning margin. The most noted strategy utilised by businessmen if politicians do not comply with what was specified in the contract is to support challengers who allow for more concessions than the previous politicians, increasing firms’ state capture. In this regard, when the number of candidates increases, businessmen support all potential candidates to avoid wasting money, and to ensure the sustainability of their particular interest.
With more challengers, businessmen’s preferred state capture strategy order changes: modification of incumbents’ platform commitments to align with businessmen’s interests during the electoral campaign, with a proportion of 68 per cent, ranks first, instead of public procurement, which comes in second place, with a proportion of 67 per cent, followed by the promotion of the political careers of the relatives of businessmen, with a proportion of 64 per cent. It is also important to emphasise that from a proportion of 17 per cent, influence and control over recruitment in all public sectors related to the economy increases to 51 per cent, one of the strongest strategies, if not the strongest, of state capture at the local and national level.
Table 4.4 tests the change in the use of capture strategies of firms for commune/municipal elections. The table reports a t-test on the difference in means between the strategies used under a high electoral competition setting, as proxied by a hypothetical increase in the number of candidates contending (the treatment group), to the strategies used under a low electoral competition scenario with few candidates contending for office (the control group). While the results should be interpreted only as simple correlations, they show interesting dynamics. As noted before, procurement increases dramatically, with an increase of 10.9 per cent significant to the 1 per cent level, while other forms of lower capture value decrease, particularly the demand for political programme changes, which falls by 7.7 per cent, significant to the 1 per cent level. While non-significant, we see a positive increase in all those strategies involving high degrees of state capture, including patronage (increase of 16), bureaucratic recruitment (10 per cent), and the demand to control the budget line (0.6 per cent). We also note an overall decrease in all the strategies associated with low degrees of state capture or with a null effect on state capture, with a decrease in policy demands (−2.3 per cent), demanding support for a candidate supported by the firm in the future (−1.6 per cent), or asking for a refund on what was invested in the politician (−2.9 per cent).
Table 4.4 Electoral competition (uncertainty) and firms’ strategies (capture) in local elections in Benin
| Mean treatment | Mean control | Diff. | Diff. SE | p | |
|---|---|---|---|---|---|
| Demand policies | 0.466 | 0.489 | −0.023 | 0.04 | 0.575 |
| Procurement | 0.714 | 0.605 | 0.109 | 0.038 | 0.004 |
| Patronage (from and not from firm) | 0.386 | 0.37 | 0.016 | 0.039 | 0.68 |
| Patronage (from firm) | 0.392 | 0.379 | 0.013 | 0.039 | 0.742 |
| Support candidate (future) | 0.161 | 0.177 | −0.016 | 0.03 | 0.593 |
| Change in policy programme | 0.087 | 0.164 | −0.077 | 0.026 | 0.004 |
| Refund | 0.042 | 0.071 | −0.029 | 0.018 | 0.118 |
| Bureaucracy recruitment control | 0.177 | 0.167 | 0.01 | 0.03 | 0.75 |
| Demand budget line | 0.064 | 0.058 | 0.006 | 0.019 | 0.738 |
| Firm capture index | 4.45 | 4.318 | 0.132 | 0.117 | 0.258 |
| Firm capture index (standardised) | 0.045 | −0.046 | 0.091 | 0.081 | 0.258 |
We construct an index of firms’ state capture ranking strategies in the following order, from the weakest to the strongest form of state capture: refund=0; policy and programme change demands=1; support to firms’ candidates in the future=2; control over the budget line=3; public procurement demands=4; patronage=5; and, lastly, control of the bureaucratic recruitment process=6. While non-significant, the results show that under a hypothetical high-competition setting the firms’ capture index is higher than in low-competition ones.
Thus, in short, the higher the electoral uncertainty, the stronger and more enforceable are the forms of commitment businessmen prefer. Interestingly, in the absence of a good candidate to fund, respondents say that businessmen are more likely to run for elections themselves. In this respect, about 60 per cent of respondents say that businessmen’s involvement has become a phenomenon in recent years; most of them run directly for elections.
A good example of the change in frequencies in firms’ capture preferences is the relationship between the former Beninese President Boni Yayi and the current President Patrice Talon, the richest businessman in the country. According to a respondent very close to the former, the latter used to finance politicians’ electoral campaigns, from presidents to local mayors. After supporting both the 2006 and 2011 Yayi presidential campaigns, Talon negotiated the biggest public procurement in Benin’s history. Thereafter, Yayi decided to end the collaboration, presumably due to the power imbalance that the procurement granted Talon. What followed was a clash between both actors, leading to a highly uncertain political environment. As a result, Talon first financed the campaign of the national assembly president, the second personality after the president. However, it seems that, given his experience with President Yayi and given the highly uncertain competitive electoral environment, Talon decided to run for president himself. He won the election on 6 April 2016.
Table 4.5 introduces the estimates of equation (1); that is, the effect of electoral competition measured by winning margins on firms’ preference for direct capture for both municipal- and legislative-level elections. The first column shows that when the winning margin increases – that is, when electoral competition decreases by 1 standard deviation – firms decrease their preference for more direct forms of state capture by −0.1684 standard deviation, a result that is significant to the 1 per cent level. Contrast this to the placebo test shown in the second column: winning margins hold a positive and non-significant effect for MPs. As noted before, MPs do not have a say in national- or local-level bureaucracy and thus would have no effect on firms’ strategies to mitigate electoral uncertainty. In this regard, the right-hand panel of Figure 4.3 provides an example of the asymmetrical relationship between winning margins and firms’ capture index by election type, with a negative relationship for municipal-/commune-level elections and a positive one for legislative-level ones.
Table 4.5 Effect of electoral competition (winning margin) on firms’ preference for direct capture, beta coefficients
| Dependent variable: firm capture index | ||
|---|---|---|
| Municipal level | Legislative level | |
| Winning margin | −0.1684*** | 0.0535 |
| −0.0801 | −0.0736 | |
| Observations | 117 | 96 |
| R-squared | 0.48 | 0.37 |
| Controlsa | yes | yes |
| Commune FE | yes | yes |
Standard errors in parentheses are clustered at the commune level; significance level (***) 0.1%. Outcome measured in standardised terms. FE, fixed effects. aElectoral district-level covariates include GDP, inequality, and 2015 electoral measures, including winning margin, and Herfindhal–Hirschman Index of party vote share concentration; politician characteristics controls include indicator levels of education levels by politician.
Moving forward, Table 4.6 presents the estimates of equation (2); that is, the effect of the electoral reform that collapsed the party system into a two-party block competition, decreasing the electoral risk of firms’ strategic decision-making to capture government. Results are expressed in standardised beta coefficients. As seen in the last column, the effect of a decrease in electoral uncertainty decreases the firm capture index by −0.259 standard deviation, significant to the 1 per cent level. This result is robust to the inclusion of district and politician characteristics, and district fixed effects. If we dissect the index, we notice that demands characterised by high degrees of capture are decreasing, especially patronage for family members, friends (−0.4374), members of the firm (−0.4365), and bureaucratic recruitment control. Meanwhile, less direct forms of capture increase or have negligible and non-significant effects, including refunds, support for candidates in the future that are supported by the firm, or demands for public goods procurement. Note, for instance, that there is actually a positive effect on budget line demand. Policies and programme modifications are negative and significant, showing that in settings of low electoral risk firms also decrease the use of such demands towards politicians.
Table 4.6 Effect of electoral reform (uncertainty decrease) on firms’ strategic decision-making, beta coefficients
| Dependent variable | |||||
|---|---|---|---|---|---|
| Refund | Policies | Programme change | Support candidate | Budget line | |
| Electoral reform | 0 | −0.6481*** | −1.0992*** | 0 | 0.4829*** |
| (decrease uncertainty)a | 0 | 0 | 0 | 0 | 0 |
| Observations | 117 | 117 | 117 | 117 | 117 |
| R-squared | 0.327 | 0.544 | 0.466 | 0.415 | 0.739 |
| Controlsb | yes | yes | yes | yes | yes |
| Commune FE | yes | yes | yes | yes | yes |
| Procurement | Patronage | Firm patronage | Recruitment control | Firm capture index | |
|---|---|---|---|---|---|
| Electoral reform | 0 | −0.4374*** | −0.4365*** | −0.6061*** | −0.2595*** |
| (decrease uncertainty) | 0 | 0 | 0 | 0 | 0 |
| Observations | 117 | 117 | 117 | 117 | 117 |
| R-squared | 0.508 | 0.402 | 0.494 | 0.506 | 0.391 |
| Controlsb | yes | yes | yes | yes | yes |
| Commune FE | yes | yes | yes | yes | yes |
Standard errors in parentheses are clustered at the commune level; significance level *** 0.1%. Outcome measured in standardised terms. a Outcomes with 0 imply a very small number; we preferred not to introduce scientific numbers and left this as is. b Electoral district-level covariates include GDP, inequality, and 2015 electoral measures, including winning margin and Herfindhal–Hirschman Index of party vote share concentration; politician characteristic controls include indicator levels of education levels by politician.
We further test in Table 4.7 the effect of the decrease of electoral uncertainty due to the introduction of the electoral reform on the use of non-programmatic politics and other actions by politicians at the district and commune levels. We notice two important results. On the one hand, in a more certain setting, politicians increase the use of non-conditional transfers to voters by 0.7186 standard deviation, with the result significant to the 1 per cent level, and they decrease the use of other types of expenses, including pork-barrel and non-visible expenses, such as expenditure on water and sewage infrastructure. In other words, as backed substantively by the clientelism literature, under conditions of certainty politicians rely heavily on non-programmatic politics and use non-conditional transfers to attempt to increase citizen electoral support.
Table 4.7 Effect of electoral reform (uncertainty decrease) on use of non-programmatic politics and transfers to business interests, beta coefficients
| Dependent variable | ||||
|---|---|---|---|---|
| Non-conditional transfers | Pork-barrel expenses | Pro-business transfers | Non-visible expenses | |
| Electoral reform | 0.7186*** | −0.7240*** | 0.4834*** | −0.1202*** |
| (decrease uncertainty)a | 0 | 0 | 0 | 0 |
| Observations | 117 | 117 | 117 | 117 |
| R-squared | 0.399 | 0.446 | 0.422 | 0.509 |
| Controlsb | yes | yes | yes | yes |
| Commune FE | yes | yes | yes | yes |
Standard errors in parentheses are clustered at the commune level; significance level *** 0.1%. Outcome measured in standardised terms. a Outcomes with 0 imply a very small number; we preferred not to introduce scientific numbers and left this as is. b Electoral district-level covariates include GDP, inequality, and 2015 electoral measures including winning margin and Herfindhal–Hirschman Index of party vote share concentration; politician characteristic controls include indicator levels of education levels by politician.
On the other hand, and most important for this chapter, politicians under situations of low electoral risk increase dramatically their transfers to firms, an increase of 0.4834 standard deviation, significant to the 1 per cent level. This result goes hand in hand with the previous results: as electoral certainty rises, firms underuse high demands of government capture, in part due to an increase in politicians’ transfers.
V Discussion and Conclusion
A wide literature has shown the pernicious effects of business interests in institutional and democratic development. However, there has been little study of the underlying mechanisms by which firms deter democracy, especially in the context of weak states. This chapter provides evidence on the relationship between business interests and clientelistic contracts, and by doing so brings together two seemingly unrelated literatures: interest groups and state capture and clientelism. By doing so it provides, for the case of Benin, concrete evidence on the demand set applied by firms to politicians in exchange for firms’ support for electoral campaigns. More importantly, we show that more than half of Benin’s politicians are politically affiliated with firms, and that such affiliation affects the underlying base structure within which clientelist contracts with citizens take place.
We provide evidence that firms’ strategic interactions with politicians change as electoral uncertainty changes. In particular, in the most striking result of this chapter, we show that as electoral uncertainty decreases firms rely less heavily on more direct forms of government capture, including patronage or the control of local bureaucratic recruitment processes. In positive terms, paradoxically, this implies that democratic consolidation, which thrives with electoral uncertainty, is undermined by business interests.
‘Campaign finance and state capture’ provides a new perspective on topics that are at the heart of the literature on the political economy of development. In particular, the study of democracies in the developing world tends to focus on issues of clientelism or political exchange – directly or indirectly providing private benefits for constituencies in exchange for electoral support. However, as this chapter points out convincingly, not only are different forms of political exchange targeted at voters, different forms of political exchange are also practised by firms, each with potentially different implications for economic development and democratic consolidation. One problem with the literature on clientelism is that it tends to focus on political exchange between voters and politicians, without regard for the strategies of firms. Arguably, not only does this miss an important part of the dynamic for understanding political exchange more broadly, it also understates the developmental impact of clientelism. In focusing on small-scale ‘retail’ strategies, such as vote buying or patronage, we may be missing the more important forms of ‘wholesale’ strategies, such as capture or cooptation – strategies that arguably have more distortionary effects on both economic development and democratic consolidation.
As a result, in addition to highlighting important dynamics in Benin with implications for political institutions and economic development, this chapter addresses a first-order question in the literature on clientelism. This work is exemplary in leveraging results from a specific country context in order to make broader theoretical arguments. It does so by contributing both a novel framework – bringing together the two literatures on clientelism at the voter and firm levels – and bringing new data from Benin to test it.
I Networks
One potentially helpful area for exploring extensions to this work is to think more about firm and politician networks. Theories of networks underlie both the literature on clientelism and the literature on firm capture and cronyism, making it a natural fit given that this project is bringing new data to create a unifying framework for the two literatures. Furthermore, networks are implicit in the chapter’s analysis (even if not sufficiently explicit) and, in fact, networks were a key part of the data collection because of the snowball sampling techniques.
Networks matter not only because of the direct connections, but also for understanding the broader structure of how business interests interact with clientelism. This short note addresses two types of networks, firm networks and politician networks, in order to suggest potential extensions to the analysis. Firm networks matter because they determine access to political ‘goods’, but also because the types of networks that firms invest in may provide evidence of their priorities and strategies for lobbying. As a result, firm networks would be expected to matter for the range of demands that firms might pursue, and their techniques for doing so. It is also possible that networks operate as a constraint on firm strategies – to the extent that firms invest in developing ties and cultivating relationships with a broad range of industry and government actors, it may be difficult for them to switch strategies even when political circumstances change (Fisman, Reference Fisman2001).
Similarly, politician networks matter not only for electoral competition, but also for the types of strategies they may pursue once they are in office. For example, a large literature links politician networks to different types of electoral strategies. In particular, clientelistic political exchange requires dense, hierarchical networks for the identification of clients and the delivery of benefits and monitoring of voter behaviour. Compared to the internal organisational problems inherent in programmatic parties, for clientelist politics the problem is monitoring and controlling the political brokers at each level in the process (Kitschelt and Wilkinson, Reference Kitschelt and Wilkinson2007). Such mechanisms require elaborate networks to monitor actors and manage exchange relations (Stokes, Reference Stokes2005). Kitschelt and Wilkinson (Reference Kitschelt and Wilkinson2007) describe these networks as necessary because of the need to monitor political actors at each level in the process. Research by Calvo and Murillo (Reference Calvo and Murillo2009) has argued that clientelist politics requires different types of political network structures to programmatic politics: clientelist countries have large, heterogeneous, vertically integrated parties, while programmatic countries have smaller, homogeneous, horizontally integrated parties. The ability to monitor is a fundamental aspect of successful politician networks (Kitschelt and Wilkinson, Reference Kitschelt and Wilkinson2007; Larreguy, Reference Larreguy2013).
II Firm Networks
It is widely accepted that better-connected firms exercise more political influence. However, it remains little understood how different types of ties affect different types of political action. The notion that the type of ties matters underlies much of the work on politician networks and political parties. With this type of analysis, it becomes possible to explore whether firm connections affect the strategies firms pursue, or the ways in which they engage with politicians.
For example, Cruz and Graham (Reference Cruz and Graham2021) contrast the effect of ties to other firms in the same industry (peer ties) with direct ties to elected officials and bureaucrats (government ties). Their framework proposes that peer ties facilitate collective action, most often with respect to broad policy issues that affect many firms, while government ties are primarily used to address narrow, particularistic issues. Cruz and Graham use a new survey of foreign-owned firms operating in the Philippines to demonstrate that different ties are associated with different approaches to lobbying. Consistent with theories of collective action among firms, ties to other firms are associated with efforts to influence policy at the national level, where issues are broader based and affect larger numbers of firms. By contrast, ties to government actors (bureaucrats or politicians) are associated with seeking policy influence at the local level, where actors have narrower scope but can direct specific benefits and concessions to firms.
For example, Figure 4.3a is a visual illustration of firms’ ties with politicians, bureaucrats, and other firms.Footnote 14 Each of the black circles (nodes) represents an actual firm in the sample and the grey circles represent political actors: congress, local government, and the bureaucracy (labelled). For each firm, the figure presents (1) ties to congress, bureaucracies, or local government, depicted by connecting lines between the firm node and the government actor node; and (2) ties to peer firms, represented by the size of the circle, where large circles are those firms that report a larger number of peer firms. A substantial number of firms, including many with a large number of peer ties, have no direct government ties.
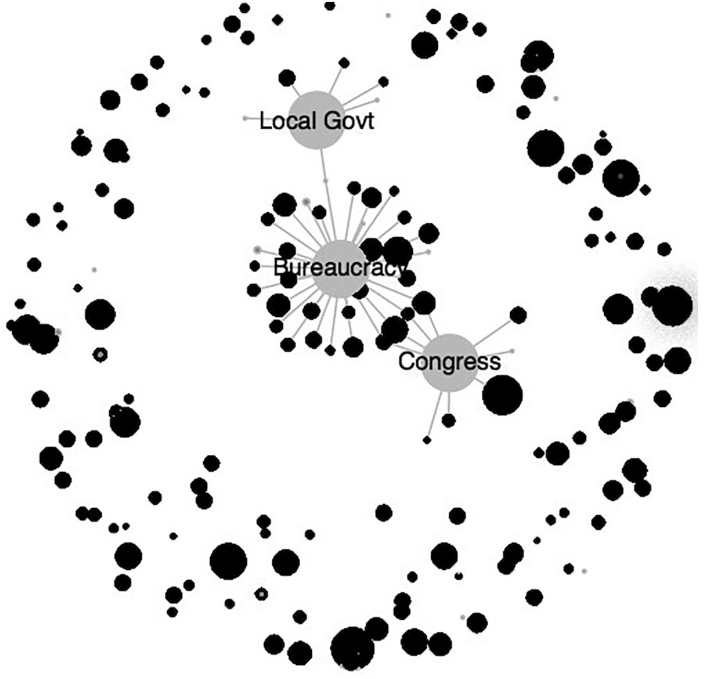
Figure 4.3a Peer and government ties
III Politician Networks
Another important aspect of networks that could extend the important findings in this chapter are differences in the networks and strategies of politicians. Figure 4.3b is a visual illustration of ties among mayors in Isabela province, in the Philippines. Some mayors are well connected horizontally, while others have vertical connections: instead of ties to other mayors, they have ties down to the village-level officials and up to the congressman (or congresswoman) and governor of the province. The structure of these ties affects the incentives of politicians to pursue different types of political exchange.
Figure 4.3b Effective mayor network in Isabela (1st district–white; 2nd–light grey; 3rd–dark grey; 4th–black)
Vertical ties are associated with individually targeted political exchange, because in a political context where there are overlapping constituencies, politicians can reduce the costs associated with individually targeted political exchange by pooling their efforts. Politicians at higher levels collude with lower-level politicians and political brokers. The higher-level politicians provide funding and the lower-level politicians provide the personnel and oversight for the implementation. A big part of the costs of vote buying involves logistics: identifying targets, sending personnel to conduct the transaction, as well as monitoring and enforcing the transaction. Once a system for monitoring or verification has been set up and the political broker has already been hired to hand out the envelope of money, the marginal cost of asking the voter to also vote for another politician on the same ballot is relatively small. The overlapping constituencies create incentives for such collusion among politicians organised through vertical networks.
Horizontal ties, by contrast, facilitate group-targeted strategies like pork-barrel politics. When pork-barrel funds take the form of spending allocated to more than one municipality, mayors who are able to cooperate with each other can act collectively to demand pork-barrel projects that benefit their municipalities. In these cases, the funding is typically controlled by politicians at the national level (such as governors or congressmen) or national government agencies. Very few local-level politicians are influential enough to lobby successfully for these types of funds on their own. However, groups of mayors acting collectively can successfully bid for large-scale projects affecting their areas. Examples of such projects include fisheries and shoreline support for coastal municipalities, irrigation systems for municipalities along a river, or construction and road projects that go through more than one locality. Horizontal ties are important not only for the process of bidding for national- or provincial-level projects, but also for ensuring that mayors cooperate throughout the project implementation process.
Extended to firms, we might also expect that the form of political alliances and political networks might also condition how politicians engage with firms. For example, politicians with ties to the bureaucracy might offer to negotiate with firms by offering regulatory deals. Politicians with more discretionary funding may prefer to offer concessions and kick-backs. As a result, in addition to considering the preferences of firms for direct or indirect forms of capture, it is equally important to consider that politicians may be differentially positioned to offer these different types of ‘policy goods’.
I Introduction
Cotton has a long history in Benin’s development strategies and it continues to play a majorFootnote 1 economic role today, accounting for about 50 per cent of export revenue (excluding re-exports) and 45 per cent of tax revenue (excluding customs revenue).Footnote 2 It contributes to the livelihoods of about one-third of the populationFootnote 3 and it constitutes 60 per cent of physical capital in Benin’s industrial sector (nineteen ginning factories, four textile factories, and two agro-food factories for vegetable oil extraction) where it generates about 3,500 paid jobs (Ministère de l’Agriculture de l’Elevage et de la Pêche, 2008). In addition, cotton contributes to activities in the services sector (e.g. transport and construction), and also plays a socio-politicalFootnote 4 role in rural development in Benin (see, e.g. Kpadé, Reference Kpadé2011).
Several indicators have been proposed to assess the economic performance of the cotton sectors in African countries (e.g. Tschirley et al., Reference Tschirley, Poulton and Labaste2009), but data limitation forces us to focus this analysis on three main indicators: production, yield, and acreage. In some cases, we discuss performance related to two additional indicators: the producer price of seed cotton; and Benin’s market share of cotton lint in the international market. We derive data on the first key three indicators from the Food and Agriculture Organization (FAO) Corporate Statistical Database (FAOSTAT), allowing us to make a consistent comparative analysis with other countries over a long time period (1961–2017).Footnote 5 Data from three other sources (Institut National de la Statistique et de l’Analyse Economique, INSAE; Association Interprofessionnelle de Coton au Bénin, AIC; and Programme Regional de Production Intégrée du Coton en Afrique, PR/PICA) are used to discuss the performance of the sector over the recent period (2016–2018).
Figures 5.1a and 5.1b report the performance of the cotton sector in Benin and in Burkina Faso, a neighbouring francophone country; they give the production of seed cotton, yields, and cultivated area over the 1961–2017 period.Footnote 6 Figure 5.1a presents the performance in Benin and Burkina Faso in levels, whereas Figure 5.1b displays the performance of Benin relative to Burkina Faso (1961=100). The data in Figure 5.1b show a relatively poor performance in Benin’s production in 1962–1969, 1974–1992, and since the early 2000s. In 1961–1969, this was primarily caused by a more rapid expansion of acreage in Burkina Faso, since Benin was doing relatively well in terms of productivity per land unit. In the period 1974–1992, Benin lagged behind both in terms of yields and acreage.
Figure 5.1a Performance of the cotton sector in Benin and Burkina Faso
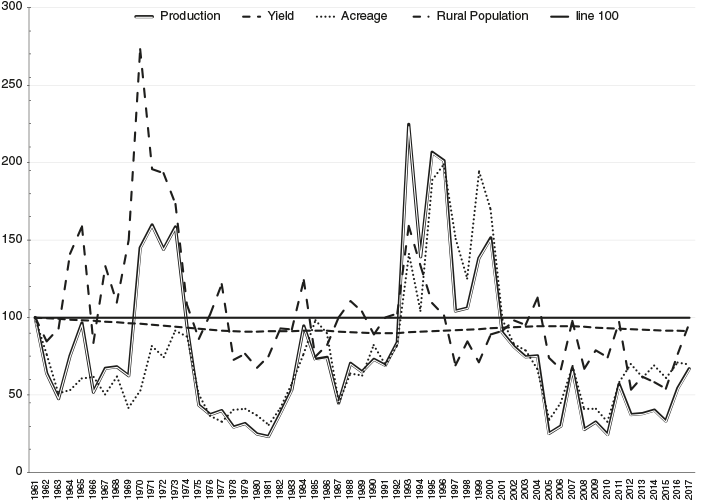
Figure 5.1b Performance of the cotton sector in Benin relative to Burkina Faso (1960=100)
In contrast, Benin outperformed Burkina Faso in 1970–1973 and 1993–1997. In the first subperiod, Benin’s performance was due to a spectacular improvement in yields, whereas in the second subperiod the result mostly stemmed from a more rapid extension in the area allocated to cotton. Figure 5.1a shows that, up until 1993 and except for the subperiod 1970–1973, the output of cotton in Benin moved roughly hand in hand with the cultivated land area, suggesting that improvement in yields did not play a significant role. In Benin, yields thus appear to be volatile and, more worryingly, in recent years they have come down to the level where they were in the early 1970s.
What are the causes of the performance in the cotton sector in Benin? This chapter aims to provide a diagnostic of the cotton sector in Benin. In particular, it reviews the underlying factors of the sector’s performance, with an emphasis on the role played by institutional factors. Over the years the sector has operated under different modes of organisation, between public and private types, each of which has been reversed over time. We aim to elaborate on the underlying causes of these changes and their implications for the performance of the sector. For this purpose, we make use of academic and grey literature. Moreover, we obtained information from key informants within the sector.
Section II introduces the framework of the analysis. Section III summarises the historical background. Section IV reviews the performance of the cotton sector in the period 1961–2016. It seems too early to provide an analysis of the sector after 2016, particularly because we lack crucial information on the current functioning of the AIC. We therefore do not provide an in-depth analysis on the performance of the recent period, but we leave such an analysis for future research. Section V presents the synthesis of the diagnostic.
II Analytical Framework
A Organisation of the Cotton Sector
There are nine main inter-related functions in the cotton sector:
1. Input supply and distribution.
2. Research (seed variety development).
3. Technical and extension services.
4. Production – seed cotton.
5. Primary marketing.
6. Processing – cotton lint, cotton seed, oil, etc.
7. Final marketing (of cotton lint, including export).
8. Quality control.
9. Price setting.
In this setting the performance of the sector depends on both domestic and external factors (e.g. Ahohounkpanzon and Allou, Reference Ahohounkpanzon and Allou2010; Baffes, Reference Baffes2004; Bourdet, Reference Bourdet2004; Cabinet Afrique Décision Optimale, 2010; Gergely, Reference Gergely2009; Kpadé, Reference Kpadé2011; Saizonou, Reference Saizonou2008; Yérima, Reference Yérima2005). We discuss the specific role of both of these sets of factors in what follows.
B External Factors
External factors include international forces that cause fluctuations in the global cotton price. Figure 5.2 displays monthly data on world cotton prices in US$ and CFA Francs (CFA), together with the CFA Franc/US$ nominal exchange rate over the period 1980–2017. The figure also displays the real producer price, which we obtain by dividing the nominal price by the consumer price index (CPI). The co-movement between the nominal and real price series is strong (0.65). Therefore, the rest of the discussion will be focused on the nominal series.

Figure 5.2 World cotton price and the CFA Franc/US$ exchange rate (1996=100)
The data show that variations in both the nominal exchange rateFootnote 7 and the US$ value of world cotton prices have caused great fluctuations in the CFA Franc value of the cotton price. In the second half of the 1980s, in 2001–2002, and in 2004–2009, for instance, the US$ value of cotton prices exhibits a declining trend, amplified by a persistent appreciation of the CFA Franc. We briefly discuss the causes of these fluctuations in the world US$ cotton prices. Thereafter, we elaborate on their impact on domestic cotton supply and the welfare of producers.
1 Understanding the Fluctuations in World Cotton Prices
Fluctuations in the world US$ price of cotton are caused by both demand and supply forces (see, e.g. Janzen et al., Reference Janzen, Smith and Carter2018). The impact of world supply operates through the action of subsidies in some leading cotton-producing countries, the USA in particular. For instance, FAO (2004) argues that world cotton prices would have been 10–15 percentage points higher in the absence of the subsidies to cotton producers in big producing countries. In value terms, the effect of subsidies amounts to a loss of about US$150 million in the export earnings of West African cotton-producing countries (Tschirley et al., Reference Tschirley, Poulton and Labaste2009). In 2003, a number of these African countries (Benin, Burkina Faso, Chad, and Mali) submitted a case to the World Trade Organization (WTO) to request the elimination of such subsidies by the Organisation for Economic Co-operation and Development (OECD) and financial compensation. Following discussions at the WTO, the USA removed around 15 per cent of its subsidies to the cotton sector, but did not provide any direct compensation.
On the demand side, fluctuations in world cotton prices are explained by variations in global demand and by the development of substitutes in the form of synthetic fibres. The role of synthetic fibres in the global market has grown considerably over the past decades (see Baffes, Reference Baffes2004; Krifa and Stevens, Reference Krifa and Stevens2016). In particular, the share of cotton fibres in the world market of textile fibres shrank considerably from 70 per cent to below 30 per cent between 1960 and 2014, due to the marked decrease in the relative price of synthetic fibres (see Figure 5.3b below). For Benin and other West African countries, this new factor calls into question the sustainability of any long-term development strategy grounded primarily in the cotton sector. However, in absolute terms there is no decline in cotton fibre. We come back to this issue in Section V.
2 Welfare Impact of Cotton Price Fluctuation
Farmers are sensitive to the price of cotton, especially because cotton requires more labour effort and other inputs than other crops.Footnote 8 A number of studies find a positive response of the supply of seed cotton to production price and a positive effect of higher prices on producers’ welfare in Benin (e.g. Alia et al., Reference Alia, Floquet and Adjovi2017; Gergely, Reference Gergely2009; Hugon and Mayeyenda, Reference Hugon and Mayeyenda2003; Minot and Daniels, Reference Minot and Daniels2005; World Bank, 2004). For instance, Alia et al. (Reference Alia, Floquet and Adjovi2017) report price elasticities of the cotton supply ranging from 1.3 to 2.6.Footnote 9 In a related study, Minot and Daniels (2002) find that a 40 per cent reduction in the producer price of cotton results in a 6–8 per cent increase in rural poverty.Footnote 10 Moreover, they estimate the multiplier effect of cotton: national income would be reduced by US$2.96 for each US$1 decrease in the income of cotton farmers.
These micro-economic findings are in line with the aggregate data reported in Figures 5.3a and 5.3b. First, Figure 5.3a shows a strong co-movement between the world price and the producer price, although the strength of the correlation is less pronounced before 1992 when the statistics are based on the cyclical component of the two prices. We elaborate later, in Section III, the producer price-setting rules. Second, following the drop in cotton prices observed during the years 2001–2009, both the output and the surface of land planted in cotton have declined significantly in Benin and Burkina Faso. However, Benin displayed a much larger negative response, suggesting that country-specific factors may also explain the behaviour of cotton supply.Footnote 11 Conversely, cotton supply increased sharply in the same countries following a strong increase in the US$ price and the devaluation of the CFA Franc in 1994.
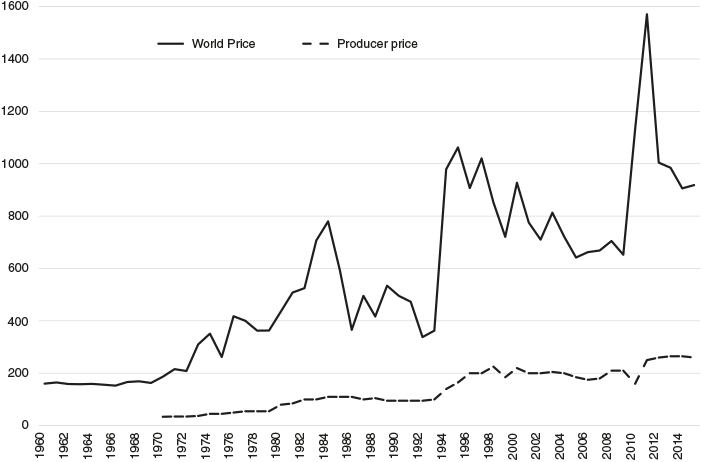
Figure 5.3a World and Benin producer prices of cotton (CFA/kg) and rolling correlation coefficients of the prices
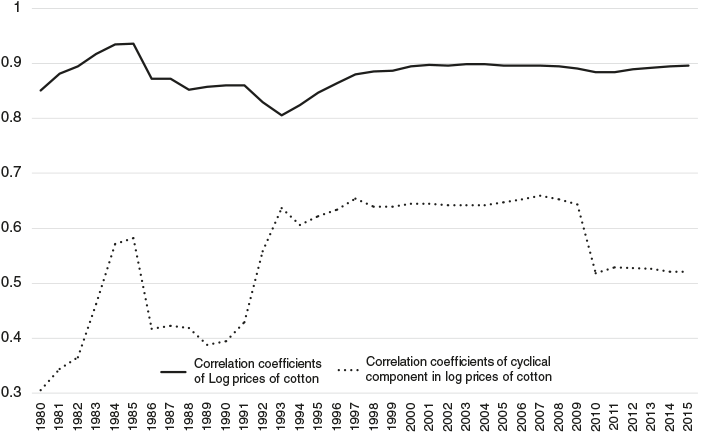
Figure 5.3b World and producer prices of cotton (CFA/kg) and rolling correlation coefficients of the prices
C Domestic Factors
There are three main domestic factors affecting the performance of cotton: climatic risks, technical skills, and the quality of institutions. Climatic risks are exogenous and cannot be directly acted upon. Cotton supply depends on specific climatic conditions across the growing cycle: the length of the rainy season, dry spells, flooding periods, temperature, and solar radiation (e.g. Blanc et al., Reference Blanc, Quirion and Strobl2008). The role of climatic risks is not systematically discussed in this chapter. Technical skills depend on training and experience and will also not be discussed further here. But the role of institutions is of special interest to us. These include the type of coordination of the different functions in the supply chain and the specific rules and regulations that are involved.
There are two views regarding the required type of coordination in the cotton value chain: the French view and the World Bank view. The French view is based on the strategy developed by the Compagnie Française pour le Développement des Fibres Textiles (CFDT), a French parastatal company that modernised the cotton sector in the former French colonies of Africa. It advocates a vertical integration of the value chain through a single channel (a monopoly/monopsony) from farmers to ginnery companies and input suppliers. Moreover, the chain controls research activities for variety development, which are linked to extension services. In addition, it is in charge of promoting stable producer prices. After independence, the CFDT entered into joint ventures with African governments and the single channel was maintained. In the mid-1980s, when world cotton prices collapsed, subsidies from governments and money from donors were used to rescue the African cotton companies.
The World Bank view assumes that (state) monopoly is less efficient because of excessive public employment and political interference (e.g. Baffes, Reference Baffes2007). Such a monopoly can also be blamed for excessively taxing farmers who receive a rather small share of the world cotton price. Hence, allowing competition should decrease this tax and stimulate the supply of cotton. The view of the World Bank, also supported by the IMF, was dominant in the 1980s and was enforced through the structural adjustment programmes in many African countries in the 1980s and 1990s.
Conceptually, it is hard to say a priori which of the two modes of coordination would generate a better performance for the cotton sector, because each of the approaches has its advantages and disadvantages. For instance, while competition can boost producer prices, it typically implies higher coordination costs in a weak institutional environment characterised by imperfect credit markets, asymmetrical information, and weak contract enforcement. In a system where ginneries provide input credit to farmers, competition will encourage side-sellingFootnote 12 to cotton-buying competitors, discouraging credit supply by final buyers, thus causing inefficiencies in the input segment of the supply chain. By contrast, whereas a monopoly maintains a lower producer price, it will achieve a higher degree of coordination and better limit the side-selling problem. Hence, it is shown that the organisation of the value chain implies a trade-off between competition and coordination (e.g. Tschirley et al., Reference Tschirley, Poulton and Labaste2009). A recent empirical analysis by Delpeuch and Leblois (2014) confirms this trade-off. They find that African cotton producers in a competitive system achieve higher yields but lower acreage and production, whereas in a regulated system of the CFDT type lower yields but higher acreage and production are observed. On a related point, Baffes (Reference Baffes2007) argues that taxation of farmers has been reduced as a result of the liberalisation and privatisation of the cotton sector in Benin and many other African countries.Footnote 13, Footnote 14 Figure 5.3a also shows that the world price of cotton is much higher than the producer price, but we currently lack relevant and consistent information to discuss the underlying factors behind the difference.
Finally, there is also a debate about the mode of coordination among producers. For instance, should access to technical and agricultural services be organised at the individual or the farmer group level? Should production and input decisions be taken at the individual or the famer group level? Related to access to input and credit, a joint liability approach is used in the cotton sector of Benin and other West African countries. The joint liability approach may create, however, free-riding problems, which will generate inefficiencies in a weak contract enforcement environment. Farmers often report this free-riding problem in West African countries (Benin, Burkina Faso, and Mali), as evidenced by Thériault and Serra (Reference Thériault and Serra2014). Theoretically, it is difficult to predict the efficiency of the farmers who report the problem. For instance, inefficient farmers may report the problem more if they are afraid that their relatively low level of production will not make it enough to cover credit at reimbursement time. In this case, their assets may have to be seized in order to repay the loan. In the same way, efficient farmers may also report the free-riding problem because they have to pay for those who fail to repay their loans. Thériault and Serra (Reference Thériault and Serra2014) argue that producers who report more problems with the joint liability feature are more inefficient in a sample of West African countries (Benin, Burkina Faso, and Mali).
III Historical Background of Cotton in Benin: 1641–1960
A Pre-colonial Period to 1949: Private Mode of Organisation
The origin of cotton in Benin dates back to the pre-colonial period. Cotton was produced in the northern (Atacora–Donga and Alibori–Borgou departments) and central (Zou–Collines departments) regions of the country, and the raw cotton was entirely processed by the local artisanal textile sector (D’Almeida-Topor, Reference D’Almeida-Topor1995; Manning, Reference Manning1980, Reference Manning1982).Footnote 15 Map 5.1 shows that the Alibori–Borgou departments easily dominated cotton production. Moreover, the data reported in Figure 5.4 show that the central region, which was the second most important contributor to cotton production in the 1970s and 1980s, has declined considerably over time. In fact, the level of cotton production (not reported) has increased in the northern region, while it has decreased in the central region.

Map 5.1 Share of the main cotton-producing areas, 2016 (per cent)

Figure 5.4 Share of the main cotton-producing areas, 1979–2016 (per cent)
The northern region has a dry climate whereas the central region has a humid climate. A humid climate is less favourable to cotton production and this partly explains the decline in cotton production in the central region (e.g. Ton, Reference Ton2004). In particular, the producer cost of cotton is relatively high in that region, for example because farmers would need to consume relatively more pesticide to protect cotton from diseases. As a result, farmers switch more frequently to alternative crops when the relative producer price of cotton decreases (and/or the relative cost of cotton increases, or when the quality of input deteriorates). On the other hand, the support of development aid projects is one possible explanation for the increase in the production in the northern region.Footnote 16 We will elaborate on these points later (Figure 5.4).
During the colonial period (1894–1959), French entrepreneurs encouraged the production of cotton with the purpose of supplying cotton to their textile industries in France.Footnote 17 They developed two main strategies, which seem to be still relevant today (Kpadé and Boinon, Reference Kpadé and Boinon2011 and Manning, Reference Manning1982): (1) introduction of new varieties of the Barbadense family of cotton to improve productivity; and (2) promotion of small-sized farming (in order to limit labour movement).Footnote 18 In this context, ginneries were built in the central area (in Savalou and Bohicon) in order to process raw cotton.Footnote 19
The market structure of the cotton industry in this period was thus decentralised and potentially competitive, with the private sector in charge of the main activities, including marketing and processing. Following these efforts cotton production improved and exports to France began around 1904Footnote 20 (Manning, Reference Manning1982). The two ginneries were upgraded in 1924 (Savalou) and 1924 (Bohicon). However, the sector’s development was still marginal around 1926Footnote 21 (Figure 5.5). One problem was the low producer price compared to other crops (coffee, cacao) that were subsidised by the colonial authorities. Moreover, due to several market imperfections that characterise Africa’s rural areas, the market-based mode of coordination did not ensure efficient provision of inputs and agri-services to farmers (Kpadé and Boinon, Reference Kpadé and Boinon2011).

Figure 5.5 Cotton exports, 1903–1960 (tonnes)
B 1949–1960: Private Mode of Organisation but Regulated by the French Government
The modern development of the cotton industry came after the CFDTFootnote 22 was created in 1949 to take over the management of the cotton industry in the colonial territories. A research body, the Institut de Recherche du Coton et des Textiles Exotiques (IRCT), was established with the aim of developing higher yield varieties of seed cotton in support of CFDT activities. These changes occurred in the context of a new strategy initiated by France to develop its colonies after the Brazzaville conference. The strategy was based on development plans that were designed for each territory and financed by a French organisation, Fonds d’Investissement pour le Développement Économique et Social (FIDES). In Benin, FIDES financed two development plans in 1946–1952 and 1953–1960 (Manning, Reference Manning1982; Sotindjo, Reference Sotindjo2017).Footnote 23
In terms of organisation of the cotton industry, the CFDT promoted a single chain running from farming to exporting activities. In particular, the CFDT wielded monopsony power for the purchase of seed cotton from farmers and monopoly power for the supply of inputs, primary processing of seed cotton, and marketing of cotton lint. Typically, farmers would obtain inputs on credit before sowing, and they would pay this back in the form of seed cotton after production was realised. The CFDT also supported the acquisition of equipment by farmers and it provided them with technical and extension services. In addition, it encouraged the production of high-quality seed cotton by offering a price premium. The producer prices were set on a pan-territorial basis and announced before the sowing season. The CFDT bought the whole harvest from the producers at the announced price. In order to process the growing production, two new ginnery factories were built in 1955 in Borgou (Kandi) and in Atacora (Djougou).Footnote 24 Exports also improved, as can be seen from Figure 5.5.
IV Understanding the Performance of the Cotton Sector in Benin: 1961–2016
A 1961–1970: A Private Mode of Organisation but Regulated by the Newly Independent State
This period immediately following independence (in 1960) was characterised by political instability.Footnote 25 In line with the economic policy of the previous period, two development plans were implemented, covering the periods 1961–1965 and 1966–1970. These plans were largely financed by the French government through its development fund Fonds d’Aide à la Coopération (FAC), which replaced FIDES in 1959. The European Commission’s special fund for development, Fonds Européen de Développement (FED), also contributed to the financing of the development plans in Benin.
After independence, many rules and decisions were enacted to organise the agriculture sector.Footnote 26 As the political context was characterised by a growing nationalist movement that had started during the colonial period, the new government started to promote parastatal companies and national players in various activities of the economy. For instance, a registration card was introduced to regulate the primary marketing of seed cotton.Footnote 27 In the same way, there was a rule limiting exports of raw cotton, so that it could be processed inside the country.Footnote 28 A national stabilisation fund, the Fonds de Soutien des Produits à l’Exportation (FS),Footnote 29 was established in 1961 to protect agricultural exports when world prices became lower than the operating costs (producer price, processing costs, and transportation cost). FS was financed by export revenue and subsidies. Taxes were charged on all export products.Footnote 30
The IRCT introduced a new high-yielding variety of cotton (Hirsutum) to replace the existing one (Barbadense). This was done in the northern region in 1962 and later, in 1965, in the central region (World Bank, 1972, 1978). While the two varieties were still produced in the country, the government issued a provision (August 1965) to regulate their distribution. More specifically, the rule imposed that the two varieties should be commercialised separately and on different days in pre-defined local markets. In addition, two qualities of seed cotton were explicitly defined: high-quality cotton (1er choix), obtained from the current agricultural season and possessing attributes of homogeneity, whiteness, cleanness, and dryness; and low-quality cotton (2ème choix). Appointed controllers were charged with the task of identifying the quality of cotton offered for sale by any operator in the local market.
The price of high-quality seed cotton was determined on the basis of the processing price of cotton lint from the past year. A forecast was then made regarding the processing cost for the next cotton season, but the quality of these estimations was only indicative. As for the price of low-quality seed cotton, following a proposition by FS, it was fixed by the government at a given ratio to the price of the high-quality product. This price-setting rule was thus not based on any consideration related to the growers’ production costs. Each year, FS transferred this price information to the government for announcement to the public.
In the meantime, the Société d’Aide Technique et de Cooperation (SATEC) and the Bureau pour le Développement de la Production Agricole (BDPA – created in 1950), two other French parastatals,Footnote 31 were established in central Benin (in the Zou and Collines departments) and the north-western area (in the Atacora and Donga departments), respectively, to take over the extension and technical services and the marketing of seed cotton (Sotindjo, Reference Sotindjo2017; World Bank, 1969). If the CFDT concentrated on the north-eastern area (in the Alibori and Borgou departments) for the realisation of these activities, it continued to be the main organisation for the processing and exporting of all the cotton produced in Benin.
To expand its cotton sector, Benin received support from the FAC and the FED during the period 1963–1970. However, most of the funding was directly handled by the French agencies. The CFDT concentrated its efforts on the Borgou–Alibori department and SATEC concentrated on the central region. The project financed one government ginnery factory in Parakou in the Borgou department in 1968. Furthermore, the IRCT continued its research activities in relation to high-yielding varieties in the stations of Mono and Parakou. As a result, between 1961 and 1969, production and acreage increased from 2,482 tonnes and 20,608 ha to 23,959 tonnes and 31,884 ha, respectively.Footnote 32 Concurrently, yields increased from 1,204 hectogram per hectare (hg/ha) to 7,514 hg/ha over the same period.
Six cotton-processing factories, representing a total capacity of 60,000 tonnes, operated in Benin around the end of the 1960s (World Bank, 1972). This points to a serious problem of over-capacity, since total production in the country was about 24,000 tonnes of seed cotton in 1969. The CFDT owned four of these factories, two of which were located in the central region (Bohicon and Savalou) and two in the northern region (in Kandi and DjougouFootnote 33). The government owned the two remaining factories: one in the south-west (Mono) and the other in the north (Parakou). Through an agreement with the government, the CFDT managed the ginnery in Parakou, in addition to the four factories under its ownership. SONADER operated the second government ginnery in Mono. Formally, the agreement with the government stipulated that the CFDT was not allowed to purchase seed cotton from producers in the Mono region. However, it remained in charge of the export of all cotton lint processed in Benin, including the product processed by SONADER in the Mono region. In 1969, however, the responsibility for cotton exports was shifted from the CFDT to OCAD.
B 1971–1981: A Public Mode of Organisation Regulated by the Marxist–Leninist Government
The positive impulse of the 1960s continued its effect till 1972, when seed cotton reached a peak of 49,590 tonnes (Figure 5.1a). Thereafter, production started declining, from 1973, and reached a low level of 14,134 tonnes in 1981. We now detail a number of events that coincided with this poor performance of Benin’s cotton sector in 1973–1981.
While the French parastatals (CFDT, SATEC, IRCT) contributed significantly to the development of the cotton sector in 1963–1972, their mode of operation was criticised on a number of points (World Bank, 1970). For instance, the parastatals were blamed for their high operational costs, and for their single-crop development strategy, which ignored food crops and did not apply an integrated rural development approach in the areas of intervention. Moreover, the nationalist movement continued to grow, with the consequence that there was rising pressure to reduce foreign influence. In particular, the revolutionary government that took power in October 1972 promoted the ideas of ‘self-reliance’ and food self-sufficiency. Consequently, Beninese rural regional development agencies, known as the Centres d’Action Régional pour le Développement Rural (CARDERs), were promoted in the years 1969–1975, with a view to developing each department. This decision was taken in parallel to the creation in January 1971 of a national cotton agency, the Société Nationale Agricole pour le Coton (SONACO), charged with the development of the entire cotton sector in the country.
In order to further expand the cotton sector, however, foreign assistance was necessary because the country lacked technical skills and financial resources. In this context, a new project was implemented from 1972 onwards, jointly financed by the government (24.5 per cent), a grant from the FAC (27.5 per cent), and credit from the International Development Association (IDA) for the remaining 48 per cent. A primary objective of this project was to develop the activities of the newly created agency (SONACO), which was intended to progressively take over the management from the CFDT and SATEC of all activities in the cotton sector: technical and extension services, supply and distribution of inputs, processing, and marketing.Footnote 34
An important condition imposed on SONACO was that it should work in collaboration with the three French parastatals already operating in the cotton sector: SATEC, IRCT, and CFDT. In a first phase, it was expected that SONACO would concentrate on the management of the procurement of inputs and the agricultural fund. In addition, SONACO would contract with the CFDT and SATEC (the former for the north and the latter for the central region) to manage the project at the regional level (distribution of inputs, technical and extension services, transport, marketing). Moreover, through a joint venture with the government, the CFDT would manage all the cotton ginneries in the country. A similar joint venture between the CFDT and government cotton agency was successfully created in other francophone West African cotton-producing countries. Finally, it was expected that the IRCT would pursue its research and development activities in relation to higher-yielding seed varieties.
The project should have started in 1970, but serious institutional problems caused delays so that it was implemented only from January 1972.Footnote 35 In the beginning (1972), funds came from the FAC and the Government of Benin. As for IDA, it delayed its intervention until April 1973 because of institutional hurdles. In particular, SONACO unilaterally decided to take over direct control of the extension services in the field, in violation of the initial agreement to contract those activities to CFDT and SATEC. Furthermore, skills shortages and management problems at the top level of SONACO were a hindrance to the project’s smooth unfolding. Also, with a new government coming to power (on 26 October 1972) there came big changes in the staffing of the government agencies. All these unforeseen changes increased uncertainty; hence the decision by IDA to postpone the disbursement of its funds. In the end, IDA’s decision was proved to be the right one because the cotton sector performed very poorly from that time onwards (see Figure 5.1a).
There are many reasons for the collapse of the cotton sector. First, SONACO was unable to adequately develop field activities, especially input supply and distribution. In particular, procurement problems (problems with the licensing of suppliers and non-transparent competitive bidding) caused delays in the delivery of inputs to farmers. Moreover, inputs were left unprotected in the port of Cotonou and their quality deteriorated after they had been exposed to the rain. There were also problems in the delivery of ploughs. Furthermore, there were issues between producers and extension staff of SONACO, who were collectors of seed cotton at the village level. In particular, taking advantage of the illiteracy of the growers, some collectors tampered with the amount of cotton submitted by growers. All these problems were amplified when the CFDT and SATEC were forced to leave the country in 1974, when the regime adopted a Marxist–Leninist ideology and put more emphasis on food crops. This is where Benin differs fundamentally from other francophone West African countries. As a consequence of these problems, farmers turned away from cotton, especially in the central region of Zou–Collines, and they started to produce more maize for the Nigerian market, where demand noticeably increased following the first oil shock. This period marked the decline of cotton production in the central region that we highlighted earlier.
Changes in the other segments of the supply chain also compromised the performance of the sector. For instance, the fact that OCAD took over export activities from CFDT had the effect of reducing the quality of cotton lint exported by Benin. The Société de Commercialisation et Crédit Agricole du Dahomey (SOCAD) replaced OCAD in 1972, and it also took over management of the stabilisation fund FS. The change did not, however, improve the situation and the agencies continued to suffer from weak management problems. All these issues led the government and the donor to prematurely end the project around 1975.
There were, however, three main positive outcomes from the project, which also affected the sector later on. First, one additional government ginnery (with a capacity of 18,000 tonnes) was constructed in 1972 in the central region (Glazoué). Second, the research unit IRCT developed new high-yielding varieties (although in 1973–1980 their effects on cotton yield were nullified by the disruption of inputs and extension services): BJA SM 67 and 444–2–70. Third, and most fundamentally, village groups of farmers known as Groupements Villageois (GVs) were promoted in 1971 to take on some responsibilities in the cotton supply chain. GVs do not use collective asset ownership (land and equipment), and neither do they practise common production; instead, they merely coordinate within their group the distribution of inputs and the primary marketing of seed cotton. For inputs, a joint liability system known as caution solidaire was introduced whereby farmers in each GV are jointly responsible for input credit to be recovered at the time of the primary marketing of cotton. As regards primary marketing, village collection centres were created where each GV sells its seed cotton jointly to the collector. The project introduced this change in order to counter the tampering with the amount of seed cotton by some collectors. For this purpose, the project initiated a training programme to develop GVs’ skills in cotton weighing, as well as their literacy skills. GVs were paid for their involvement in the primary marketing, and revenue generated from that activity (ristournes) was invested in rural infrastructure, such as schools, wells, and health centres.
After having adopted a Marxist–Leninist ideology in 1974, in 1977 the government initiated two new types of farmers’ groups. One was the Groupement Révolutionnaire à Vocation Coopérative (GRVC), which is similar to the GV in terms of asset ownership and production organisation, but it produces food crops in addition to cotton. Moreover, GRVCs promote production en bloc of the members’ plots and a high degree of centralisation of extension services. Second, the government promoted collectivist cooperatives known as Coopératives Agricoles Expérimentales de Type Socialiste (CAETS) and Coopératives Agricoles de Type Socialiste (CATS).Footnote 36 Over time, however, CAETS and CATS did not succeed because they were not able to attract the most efficient producers (see, e.g. Yérima and Affo, Reference Yérima and Affo2009). Moreover, there were mismanagement problems.
The Marxist–Leninist government also introduced institutional changes in the other steps of the supply chain of cotton. In 1976 SONACO was replaced by a new parastatal, Société Nationale d’Agriculture (SONAGRI), and the responsibilities of the latter also included the management of inputs for food crops. In particular, SONAGRI was assigned the activities related to processing and input supply in the cotton chain. In contrast, extension services were from then on transferred to the development agencies, CARDERs. In the same period SOCAD was renamed Société Nationale pour la Commercialisation et l’Exportation du Bénin (SONACEB) in 1976 and a new stabilisation fund, the Fonds Autonome de Stabilisation et de Soutien des Prix des Produits Agricoles (FAS), was created in the same year. Following these additional changes, cotton production deteriorated further, from 30,654 tonnes in 1974 to a very low level of 14,134 tonnes in 1981. Moreover, the financial accounts of the government agencies (CARDERs, SONAGRI, and SONACEB) continued to be problematic.
Around the end of 1977, however, the government took a renewed interest in cotton and called upon the support of donors. As such, a technical assistance programme was implemented in 1977–1981 to prepare new development projects. The assistance programme was financed by IDA (50 per cent), FAC (31.25 per cent), and the government (18.75 per cent).
C 1981–1991: Public Mode of Organisation – Government Agencies Restructured and Reorganised
In 1981–1991 the cotton sector recovered strongly, as can be seen from Figure 5.1a: seed cotton increased almost eightfold over the period. This outcome was the result of four new projects that were developed by the government in collaboration with five donors (IDA, Banque Ouest-Africaine de Développement (BOAD), Caisse Centrale de Coopération Economique (CCCE),Footnote 37 the International Fund for Agricultural Development (IFAD), and the Organization of Petroleum Exporting Countries (OPEC)).
The projects strengthened the capacity of the cotton sector at both the national and regional levels. At the national level, they helped in restructuring and reorganising the existing government agencies in the cotton sector. As such, in 1983, FAS, SONACEB, and SONAGRI were replaced by a single new organisation, Société Nationale pour la Production Agricole (SONAPRA), which became responsible for the management of input supplyFootnote 38 as well as the final marketing of cotton. In addition to these institutional reforms, the government increased producer prices from around CFA Francs 80 in 1981 to CFA Francs 100 in 1982–1984, and to CFA Francs 110 in 1985–1986.Footnote 39
At the regional level the projects helped in strengthening the capacities of the CARDERs and the producer groups. In this respect, the first project concentrated on the Borgou region (1981–1988), the second targeted the Zou region, and the third focused on the Atacora region (1983–1988). Finally, the fourth project was a follow-up of the first project in the Borgou region (1988–1991). Hence, the most productive Borgou region received more support, which contributed further to the development of the region.
In 1981, the government transferred to the CARDERs all activities related to the transport and processing of cotton, although these functions were formerly under the responsibility of SONAGRI and should therefore have been passed on to SONAPRA. In addition, the CARDERs continued to manage extension services and the primary marketing of cotton, in collaboration with the GVs. Women’s groups were also promoted for the first time during this project. For extension services, a training and visit (TVFootnote 40) system was introduced in the fields. The projects supported the training of the CARDERs’ staff and the GV members, which facilitated input delivery and the provision of extension services to farmers. Moreover, the projects supported the acquisition of equipment by farmers and the construction of rural roads.
Following these institutional changes and the producer price incentive that was provided during the period, cotton production increased substantially from 14,134 to 88,098 tonnes in 1984, surpassing for the first time the ginnery capacity of 72,000 tonnes. From then, production further increased to 132,762 tonnes in 1986. In 1987, however, the sector experienced a crisis that caused production to regress to 70,203 tonnes. The crisis had to do with three main issues. First, Figure 5.2 shows a strong decrease in the US$ value of the world cotton price and a deep depreciation of the US$ in 1984–1986. As a result, the CFA Franc value of export revenue of the cotton sector depressed. Second, weak financial management by SONAPRA and the CARDERs combined with the continued support of the producer price value of CFA Franc 110 led to a depletion of resources of the stabilisation fund in 1985. In this context, the further decrease in world cotton prices that occurred in 1986 could no longer be absorbed by the stabilisation fund without external funding, because the government itself was also experiencing financial problems. The misallocation of the stabilisation fund included excessive pre-financing of the working capital of CARDERs, and transport and other logistics by SONAPRA to manage the excess production of cotton. Moreover, the debt of SONAPRA and the CARDERs with respect to the banking sector and external suppliers stood at about CFA Franc 7.6 billion. The cotton sector was therefore bankrupt in 1986.
In order to resolve this situation, a restructuring programme for the cotton sector was implemented in 1987–1991. The programme was executed by the government in collaboration with four donors (IDA, CFA, IFAD, and BOAD) within the framework of the second Borgou project, where money was provided to absorb the debt of SONAPRA and the CARDERs. An important condition imposed by the donors on the government in this restructuring programme was that external technical assistance should be mobilised to assist in the management of cotton agencies. The CFDT was thus called to provide technical and managerial assistance to SONAPRA and the CARDERs. The programme included three main reforms. First, the management of ginnery factories was transferred from the CARDERs to SONAPRA. As such, SONAPRA gained control of the main activities of the cotton sector and the CARDERs were left with the status of SONAPRA subcontractors, to manage field activities. From then on, the cotton sector became integrated around the monopoly SONAPRA, as was the case with the CFDT before 1972. A similar change occurred in other former francophone exporters of cotton, but Benin was different because unlike those countries the CFDT had no ownership share in SONAPRA. This was the case because the CFDT was forced by the Marxist–Leninist regime to leave the country in 1974.
Second, the stabilisation fund became the Fonds de Stabilisation et de Soutien des Prix des Produits Agricoles (FSS) and was passed on to an independent management committee. Moreover, the producer price-setting rule was reformed to include a price floor, which was announced by the government before the sowing season around April. The determination of the price floor was based on an opaque rule that took into account the financial viability of the whole cotton sector. If the export price exceeded the cost (producer price and other costs of the cotton sector) in a given year, the margin was distributed in the next year among producers, SONAPRA, the FSS, and the government, according to a pre-defined sharing rule. There were, however, some problems with the implementation of this new rule. In particular, the determination of the price floor was not transparent. Moreover, the price floor was not directly related to the world cotton price, such that the FSS was not always able to stabilise strong adverse price shocks. In any case, the government reduced the producer price from CFA Franc 110 to CFA Franc 100 in 1987 in order to contribute to the financial viability of the system. Moreover, input and seed distribution were limited to the high-yielding regions in 1987. As a consequence of these two measures, seed cotton production reduced considerably in 1987.
Third, various reforms were initiated to strengthen the administrative and financial procedures of SONAPRA and the CARDERs. For instance, internal audit units were established in these agencies in order to regularly check their financial viability. In the same way, administrative and accounting procedures were put in place to manage their invoicing systems. Furthermore, working capital was provided to SONAPRA and the CARDERs.
Following these reforms, the sector’s performance improved significantly. For instance, the reorganisation of the government agencies helped in reducing operating costs and the export marketing procedure (World Bank, 1995). Cotton production surged from 70,203 tonnes in 1987 to 177,123 tonnes in 1991.Footnote 41 In the same way, the GVs’ revenue increased from their participation in primary marketing, which they used to further finance local infrastructure. The promotion of women’s groups may also have increased their voice in matters related to rural development in the cotton-producing areas. One of the first careful micro-economic analyses of the ‘impact’ of these reforms in the Borgou region claims that women gained the most from these changes, because they were previously less involved in the cotton value chain (Brüntrup, Reference Brüntrup1997).
The sector realised this performance despite the fact that world cotton prices continued to decline over the period. However, it was not clear whether without the second Borgou project the sector would be able survive a similar crisis in the future. Hence discussions started between the government and the main donors to privatise and liberalise the cotton sector. The context was also characterised by a structural adjustment programme that began in 1989 and the political transition towards a democratic regime with the national conference in February 1990. A new constitution was adopted in the same year and a market economy was re-established. Hence, a new institutional framework for the agriculture sector was elaborated in the Lettre de déclaration de politique de développement rural (LDPDR) by the government in June 1991, after Soglo won the first presidential election in April 1991.Footnote 42 The LDPDR stipulated that the government should transfer the main functions of the supply chain to the private sector (primary and final marketing, supply and distribution of inputs, and processing).
D 1992–1999: Public Mode of Organisation under Liberalisation of Inputs and Ginnery Functions
Following the LDPDR, Benin began the liberalisation of the cotton sector in 1992 under the Soglo regime, which ruled the country till 3 April 1996. A gradual approach was taken. First, the input function was gradually liberalised in 1992–1995. Second, the private sector was licensed to operate in the processing component, starting from 1995. Third, the government initiated a broader agricultural restructuring project, the Projet de Restructuration des Services Agricoles (PRSA), in 1992–1999. PRSA aimed to promote a better quality of agricultural services by the private sector in the context of structural adjustment programmes that prescribed the reduction of government in various sectors of the economy. In the framework of PRSA many extension agents of the CARDERs were fired. In order to strengthen the capacity of the producers to take over new responsibilities in the sector, the Fédération des Producteurs du Bénin (FUPRO-Benin) was created in 1994 as the national professional trade union of the GV (Wennink et al., Reference Wennink, Meenink and Djihoun2013). The project was supported by seven donors: the Danish International Development Agency (DANIDA), FED, AFD, the German Technical Cooperation Agency (GTZ), IFAD, the United Nations Development Programme, and BOAD.
The liberalisation of the input component proceeded gradually from 20 per cent in 1992 to 100 per cent in 1995. In 1992–1994 SONAPRA was responsible for the residual shares of input supply. The details of the liberalisation were as follows:
1 In 1992 20 per cent of input supply and distribution was attributed to the private firm Société de Distribution Internationale (SDI), of which Talon was a major shareholder.
2 In 1993 the share of SDI increased to 40 per cent.
3 In 1994 60 per cent was attributed to the private sector, now to be shared among two firms:
• SDI obtained 50 per cent; and
• a new firm, Société Africaine de Management, d’Affrètement et de Commerce (SAMAAC), entered with 10 per cent, but it seems that it collaborated with SDI.
4 In 1995 100 per cent of input supply was transferred to the private sector, as follows:
• SDI (46 per cent), SAMAAC (15 per cent), Société des Industries Cotonnières du Bénin (SODICOT; 15 per cent); Société Générale pour l’Industrie et le Commerce (SOGICOM; 8 per cent); and Fruits et Textiles (FRUITEX) Industries (16 per cent).
The selection procedure of these firms for the input supply was done by SONAPRA according to its procurement system, which was limited to Beninese firms in the liberalisation process.Footnote 43 Why did the government not allow foreign firms to compete directly with domestic firms? There are suggestive indications that the procurement and licensing procedures were not totally transparent. For instance, in a recent open letter in 2018, the then president Soglo argued that he took the cotton activities from the CFDT and assigned the input supply activities to a group of ten entrepreneurs, including Benin’s current president Talon.Footnote 44 Moreover, in 1992, SDI received the inputs from SONAPRA directly and it only reimbursed SONAPRA for them afterwards (Yérima and Affo, Reference Yérima and Affo2009). It is also interesting to see that the number of firms increased greatly in 1995. We do not yet have a clear understanding of why this happened. However, 1995 was the year of the second parliamentary election in Benin and it is possible that the competition to win that election could be related to the one to enter the input market.
In addition to these reforms, the CFA Franc value of the world cotton price improved following the rise of the US$ value of the world cotton price and the CFA Franc’s 50 per cent devaluation in 1994 (Figure 5.2). Figure 5.2 shows that the producer price also increased over the period, but the gap between the two series became wider over the second half of the 1990s.Footnote 45 Following these changes, cotton production continued its increase further after 1991 and reached a high value of 430,398 tonnes in 1996. The improvement in cotton production was such that Benin outperformed Burkina Faso in 1993–1996, and there was an under-capacity ginnery problem in 1994.
Note, however, that this improvement in cotton production was primarily driven by land extension. In particular, while yields increased in 1993, they declined in 1994 and followed a declining trend till 1998. Several explanations can be provided for declining yields in that period. First, the result could be due to the price effect of imported inputs following the CFA Franc devaluation. As the price of inputs increased, producers were likely to reduce their input consumption and this could have potentially caused yield to decrease. Second, this outcome could relate to liberalisation having reached more farmers and hence the observed increase in land area. If the newcomer farmers were less efficient in cotton production or if they applied the cotton input for other crops, average cotton yields would have decreased. Third, the new private input suppliers could have been less efficient in managing and distributing inputs, causing delays in supply inputs or supplying a lower quality of inputs.
After President Kérékou took power on 4 April 1996, the number of private firms that obtained a licence to distribute inputs in the cotton sector further increased to eleven in 1996 and twelve in 1998. It is possible that this increase was related to the competition for the presidential election of 1996, in the sense that the Kérékou regime wanted to compensate some entrepreneurs for their support in winning that election. In the absence of clear evidence, this remains speculative, however. In any case, the quality of inputs deteriorated after the number of private firms increased in 1997–1998. Part of the explanation is that some of the newcomers were less efficient. We further elaborate on other institutional causes in what follows. We first discuss the liberalisation of the processing component.
In order to address the under-capacity problem of the processing factories, the Soglo regime initiated a liberalisation in 1995, when three new private ginnery factories of 25,000 tonnes capacity each obtained their licence to operate in Benin: ICB at Pehunco (Atacora), CCB in Kandi (Borgou), and SOCOBE in Bohicon (Zou). These three private factories are known as first-generation (of the liberalisation period) ginneries.Footnote 46 They were granted preferential treatments by the government in a number of areas. First, they obtained a preferential investment code regime (régime C), which grants 100 per cent tax exoneration on profit and an exoneration of duty on imported equipment and intermediate inputs for about seven years. Second, according to a regulation SONAPRA buys seed cotton from farmers and sells it to the private ginneries. This implies that SONAPRA supported part of the risk that should normally be taken by the producers and the private ginneries. Third, the amount of seed cotton to be allocated to the private firms should be proportional to their ginnery capacity and the total seed cotton production. Fourth, SONAPRA contributed 35 per cent to the capital of each of these three private ginneries. Applying this preferential treatment created problems in the future when the number of gin factories increased.
In 1997–1998, the Kérékou regime granted licences to the second generation of ginnery factories. Their total capacity ranged from 40,000 to 60,000 tonnes. These included three new factories for SONAPRA (one ginnery in Bohicon in the Zou department and two ginneries in ParakouFootnote 47 in the Borgou department) and five new private factories: Industrie Béninoise d’Egrenage et des Dérivés du Coton (IBECO) in Kétou (Patteau); Label Coton du Bénin (LCB) in Pouipnan (Zou); Société d’Egrenage Industriel de Coton du Bénin (SEICB) in Savalou (Collines), Marlan’s Cotton Industry (MCI) in Nikki; and SODICOT in Ndali (Borgou). This gives a total of eighteen gin factories, of which ten were owned by SONAPRA and the remaining eight were owned by the private sector. With these new gin factories in business, there was again over-capacity, with a total capacity of 442,500 tonnes compared to a production of 377,370 tonnes. In 1998 the gin capacity further increased to 587,500. The management of this over-capacity problem has been a major issue facing the Benin cotton sector.Footnote 48
Following these changes, production started on a declining trend from 1997 onwards. The decrease in 1996 and 1997 was not systematically related to the producer price, which did not decline. The producer price even increased from 1997 to 1998, despite the fact that the world price marginally decreased (Figures 5.2 and 5.3a, b). This implies that an alternative factor was responsible for the decrease in cotton production. A number of governance problems coincided with this poor performance. We first briefly discuss the change in producer prices and later elaborate on the factors behind the decline in cotton production. In April 1996 the FSS was replaced by the Office Nationale de Stabilization et de Soutien des Prix aux Producteurs (ONS) and a new price-setting rule came into effect. The new rule took into account the world price of cotton and also explicitly defined a margin for each of the main actors along the supply chain: producer; input supply and distribution, and ginnery factories.
As regards governance issues, the cotton sector experienced two conflicts in 1996–1997. The first conflict involved the government and the first generation of gin factories. In 1995 the private ginnery factories accumulated a lot of profit given the high production of cotton processed, but also because the CFA Franc devaluation implied a high value of the world cotton price in CFA Franc, but producer prices only marginally increased.Footnote 49 Given, however, that the firms were granted a preferential tax regime, an agreement was reached between the government and the firms that the latter would exceptionally contribute to government revenue in that year in the amount of CFA Franc 35 per kg of cotton processed. In compensation for this contribution, the agreement stated a decrease in the share of the government in the capital of those firms from 35 to 10 per cent. When the Kérékou regime came in 1996, the preferential tax treatment for these firms was reversed and the government wanted firms to continue to make the CFA Franc 35 per kg contribution. The firms contested this in the judicial court (as well as the Constitutional and Supreme Courts) and when they won the Kérékou government’s action was reversed.
The second conflict started in 1997 and related to issues between SONAPRA and the first private input providers (SDI and SAMAAC). The issues led SONAPRA to exclude these two companies from the input procurement in 1997. Following this decision SDI and SAMAAC brought the case to the judicial court (and the Supreme Court), where they won. In addition, SONAPRA had to pay fines to these firms, but an agreement was reached between the two parties. The agreement stipulated that SDI and SAMAAC would take 50 per cent of the input supply. This decision was applied from 1998 onwards and it contributed to further conflict, because the other suppliers were left with a lower amount of input to be supplied; they contested this rule. This situation led to increased problems in the input component: higher price of input, lower quality of input, and delays in the distribution of inputs (e.g. Bidaux and Soulé, Reference Bidaux and Soulé2005).
In order to resolve the problems, a number of actions were taken to privatise the management of the cotton sector. In 1998, for instance, the producer organisation FUPRO created the Coopérative d’Approvisionnement et de Gestion des Intrants Agricoles (CAGIA) for the management of input quotas between private firms, to which the government transferred the management of input supply and distribution in 1999. Other professional associations were created in 1999: the Association Professionnelle des Egraineurs du Bénin (APEB) for ginners, and AIC for the management of the whole supply chain.
E 2000–2007: Private Mode of Organisation by AIC
The important rules of privatisation were decided at a national workshop in May 2000, which saw the participation of the sector’s representatives. The seminar decided between two modes of private governance for cotton: (1) a unique private and vertically integrated mode of organisation at the country level; and (2) a private integrated mode of organisation at the regional level. Stakeholders decided in favour of the first mode. Moreover, a number of rules were put in place, such as fixed prices for inputs and cotton seeds across the whole country.
In June 2000 the government suspended the monopoly of SONAPRA on primary marketing, but the latter continued to manage its ten ginneries. Primary marketing was thus passed on to the Centrale de Sécurisation des Paiements et de Recouvrement (CSPR), which played a key institutional regulatory role in achieving the recovery of input loans to farmers and the payment of cotton seeds purchased by ginners. A development project funded by the World Bank, the Projet d’Appui à la Réforme de la Filière Coton (PARFC), was implemented in 2002–2007 by the inter-professional cotton association (AIC) to strengthen its capacity. One important change in this period was the fact that AIC started to manage the criticalFootnote 50 functions of the cotton’s sector, including technical and extension services that were previously under the responsibility of the CARDERs. It was also in this context where the CARDERs had to fire many workers as required by the PRSA. As a result, AIC had to recruit private extension agents, which had to join forces with the remaining CARDERs’ technical staff to do the extension work.
It is striking that this period of intense organisational change did not have any effect on cotton production. Moreover, conflicts emerged among the actors starting from 2002–2003. For instance, farmers complained about expensive input prices. In the same way, a number of private firms contested the outcomes of the input procurement procedure, whereas some ginneries found fault with the quotas of cotton seeds. As a result, they boycotted the AIC–CSPR–CAGIA system and started parallel activities. For instance, the dissident distributors attracted some farmers by proposing lower prices than those the official system was offering. However, the quality of the output delivered was not properly monitored. Likewise, the quality of privately supplied inputs could not be guaranteed and producers frequently complained that they were cheated in this regard. The ground was laid for a genuine crisis in the cotton sector. In particular, a lot of confusion was generated by the plurality of input sources and output outlets, and a number of farmers and ginners became severely indebted as the CSPR could no longer track their activities. The cotton sector in Benin thus experienced the side-selling problem discussed in Section II. As a consequence, the system encountered delays in payments, which discouraged farmers. Many of them turned away from cotton production, which was depressed in 2005. The GV also experienced conflicts. The joint liability performed poorly and farmers also complained about poor financial management by their leaders. Another issue experienced by the sector was poor extension services, because there were coordination problems between the private extension agents recruited by AIC and the ones that used to work in the CARDERs. The private agents also lacked technical skills. In fact, all the critical functions faced serious problems during that period.
The government’s reaction consisted of stepping in to finance the debt shortfall. Moreover, it introduced in 2006 institutional reforms to strengthen the professional associations. The producer organisation became the Conseil National des Producteurs de Coton (CNPC) and was limited to cotton producers, in contrast to the old FUPRO; the association of the input distributors became the Conseil National des Importateurs et Distributeurs d’Intrants Coton (CNIDIC); CAGIA was replaced by the Centrale d’Achat des Intrants Agricoles (CAI); and, finally, the organisation of gin factories was replaced by the Conseil National des Égreneurs (CNEC). Furthermore, the government adopted a framework agreement (accord-cadre) in 2006 with AIC, but with no significant effect on the sector’s performance.
In April 2007 the newly elected president (Boni Yayi) dissolved the agreement with AIC and an ad hoc Commission Nationale was established to manage cotton inputs. Moreover, the government allowed SONAPRA in that year to compete for input supply with private firms. This decision was surprising given that SONAPRA was already excluded from these activities.
F 2008–2012: Private Mode of Organisation and Privatisation of SONAPRA
In 2008, the industrial assets of SONAPRA were privatised and a new group, known as the Société de Développement du Coton (SODECO), was created to take over these assets after several problems in procurement management became manifest in 2006–2007. A first attempt to privatise the assets of SONAPRA failed in 2004–2005. The second also failed in 2007 due to problems involving a violation of the regularity procedure. SODECO was created as a joint venture between the government, accounting for a share of 66.5 per cent, and a private company led by Talon, accounting for the remaining share of 33.5 per cent.
In 2008 the government granted another licence for a new ginnery factory, SCN, in N’dali (Borgou), adding a capacity of 40,000 tonnes, despite the fact that the processing component was already experiencing an over-capacity problem. In 2009, a new framework agreement was signed between the government and AIC.
Overall, the domination by Talon’s group further increased in the sector because it merged with the majority of gin factories to create the ICA group. Consequently, the sector came under the control of a private monopoly. The government continued, however, to intervene in the sector. Moreover, the new organisational changes failed to improve the situation in Benin’s cotton sector. Yields and the cultivated area remained low.
G 2012–2016: Public Mode of Organisation Is Back
In April 2012 an international commission reported serious management problems by AIC. The problems included an over-estimation of the value of input supplied in the field, under-estimation of seed cotton submitted at gin factories, and mismanagement of government subsidies. Hence, the government cancelled the agreement signed in 2009 with AIC and a public mode of organisation took over its management. An inter-ministerial commission assumed the responsibilities of AIC, and SONAPRA and ONS were the main operational organisations. This new public management remained in place till April 2016, when President Boni Yayi finished his term. During this period the cotton sector continued to suffer, however. One positive change perhaps was a strategy introduced to check input consumption in the field. The national statistics institute went into the field with GPS to check accurately the size of land area of cotton in order to verify the input consumption requested. Several times discrepancies were found, and the additional money was recovered. This system continues to be implemented today.
H 2016–Present: Private Mode of Organisation Remains
In May 2016 President Talon re-established AIC after he was voted into office in April. An audit requested by the Talon government reported several mismanagement problems in the public governance of the cotton sector in 2012–2016. The new regime abolished around ten agricultural government agencies, including SONAPRA, ONS, and the CARDERs. Moreover, it initiated a broader reform agenda in the agricultural sector, where nine new regional development agencies were created. In addition, the government abolished subsidies to the cotton sector.
During the institutional survey developed for Chapter 3, the experts were not enthusiastic about these reforms.Footnote 51 Since 2016, however, seed cotton production has been increasing, according to data published by Benin’s GovernmentFootnote 52 (451,124 tonnes in 2016, 597,397 tonnes in 2017, 678,000 tonnes in 2018, 714,714 tonnes in 2019, and 728,000 tonnes in 2020). These figures suggest that the sector has been improving since 2016. The data presented in reports by PR/PICA also confirm this improvement in 2016–2018. The available information from AIC and INSAE indicates that the recent improvement can be explained by increases in both yields and acreage. Other this period (2016–2018) the producer price has not changed. As a result, this recent improvement in production, yields, and acreage could be related to changes in the organisation and the management of the sector by AIC and the government.
It is too early to further elaborate on the recent performance, as we currently lack systematic and consistent information in this regard; we therefore leave this analysis for future research. Gérald Estur, an expert who is familiar with the issues Africa’s cotton industry is facing, argued in May 2019 that this recent improvement in Benin’s cotton performance is related to changes in the management of the sector since the new government took power over the last three years. According to the expert, the changes have helped to restore trust among the stakeholders in the sector. The changes include a vertically integrated coordination approach by the government, timely payment of cotton growers, and efficient delivery of inputs.Footnote 53
V Concluding Remarks
The cotton sector presents a unique opportunity to understand the causes and consequences of institutional changes in Benin over a long historical period. The sector has operated under different modes of organisation, oscillating between public and private monopolies over time, as summarised in Table 5.1. Initially, the cotton sector was managed by French entrepreneurs. From the end of the 1940s the sector came under the control of a French parastatal monopoly, the CFDT, which helped to modernise the sector with the support of development aid. In 1972, the Marxist–Leninist regime of Kérékou nationalised the CFDT, which was replaced by a number of government agencies. The system thus disintegrated, which increased coordination costs and resulted in poor performance. Thereafter, the sector entered a first restructuring period in the early 1980s and the government agencies were re-integrated into a single state agency, SONAPRA. Poor management problems and adverse world price shocks undermined the sector’s performance in 1986. After another restructuring plan the sector started a liberalisation period in 1992, after the country achieved a successful democratic transition in 1990. In particular, a liberalisation plan was implemented in 1992–1998 and private Beninese entrepreneurs started operating in the inputs and ginnery components of the sector. Thereafter, the sector experienced a crisis from the late 1990s and an inter-professional association of private entrepreneurs, AIC, became responsible for the management of the sector in 2000–2006, but the government continued to play an important role. In 2007 a new government suspended AIC. Thereafter, SONAPRA was privatised in 2008 and a dominant private group emerged. AIC became responsible again for the sector in 2009, but new problems in the sector led the government to suspend AIC from 2012 until 2016, when AIC was again given the management of the sector.
Table 5.1 Overview of mode of organisation of cotton across political regimes in Benin, 1960–present
| Periods | 1960–1971 | 1972–1990 | 1991–1998 | 1999–2005 | 2006–2015 | 2016–present | ||
|---|---|---|---|---|---|---|---|---|
| Quick outlook | Post-independence | Revolutionary period | Onset of liberalisation | Liberalisation’s rectification, cotton boom, and disastrous management | Dwindling private and public management, and last crash in the sector | Recovery of the cotton sector | ||
| Trends in cotton exports | Upward | Downward | Mixed upward trend | Upward trend | ||||
| Trend | Trend | |||||||
| Successive presidencies | 1960–1971 | 1972–1991 | 1991–1995 | 1996–2000 | 2001–2005 | 2006–2010 | 2011–2015 | 2016– |
| Presidents | Triumvirate* | Mathieu Kérékou | Nicéphore Soglo | Mathieu Kérékou | Mathieu Kérékou | Boni Yayi | Boni Yayi | Patrice Tallon |
| Approach of political control of the cotton subsector | Private oligopoly under spurious public control | Public monopoly under spurious collectivism | Embracing liberalisation and privatisation at the onset of democracy | Reconsidering privatisation, search for humanity in sectoral democracy | Political in-meshing and disastrous management of the cotton subsector | Enhanced private oligopoly and political interests in the cotton subsector | Strong clash between political interests and private benefits | Private mode of organisation under AIC |
| Export performance and sector’s competitiveness | ||||||||
| Cotton exports (1000 US$) | 2 193 | 22 416 | 98 800 162 990 | 160 716 | 135 347 | 216 895 | ||
* The triumvirate (Maga, Apithy, Ahomadégbé) was disturbed by many military coups d’états: Alley, Zinsou, Kouandété, etc.
What are the common causes of these institutional changes? What are the common institutional weaknesses in the cotton sector in Benin? What are their consequences for economic development in Benin? Can Benin develop a long-term development strategy based on cotton?
A Institutional Changes and Institutional Weaknesses: Causes and Consequences
There are a number of institutional weaknesses that can be derived from the foregoing analysis in the chapter: the discontinuity of regulations, reforms, policies, planned actions, or mandates of an organisation; the weak regulation of businesses (privatisation and liberalisation, licence management, financial management, accounting and auditing systems); weak capacity in public administration (including issues related to data management); vulnerability to world price shocks; excessive government and political interference; political appointments; overlapping responsibility; weak coordination; and imperfect credit markets, asymmetrical information, and weak contract enforcement. These weaknesses are potentially caused by rent-seeking; election and mass support; low technical and financial capacity; donors’ ideologies and their interests; poor management of conflict of interest; the ideology of political actors; colonisation and national anti-colonial revolution; culture; weak campaign financing; power concentration at the executive level; and distortions caused by subsidies in the dominant world cotton producers. We will now elaborate on a few of these institutional bottlenecks.
1 Discontinuity of Regulations, Reforms, Policies, Planned Actions, or Mandates of Cotton Organisations
This characterises a situation in which a government abruptly overturns existing regulations, reforms, policies, or planned actions by the previous government, or re-assigns the mandates of organisations in the cotton sector. This type of institutional weakness has been common over the whole historical period. In 1972, for instance, the military regime unexpectedly reversed the agreed decision between donors and the previous government that SONACO would contract with CFDT and SATEC to manage field activities (distribution of inputs, technical and extension services, transport, marketing). In the same way the governance of AIC was sharply interrupted several times by successive governments in the period 2006–2016. Furthermore, SONAPRA suddenly re-appeared in input supply and distribution in 2007 and 2012–2016, whereas a regulation already excluded it from participating in these activities in 1995.
Several factors may cause this type of institutional bottleneck: for instance, the Marxist–Leninist ideology of the revolutionary regime of the 1970s, the pronounced anti-colonial revolution at that time, and rent-seeking by supporters of the regime may explain why CFDT did not continue to play a dominant role in the cotton sector in Benin, but instead SONACO and other newly created government agencies suddenly took over the responsibilities. In the same way, rent-seeking, weak campaign financing, and electoral institutions, as well as the poor regulation of businesses, that characterise Benin may promote business–politics clientelist contracts, as elaborated in Chapter 4, and this could potentially explain the conflicts that emerged following the liberalisation and privatisation of the cotton sector in the 1990s. The dominant power of the new actors in the cotton sector, the excessive power of the executive, together with weak campaign financing and electoral institutions, could in turn explain the fluctuation between the public and private types of governance that we have witnessed since the 2000s.
This institutional weakness causes an increase in uncertainty in the cotton sector and increases the cost of agricultural services and the quality of input required by the farmers. As a result, it will discourage the production of cotton and/or induce low yields, which in turn will undermine the welfare of producers.
2 Weak Capacity in Public Administration, Colonisation, Donors’ Ideology and Their Interests
Donors, essentially France and the World Bank, have played a key role in the development of the cotton sector in Benin. The French colonisation and the interest of France in outsourcing its industries were the first explanatory causes of the development of the modern cotton industry in Benin. The French cotton institutions, such as the vertically integrated system of the value chain and the price stabilisation mechanism, initiated in the colonial period continue to persist today in Benin. Because the public administration of Benin has weak capacity, Benin requested the World Bank to join forces in developing the cotton sector further. The World Bank’s view of the organisation of the value chain is a bit different from that of France, in that it promotes a competitive-type system. The World Bank’s view has dominated in the institutional choices made for the management of Benin’s cotton sector, because the Marxist–Leninist government undermined the French interests in the 1970s given the anti-colonial sentiment that was observed at that time. Moreover, the pioneering role of Benin in its democratic transition and market economy in francophone Africa further contributed to making Benin different in the liberalisation and privatisation process in the cotton sector in West Africa.
In the 1990s, however, the liberalisation and privatisation of Benin’s cotton sector generated problems, as already explained. These problems then attracted more donors to the sector (Hougni and Moreira, Reference Hougni and Moreira2019). If the new donors differed also in ideology as regards the organisation of the cotton sector, then the increase in the number of donors could be expected to have increased the coordination cost to manage the influx of aid in the sector, and also further contribute to the problems the sector experienced. In the absence of evidence for this, however, it remains speculative.
B Long-Term Development Issues
We end the analysis with a discussion of two issues. First, is the current mode of organisation of the Benin cotton sector the most welfare enhancing for the country? Second, should Benin still rely on cotton for its long-term development strategy?
On the first question, the current system of a national integrated value chain is certainly less efficient than the alternative of regionalisation in the management of cotton’s activities. It is now clear why the former was selected at the national workshop in May 2000. The other francophone countries in West Africa (Burkina Faso, Côte d’Ivoire, and Mali) currently operate with a regionalisation system, although a pan-national pricing system is still in place in some of them. Perhaps one explanation for Benin’s choice is because the system has created a dominant player that was afraid to lose power if the management were to be regionalised at that time, when the privatisation of SONAPRA had not taken place. The national integrated system is inefficient because cotton issues are being addressed in the same manner in the country as if the regional producing areas were the same. We know, however, that the regions are different. For instance, because the Zou–Collines region’s climatic conditions generate humidity, more specific solutions should target that region. As a result, the research body should develop specific crop varieties that resist the specific crop diseases of each region, instead of imposing a unique crop variety for the whole country as is currently done. In a recent study, Hougni et al. (Reference Hougni, Imorou and Dagoudo2016) show among seven varieties of cotton – E 944-2, E 956-2, H 769-5, H 782-3, I 875-3, K 768-3, and H 279-1 – that cotton-producing regions in Benin show significant differences in yield and production across these seven varieties. The pan-national pricing system of seed cotton and input cost is also inefficient, because farmers are spread across different geographical locations and the current system implies that some farmers are subsidised by others. The system is therefore more egalitarian because it transfers resources from farmers that are more productive to the ones that are less productive. Note, however, that the farmers that seem to be less productive are more likely to be located in the central region where the majority of gin factories are located. As such, it is not clear a priori how the system actually works, and a more in-depth study would be needed to shed light on the distributional aspect of the current system. A distributional analysis of the value-added across the different actors in the cotton sector is also needed, as we currently lack information for such an analysis.
With regards to the second question, the answer will depend on the conditions related to the world demand for cotton fibres if Benin were to continue to specialise in the export of this type of output.Footnote 54 The discussion presented in Section II suggests that in absolute terms the world demand for cotton fibre is continuing to grow. The question that thus arises is to what extent Benin is competitive in producing cotton fibre, allowing it to maintain its market share in the world market. Benin has a comparative advantage in producing cotton, certainly in the Borgou region, where the agro-climatic conditions are the most favourable. A number of studies also claim that Benin has a revealed comparative advantage in the production of cotton (e.g. World Bank, 2017). Ideally, we would like to compare consistent production costs across countries and over time, but we currently lack such data and we leave it for further research. Instead, we examine the market share of cotton exports in Benin and a number of comparator countries in Africa in the period 1995–2017 using data from the Observatory of Economic Complexity.Footnote 55 Overall, the market shares of the majority of countries started to decrease from 2015–2016. If this trend continues, then there is reason to worry about this issue. We will investigate this point further by including comparators outside Africa.
Burkina Faso easily outperforms the other countries. Benin displays an average performance, although its situation improved significantly in the 1990s, but it deteriorated dramatically following the introduction of the AIC governance. The situation improved again in 2011–2015.
Along with starchy staple crops, cotton dominates the farming landscape in West Africa. Cotton is primarily cultivated under rainfed conditions in rotation with maize, sorghum, and/or millet on small family farms that average fewer than ten hectares. Being the primary source of income for millions of smallholder farmers, cotton can help reduce poverty and improve food and nutrition security. As a main source of export revenue, cotton has wide-reaching implications for poor developing economies in West Africa.
The extent that cotton contributes to the socio-economic development of West African countries depends heavily on the economic performance of their cotton sectors. In turn, the incentive structure embodied in institutions influences the cotton sector’s economic performance. Supportive institutions positively affect the ability of individuals and organisations to respond to new opportunities and challenges. Well-designed institutions provide incentives for individuals and organisations to invest, can limit the economic and political power of the elites, and create more economic equal opportunities for a greater share of the population (Acemoglu, Reference Acemoglu2003).
Over the last several decades, major institutional changes have been experimented with in West African cotton sectors, with the goal of increasing economic performance. These have included changes in social, political, and economic institutions, coming especially from market liberalisation and privatisation. With institutional changes come shifts in incentives and distributional power. These shifts have affected the economic performance of multiple West African cotton sectors, including those of Benin, Burkina Faso, and Mali.
West African cotton sectors compete in a highly competitive and global environment. Although cotton production and exports are key to their economies, West African countries play a relatively small role in the international cotton market compared to larger cotton producers and exporters, such as China, India, and the USA. As smaller players on the global stage, they need the ability to adapt to external forces (e.g. price fluctuations, tariffs, subsidies). In addition, West African cotton sectors face internal constraints that can impede economic development, such as missing or imperfect access to inputs, financing, and insurance. Well-designed and implemented cotton-based institutions can help mitigate both external and internal challenges and support the socio-economic development of their countries.
Many institutional changes have occurred in the West African cotton sectors since achieving independence and a common goal has been improving economic performance. These changes can be grouped into four general periods: (1) contract with the French parastatal; (2) nationalisation of cotton gins; (3) implementation of market-oriented reforms; and (4) post-market reforms. Several indicators have been used to assess the economic performance of West African cotton sectors. These include production and yield; price; access to inputs, credit, and extension services; cotton quality; farm technical efficiency; research and development; export revenues; and profitability (Thériault and Serra, Reference Thériault and Serra2014; Thériault and Tschirley, Reference Thériault and Tschirley2014; Tschirley et al., Reference Tschirley, Poulton and Labaste2009).
John R. Commons’ institutional economic framework is well adapted to understanding the evolution in institutions and their related effects on economic performance (Thériault and Sterns, Reference Thériault and Sterns2012; Commons, Reference Commons1934). According to Commons’ framework, actions to address limiting factors are the drivers of institutional changes. These actions have both intended and unintended consequences that affect economic performance, which in turn can lead to the advent of a new set of limiting factors. New sets of limiting factors resume the cycle of institutional change. Each institutional change generates a new incentive structure and affects power dynamics within the sector. Stakeholders are more likely to resist changes that would decrease their power.
I Contract with the French Parastatal (1960 to MID-1970s)
Before the country’s independence, the French parastatal, CFDT, had significant control over the cotton sectors in which it operated, managing farm input delivery and the grading and weighing of seed cotton, as well as exports. In return for its monopoly status, the French parastatal agreed to purchase all cotton production at guaranteed fixed prices announced before the planting season. During this period, production went up and the CFDT was profitable. However, much of the profits were retained by the French parastatal and little was reinvested in West Africa, and this impeded economic development.
II Nationalisation Of Cotton Gins (Mid-1970s to Mid-1990s)
One of the major institutional changes corresponds to the end of the monopoly contract with the CFDT. To encourage economic development after independence, several West African governments nationalised their cotton sectors, which gave them control over the allocation of cotton export revenue. During this nationalisation period, cotton became a primary vehicle for boosting agricultural productivity and helped to promote integrated rural development (Thériault and Tschirley, Reference Thériault and Tschirley2014). Both cotton and cereal yields benefited from greater public investments. State-owned enterprises played an important role in developing and maintaining rural roads infrastructure, providing access to drinkable water, and reducing illiteracy. Yet, in the absence of strong institutions, greater power created incentives for rent-seeking behaviours and political interference. Farmers were still lacking a voice in decisions related to cotton activities. The combination of low farm-gate prices, mismanagement, and inefficiencies in ginning operations led to significant debts and discontent among farmers.
III Market-Oriented Reforms (Mid-1990s to Late 2000s)
In response to poor financial performance, donors started to push for market privatisation and liberalisation. The market-oriented reform process gave farmers the opportunity to better organise themselves to increase their voice within the cotton sector. Village-wide, multipurpose farmer associations were transformed into formal groups focused on cotton farmers. More responsibilities, such as the management of farm input credit, were transferred to them. Even though farmers, through their organisations, became more involved in management activities, their limited negotiation power in the determination of the price they received from the gins remained a limiting factor (Thériault and Sterns, Reference Thériault and Sterns2012).
Market reforms were unevenly and partially implemented (Thériault and Serra, Reference Thériault and Serra2014). Benin made stronger attempts to privatise and liberalise its cotton sector than Burkina Faso and Mali. However, the establishment of several new cotton ginneries in Benin did not lead to increased competition, since the vast majority of them fell under the same, private rather than public, ownership. Despite the creation of new gins in Burkina Faso, the former state-owned enterprise continues to be the dominant player. After years of privatisation discussions, the Malian cotton sector remains managed by the state-owned enterprise, although it did undergo a change in management. Several factors can explain the uneven and partial implementation of the reforms, including resistance to change due to a loss of governmental power, as well as scepticism about the need for change and expected outcomes.
IV Post-Market Reforms (Late 2000s to Date)
In the post-market reform era, most efforts have been channelled towards increasing production. When world prices are high, increased production translates into greater export revenues. With greater export revenues, poor financial performance is less apparent, and therefore there is less push for market reforms. Cotton has been and continues to be produced under contract farming conditions, with guaranteed purchase of seed cotton at fixed pre-planting pan-territorial prices, and provision of inputs on credit. Both farm-gate and input prices have been key limiting factors to increased production. Price incentives, in particular through governmental fertiliser subsidies, have been used to encourage farmers to increase cotton production and productivity. But this has not always been enough to keep farmers content, as evidenced by the repeated farmer boycotts in Burkina Faso recently. After years of decline, Benin cotton production has been rising again over the last few years. This increase coincides with the arrival of the new president, who has a vested interest in the Beninese cotton sector (Honfoga et al., Reference Honfoga, Houssa, Dedehounaou, Bourguignon, Houssa, Platteau and Reding2019).
The current economic performance of West African cotton sectors remains highly affected by institutional structure. There is a trade-off between competition and effective coordination (Tschirley et al., Reference Tschirley, Poulton and Labaste2009). Effective coordination tends to facilitate the provision of services and improve the quality of cotton. Market competition tends to provide incentives for higher farm-gate prices and greater cost efficiency at the gin level. In more regulated cotton sectors, such as in West Africa, farmers are provided with extension services and inputs on credit, but receive lower farm-gate prices due to limited competition. The fact that no institutional structure performs unambiguously better across all performance dimensions can, in part, explain the abandonment of market reforms.
The institutional structure also affects the ability of cotton to spur food crop productivity (Thériault and Tschirley, Reference Thériault and Tschirley2014). This indicator has been the strongest in the regulated cotton sectors of West Africa. Direct and indirect pathways, through which state-owned enterprises have contributed to food crop intensification, include input provision and extension advice for food crops and agronomic spill-overs. Moving from a regulated to a more competitive market structure could have affected the food–cotton crop interdependence in West Africa, which may have threatened food security in the region.
Other limiting factors to the economic performance of West African cotton sectors include climate change, invasive species, low technology adoption, and lack of market influence. The increasingly erratic rainfall as a result of climate change has a detrimental impact on cotton production and productivity. The proliferation of counterfactual pesticides makes it more challenging to control for pests, while posing human, environmental, and financial risks to cotton farmers. With limited investment in agricultural research and development, West African cotton sectors are facing low and stagnant yields. Low adoption of technologies by farmers and gins results in low yields, limited traceability, and quality issues from contamination. With low processing capacity and domestic consumption, they are vulnerable to global development.
Moving forward, it is essential that any proposals to reform the West African cotton sectors take into account the institutional setting, such as the strong intertwined relationship between food and cotton crops, in order to avoid major discrepancies between expected and realised economic performance. Increasing farm productivity, while strengthening farmer resilience as well as ginning efficiency, is key to improving the economic performance of the West African cotton sectors. The promotion of regional integration is a viable approach for West African cotton sectors to increase their influence in the international market. Building strong institutions take times, but once built, they help to ensure that economic development occurs in an effective, accountable, and inclusive way.
I Introduction
The 2015 Addis Ababa Conference highlighted the central role of domestic revenue mobilisation for financing development in the context of the Sustainable Development Goals. Improving tax revenue contributes not only to the financing of public spending, but also to reinforcing the accountability of the government (see Brautigam et al., Reference Brautigam, Fjeldstad and Moore2009).
With a tax revenue to gross domestic product (GDP) ratio equal to 13.5 per cent in 2017 (IMF, 2018),Footnote 1 Benin remains below the West African Economic and Monetary Union (WAEMU) criterion of 20 per cent. Meanwhile, at the same date, Togo, a neighbouring country, managed to raise 18.3 per cent of its GDP in terms of tax revenue. Such a gap (between Benin and Togo) is not temporary, but seems to be lasting and has even increased in 2010–2015 (see Figures 6.1a and 6.1b).

Figure 6.1a Share tax over GDP

Figure 6.1b Non-resource tax over GDP
Both countries inherited the same tax law, the French Tax Code, when they gained their independence – on 1 August 1960 for Benin and on 27 April 1960 for Togo. Both countries belong to the same customs and monetary union, WAEMU. The WAEMU Commission has produced several tax Directives, covering the main taxes (corporate income tax, value-added tax, excises, etc.), which aims to bring about tax harmonisation or coordination among the eight member statesFootnote 2 (see Mansour and Rota-Graziosi, Reference Mansour and Rota-Graziosi2013). These Directives strictly limit any potential divergence of Beninese and Togolese tax laws after 1960. However, some discrepancy may still emerge not only in the enforcement of these tax laws by the tax and customs administrations, but also as a result of the scope of derogatory regimes (for instance, the Investment Code) that generate tax expenditures.Footnote 3
An important difference between Togo and Benin relates to the administrative side. In 2014, Togo transformed its tax and customs administrations into a single revenue authority (the Office Togolais des Recettes), while Benin has a more ‘classic’ organisation for French-speaking countries, with two separate administrations: tax and customs administrations.Footnote 4
First, using a database providing information on tax revenue over the period 1980–2015, covering forty-two sub-Saharan African (SSA) countries,Footnote 5 we analyse the efforts by Benin to raise tax revenue, as relates to its structural characteristics. The analysis aims to compare the non-resource tax-to-GDP ratio in Benin with its peers, to identify whether Benin is near to, or far away from, its tax frontier, before exploring possible scope for greater tax revenue raising and for tax policy and administration reforms.
We conclude that the tax effort in Benin has remained relatively stable during the period, with an average of 63.5 per cent of its total potential tax revenue over the period, ranked fourteenth out of forty-two countries. A tax effort of 63.5 per cent means that the level of non-resource tax revenue is at 36.5 per cent of the country’s maximum capacity. Knowing that, on average, Benin collects 11.45 per cent of its GDP in non-resource tax revenue and is at 63.5 per cent of its capacity, it would have raised 18.03 per cent of its GDP as non-resource tax revenue if it had used all its potential, given its characteristics. The estimated gap is higher than that estimated by Cui et al. (Reference Cui, Sola and Dieterich2016), which was 1.5–2 per cent of GDP based on a sample of SSA countries for the period 1995–2011.
The analysis identifies a higher tax effort in Togo, which exhibits a tax effort of 69.9 per cent on average and is ranked fifth out of forty-two countries. Togo would have mobilised 21.61 per cent of non-resource tax revenue as a percentage of GDP if it had made the maximum tax effort. This result appears intuitive. Indeed, Togo has a lower GDP per capita than Benin (US$6,280 for the former and US$6,480 for the latter) and its agricultural share is more important (35.73 per cent of GDP in Togo; 35.11 per cent in Benin). These characteristics penalise the mobilisation of non-resource tax. At the same time, Togo mobilises more non-resource tax revenues (15.11 per cent of GDP in Togo; 11.45 per cent in Benin). Hence, unfavourable characteristics of Togo, combined with its relative success in mobilising revenues, translate into a higher tax effort of Togo with respect to Benin.
Second, we study the effect of some economic and institutional variables on tax effort. While the calculation of the tax effort includes only structural supply factors of the tax pressure as inputs to the stochastic frontier analysis, we then study the effect of demand factors on the estimated level of tax effort.Footnote 6 Using a logistic regression, we study in particular the effect of the presence of natural resources, aid, transparency, corruption, and accountability, and the political regime and stability. We find that aid is associated with a lower probability of belonging to a quartile of high tax effort, while institutional quality – measured by the Country Policy and Institutional Assessment (CPIA) index – increases the probability of belonging to an efficient quartile in terms of tax effort. If the effect of the political system is not clear, political stability is strongly and positively associated with a greater likelihood of having a high tax effort.
Third, we analyse the potential policy and administrative sources of the tax gaps. We shed light in particular on the human resource policy of the tax administrationFootnote 7 and the remuneration mechanisms, which may be obsolete.
The chapter is structured as follows: Section II presents the tax effort estimation; Section III proposes an empirical study of the effect of some institutional and economic factors on the estimated tax effort scores; Section IV reviews some tax policy and tax administrative issues and proposes reforms, with a view to improving tax mobilisation; and Section V concludes.
II Empirical Estimation of Tax Effort in Benin: A Stochastic Frontier Analysis
We define tax effort as the extent to which the actual tax revenue collected is near the maximum level of tax resource that could be collected. In other words, tax effort in Benin is the extent to which Benin makes use of its potential for tax revenue regarding its tax base and its structural supply characteristics.
The empirical analysis is based on a sophisticated stochastic frontier analysis in which commonly used supply factors driving government tax revenue are considered as the inputs and the total non-resource tax revenue as the output (see Box 6.1). The rationale behind these methods is that an economic agent cannot exceed an ‘ideal frontier’, which is the optimal level of output, given the limited endowment of inputs. The tax frontier refers to the tax capacity, which represents the maximum tax revenue that a country could raise given its structural characteristics. The model used in the study by Kumbhakar et al. (Reference Kumbhakar, Lien and Hardaker2014) makes it possible to distinguish country effects, persistent inefficiency, and time-varying inefficiency. Hence, we control for country effects – which capture the effect of time-constant variables for each country – and obtain a total level of inefficiency that is the result of an identified persistent inefficiency and of a time-varying inefficiency for each country.
In the first stage of the estimation, countries’ tax ratio is regressed on a vector of structural explanatory variables. The calculation of the tax effort includes only structural supply factors of the tax pressure as inputs to the stochastic frontier analysis. Demand factors are excluded from the estimation of the tax effort: the impact of these factors on the level of tax effort is studied in the second part of the analysis. Based on the relevant literature on the determinants of government tax revenue, we introduce the following set of inputs in the stochastic frontier analysis:
i. The level of development: Countries’ tax capacity is positively associated with the level of economic development (proxied by real GDP per capita), which is linked to the efficiency of tax administration, the degree of economic and institutional sophistication, and the demand for public goods and services (see Lotz and Morss, Reference Lotz and Morss1967; Tanzi, Reference Tanzi, Newbery and Stern1987; Pessino and Fenochietto, Reference Pessino and Fenochietto2010; Crivelli and Gupta, Reference Crivelli and Gupta2014).
ii. Agriculture value-added (percentage of GDP): In addition to the numerous sectoral tax exemptions and tax holidays typically provided in developing countries, agriculture is often considered hard to tax in developing countries. Focusing on SSA countries, Stotsky and WoldeMariam (Reference Stotsky and WoldeMariam1997) emphasise that the share of value-added of this sector in GDP is negatively associated with tax revenue.
iii. Trade openness: Trade liberalisation policies implemented in most developing countries in the early 1970s have substantially increased trade volume in these countries. Therefore, trade openness expressed as total trade (imports and exports) as a share of GDP is expected to influence tax revenue, in particular through household consumption and domestic corporate profits (Stotsky and WoldeMariam, Reference Stotsky and WoldeMariam1997; Pessino and Fenochietto, Reference Pessino and Fenochietto2010; Keen and Perry, Reference Keen and Perry2013, among others).
iv. Financial development: High financial development combined with high access to credit allows individuals and firms to finance profitable projects, which favour tax collection (Gordon and Li, Reference Gordon and Li2009). On the other hand, in the presence of an ineffective financial system, firms can successfully evade tax payment by conducting business in cash, which is harder for tax administrations to monitor.
Table 6.1 displays the pairwise correlation between interest variables. As expected, all variables are positively associated with non-resource tax revenues, except the agriculture sector, which is significantly and negatively correlated with non-resource tax revenues. The detailed sources and definitions of variables are provided in the Appendix to this chapter (Table 6.A1).
Table 6.1 Pairwise correlation between interest variables
| [1] | [2] | [3] | [4] | [5] | |
|---|---|---|---|---|---|
| (1) Non-resource taxes (% GDP) | 1 | ||||
| (2) GDPPC (constant 2010 US$) | 0,51Footnote * | 1 | |||
| (3) Total trade (% of GDP) | 0,43Footnote * | 0,63Footnote * | 1 | ||
| (4) Agriculture, value-added (% GDP) | −0,54Footnote * | −0,62Footnote * | −0,62Footnote * | 1 | |
| (5) Financial development index | 0,62Footnote * | 0,37Footnote * | 0,37Footnote * | −0,59Footnote * | 1 |
* Coefficient significant at 10% level. GDPPC, gross domestic product per capita.
Box 6.1 Estimation Strategy: Stochastic Frontier Analysis
An approach that is increasingly being used to capture countries’ tax effort is the stochastic frontier method, which was introduced in the seminal work of Aigner et al. (Reference Aigner, Lovell and Schmidt1977) to model firms’ production behaviour (see Pessino and Fenochietto, Reference Pessino and Fenochietto2010; Langford and Ohlenburg, 2015). The literature proposes several parametric and non-parametric models for stochastic frontier estimation. Data envelopment analysis (Charnes et al., Reference Charnes, Cooper, Lewin and Seiford2013) and the free disposal hull (Deprins et al., Reference Deprins, Simar, Tulkens, Marchand, Pestieau, Tulkens, Marchand, Pestieau and Tulkens1984) are the two main – and increasingly popular – methods used for non-parametric stochastic frontier models. The main disadvantage of such methods lies in the fact that the production function is more heavily influenced by outliers, and thus more vulnerable to measurement errors (Clements, Reference Clements2002).
We draw on a parametric model to estimate the tax effort as we are dealing with a single output (the total non-resource tax-to-GDP ratio). In panel data analysis, parametric models can be categorised into five groups: (1) time-invariant technical inefficiency models; (2) time-varying technical inefficiency models; (3) models that separate firm heterogeneity from inefficiency; (4) models distinguishing persistent and time-varying inefficiency; and (5) models separating firm effects, persistent inefficiency, and time-varying inefficiency. We use the model by Kumbhakar et al. (Reference Kumbhakar, Lien and Hardaker2014) that makes it possible to distinguish country effects, persistent inefficiency, and time-varying inefficiency. We estimate the following equation:
 (1)
(1) (2)
(2)
The dependent variable  (Equation 1) represents the natural logarithm of total non-resource tax revenue. The subscripts i and t and denote country and time dimensions, respectively.
  is a vector of structural and institutional factors explaining countries’ tax ratios, which are one period lagged to mitigate endogeneity issues and to account for delays in their effect on non-resource tax revenue. Time-invariant country-level characteristics that could potentially affect government non-resource tax revenue are captured by ψi. The last term,
  , is a three-component error term (Equation 2) including time-invariant tax inefficiencies
  (i.e. persistent tax inefficiencies owing, for instance, to sociological, cultural, religious, or geographical factors) and time-varying tax inefficiency
  (e.g. tax losses due to tax policy, tax administration, or tax officials’ qualifications, which can change over time). Thus, the model makes it possible to identify persistent and time-varying factors determining SSA countries’ tax effort.
The combination of Equation 1 and Equation 2 can be rewritten as follows:
 (3)
(3)with:
 (4)
(4) (5)
(5) (6)
(6)
Equation 3 is then estimated following a three-stage procedure: (1) In stage 1, the  is estimated by performing a random-effect-based regression (Equation 3). This stage gives the predicted values
  and
and  of
of  and
and  , respectively. (2) In stage 2, the time-varying tax inefficiency,
  , is estimated using the predicted values
  and
and  from the first stage. To do this, Equation 6 is estimated by performing a standard stochastic frontier technique. Using Battese and Coelli’s (Reference Battese and Coelli1988) model, this procedure gives the prediction of the time-varying tax effort,
  ; (3) Finally, in stage 3, the persistent tax inefficiency component
  , is estimated by performing a stochastic frontier model on Equation 5 as in the previous stage. The persistent tax effort is then predicted and given by
  . Hence, the overall tax effort is obtained by the product of the time-varying tax effort and the persistent tax effort.
Table 6.2 presents the summary statistics for the full sample and for Benin and Togo. Benin is generally below the mean for the full sample (except for the agriculture share). It is slightly above the average of its income group, the low-income countries. Benin and Togo have very similar characteristics. As we noted, however, the ratios of tax and non-resource tax over GDP are higher on average in Togo than in Benin (Figure 6.1), while Benin has a higher GDP per capita and a lower agriculture share, which should facilitate tax revenue mobilisation. Although Togo has a higher trade openness and a better financial development index, this is not sufficient to explain the far higher tax over GDP ratio for Togo relative to Benin. While Benin’s performance is growing relatively steadily, Togo’s performance is more unstable. Except over the period 1992–2002, the ratios of tax and non-resource tax over GDP have been lower in Benin than in Togo (for more details see Caldeira and Rota-Graziosi, Reference Caldeira, Rota-Graziosi, Bourguignon, Houssa, Platteau and Reding2019).
Table 6.2 Descriptive statistics
| Variable | Mean | Standard deviation (SD) | Median | Min | Max |
|---|---|---|---|---|---|
| Full sample | |||||
| Total taxes (% GDP) | 16.19 | 8.97 | 13.79 | 0.57 | 53.33 |
| Non-resource taxes (% GDP) | 12.46 | 6.67 | 11.14 | 0.55 | 49.85 |
| GDPPC (constant 2010 US$) | 6.92 | 1.06 | 6.68 | 4.87 | 10.16 |
| Agriculture, value-added (% GDP) | 27.64 | 15.74 | 29.14 | 0.89 | 72.03 |
| Total trade (% of GDP) | 73.97 | 47.07 | 60.98 | 6.32 | 531.74 |
| Financial development index | 0.11 | 0.08 | 0.10 | 0.00 | 0.64 |
| Benin | |||||
| Total taxes (% GDP) | 11.92 | 2.57 | 12.45 | 6.76 | 16.04 |
| Non-resource taxes (% GDP) | 11.46 | 2.29 | 12.02 | 6.36 | 14.96 |
| GDPPC (constant 2010 US$) | 6.50 | 0.09 | 6.48 | 6.36 | 6.70 |
| Agriculture, value-added (% GDP) | 35.11 | 1.92 | 31.92 | 31.54 | 39.01 |
| Total trade (% of GDP) | 55.37 | 8.00 | 56.24 | 38.30 | 76.53 |
| Financial development index | 0.09 | 0.01 | 0.09 | 0.07 | 0.11 |
| Togo | |||||
| Total taxes (% GDP) | 16.89 | 5.96 | 15.28 | 7.71 | 30.15 |
| Non-resource taxes (% GDP) | 15.11 | 4.57 | 15.07 | 6.27 | 26.17 |
| GDPPC (constant 2010 US$) | 6.26 | 0.09 | 6.26 | 6.01 | 6.53 |
| Agriculture, value-added (% GDP) | 35.73 | 4.22 | 35.20 | 26.96 | 44.14 |
| Total trade (% of GDP) | 90.22 | 15.61 | 92.32 | 56.48 | 125.03 |
| Financial development index | 0.10 | 0.01 | 0.10 | 0.07 | 0.12 |
Table 6.3 presents the three-stage estimation results. The first-stage estimation involves regressing countries’ tax ratio on a vector of explanatory variables. All variables have the expected sign and are strongly significant at the 1 per cent level: per capita real GDP, trade openness, and financial development are positively associated, while the share of the agriculture sector is negatively and significantly correlated with non-resource tax revenues (Table 6.3 A). The level of development measured by the per capita real GDP has a significant effect on countries’ non-resource tax ratio: a 1 per cent increase in real GDP per capita is associated with a 0.243 percentage point increase in non-resource tax revenue.
Table 6.3 Three-stage estimates of the tax effort in sub-Saharan African countries
| (A) First-stage random-effect estimates | ||||||
|---|---|---|---|---|---|---|
| Dependent variable | [1] NRTAX | [3] CIT | [4] PIT | [5] Goods and services | ||
| Log GDPPC(–1) (constant 2010 US$) | 0.235*** | (0.0331) | 0.457*** | 0.240*** | 0.202*** | |
| (0.0361) | (0.0552) | (0.0565) | (0.0725) | |||
| Agriculture, value-added(–1) (% of GDP) | –0.056*** | (0.0141) | 0.406*** | 0.456*** | 0.141* | |
| (0.0420) | (0.0625) | (0.0682) | (0.0847) | |||
| Total trade(–1) (% of GDP) | 0.018*** | (0.0042) | −0.0128 | −0.440*** | −1.018*** | |
| (0.0121) | (0.0137) | (0.0173) | ||||
| Financial development(–1) | 0.526*** | (0.1238) | −0.0827*** | −0.142*** | 0.0274 | |
| (0.133) | (0.199) | (0.223) | (0.269) | |||
| Constant | 0.622*** | (0.247) | −4.452*** | −2.260*** | 1.028 | |
| (0.405) | (0.580) | (0.617) | (0.818) | |||
| Observations | 1190 | 1.204 | 1.117 | 1.12 | 1.185 | |
| R-squared | 0.1994 | 0.794 | 0.656 | 0.739 | 0.568 | |
| No. of countries | 39 | 41 | 40 | 40 | 41 | |
| Country FE | yes | yes | yes | yes | yes | |
| (B) Second stage, estimation of the time-varying tax inefficiency (stochastic frontier) | ||||||
|---|---|---|---|---|---|---|
| Number of observations = 1,190 | ||||||
| Wald chi2(1) = 430.30 | ||||||
| Log likelihood = 73.1133 | Prob > chi2 = 0.000 | |||||
| Error | Coefficient | Standard error | z | P>|z| | [95% confidence interval] | |
| frontier | one | 0.238*** | 0.0114 | 20.74 | 0.000 | 0.2159 0.2609 |
| usigmas | _cons | −2.385*** | 0.0911 | −26.16 | 0.000 | −2.5637 −2.2064 |
| vsigma | _cons | −3.875*** | 0.1076 | −36.02 | 0.000 | −4.0862 −3.6645 |
| (C) Third stage, estimation of time-varying tax inefficiency (stochastic frontier) | ||||||
|---|---|---|---|---|---|---|
| Number of observations = 1,190 | ||||||
| Wald chi2(1) = 1447.19 | ||||||
| Log likelihood = –543.512 | Prob > chi2 = 0.000 | |||||
| Error | Coefficient | Standard error | z | P>|z| | [95% confidence interval] | |
| frontier | one_te | 0.509*** | 0.0133 | 38.04 | 0.000 | 0.482 0.535 |
| usigmas | _cons | −1.009*** | 0.0584 | −17.27 | 0.000 | −1.124 −0.894 |
| vsigma | _cons | −3.463*** | 0.1078 | −32.12 | 0.000 | −3.6747 −3.2520 |
| (D) Summary of the estimation results | ||||||
|---|---|---|---|---|---|---|
| Observations | Mean | Standard deviation | Min | Max | ||
| Time-varying tax effort | 1,190 | 0.8005 | 0.1043 | 0.1689 | 0.9577 | |
| Persistent tax effort | 1,190 | 0.6724 | 0.1702 | 0.0444 | 0.9307 | |
| Total tax effort | 1,190 | 0.5396 | 0.1548 | 0.0218 | 0.8268 | |
Standard errors in parentheses; *** p<0.01, ** p<0.05, * p<0.1. CIT, corporate income tax revenue; NRTA, non-resource tax revenue; PIT, personal income tax revenue.
From that first stage, the Kumbhakar et al. (Reference Kumbhakar, Lien and Hardaker2014) model determines the maximum tax potential for each country, given its structural characteristics, estimates the persistent and time-varying inefficiencies, and computes the total inefficiency. On average in the period, SSA countries are at 53.96 per cent of their potential, so that they have room for about 46.04 per cent additional non-resource tax revenue (see Table 6.3 D). Knowing that, on average, countries collect 12.46 per cent of their GDP in non-resource tax revenue, they would have raised 23.09 per cent of their GDP as non-resource tax revenue if they achieved their maximal capacity, given their characteristics. The differences in total tax effort across SSA countries are mainly driven by persistent factors: the full sample average stands at 0.8005, 0.6724, and 0.5396 for the time-varying, the persistent, and the total tax effort, respectively. That room includes both tax administration (e.g. corrupt tax officers, tax evasion, inadequacy of tax administrations, tax exemptions, etc.) and tax policy. It is hard to determine whether persistent and variant inefficiencies are attributable to a tax gap or an administrative gap. If there is a tendency to associate the persistent inefficiencies with an administrative gap, and time-varying inefficiencies with a tax policy gap, significant administrative reforms may be implemented over time while tax policy may experience some persistence over time. In any case, the persistent factors – whether they come from administrative or tax policy inefficiencies – explain the major part of the inefficiencies.
Table 6.4 provides a country ranking over the period studied based on their total tax effort scores.Footnote 8 Lesotho, Burundi, and Malawi appear to be the most efficient countries, while Equatorial Guinea, Angola, and Nigeria record the lowest tax efforts. The tax revenue ratio as a percentage of GDP is high in efficient and low in non-efficient countries. At the same time, Angola and Equatorial Guinea have GDP per capita levels well above the average. Thus, Angola and Equatorial Guinea’s poor performance are the result of the combination of low output and advantageous inputs. These two countries are rich in natural resources and the effort made to raise non-resource tax revenues appears to be very low. By contrast, Burundi manages to raise more revenues than the average while its characteristics are very unfavourable. Over the 2001–2015 subperiod, Togo emerges as the top performer, with a tax effort score of 0.78 in 2015 (rank 1).
Table 6.4 Full sample tax effort-based ranking
| Country | Average tax effort | Rank | Country | Average tax effort | Rank |
|---|---|---|---|---|---|
| Lesotho | 0.767 | 1 | Swaziland | 0.555 | 21 |
| Burundi | 0.758 | 2 | Uganda | 0.547 | 22 |
| Malawi | 0.72 | 3 | Seychelles | 0.545 | 23 |
| Ethiopia | 0.704 | 4 | Mali | 0.539 | 24 |
| Togo | 0.699 | 5 | Cabo Verde | 0.524 | 25 |
| Gambia | 0.695 | 6 | Ghana | 0.495 | 26 |
| Senegal | 0.669 | 7 | Guinea | 0.484 | 27 |
| Mozambique | 0.669 | 8 | Cameroon | 0.474 | 28 |
| Namibia | 0.658 | 9 | South Africa | 0.462 | 29 |
| Kenya | 0.658 | 10 | Sierra Leone | 0.446 | 30 |
| Zambia | 0.656 | 11 | Mauritius | 0.405 | 31 |
| Côte d’Ivoire | 0.652 | 12 | Guinea-Bissau | 0.384 | 32 |
| Rwanda | 0.649 | 13 | Botswana | 0.366 | 33 |
| Benin | 0.635 | 14 | Congo Republic | 0.331 | 34 |
| Comoros | 0.615 | 15 | Gabon | 0.274 | 35 |
| Niger | 0.6 | 16 | Chad | 0.274 | 36 |
| Burkina Faso | 0.598 | 17 | Nigeria | 0.257 | 37 |
| Central African Republic | 0.583 | 18 | Angola | 0.219 | 38 |
| Madagascar | 0.579 | 19 | Equatorial Guinea | 0.033 | 39 |
| Tanzania | 0.571 | 20 |
The average tax effort score for the full sample – which amounts to around 54 per cent – remained on average relatively stable (Figure 6.2) during the period. Starting in the late 1980s for Benin and early 1990s for Togo, the performance in terms of tax effort for both countries has improved. The trend for Togo is more one of boom and bust, but the gap in performance between the two countries stands around 6 percentage points. Togo has 9 percentage points more than Benin at the end of the period and ranks first among all countries. However, with a total tax effort level of 0.78 and 0.69 in 2015, Togo and Benin have not recovered their level of tax effort of the beginning of the period. Nigeria, Côte d’Ivoire, Cameroon, and Malawi also experienced an overall decline in performance during the period. Togo has experienced an increase in the last fifteen years (Figure 6.3). By contrast, Benin’s tax effort has declined over the same period.

Figure 6.2 Tax performance over time

Figure 6.3 Growth rate of tax effort over the period 2000–2015
We extend the analysis by estimating the tax effort by type of tax: value-added tax (VAT), corporate income tax, personal income tax, trade tax, and excise (Table 6.5). These results should be interpreted with caution. Indeed, tax revenue determinants of the different taxes (inputs) may differ. At the same time, comparison would be complex if a different model were determined for estimating the tax effort for each type of tax. We therefore chose to maintain the same model.
Table 6.5 Tax effort by type of tax
| VAT | Tax effort | Rank | Corporate income tax | Tax effort | Rank | Personal income tax | Tax effort | Rank | Trade tax | Tax effort | Rank | Excise | Tax effort | Rank |
|---|---|---|---|---|---|---|---|---|---|---|---|---|---|---|
| Angola | NA | NA | Angola | NA | NA | Angola | NA | NA | Angola | 0.683 | 5 | Angola | NA | NA |
| Burundi | NA | NA | Burundi | 0.712 | 2 | Burundi | 0.544 | 2 | Burundi | 0.663 | 31 | Burundi | NA | NA |
| Benin | 0.686 | 4 | Benin | 0.344 | 13 | Benin | 0.396 | 14 | Benin | 0.666 | 28 | Benin | 0.739 | 15 |
| Burkina Faso | 0.677 | 6 | Burkina Faso | 0.326 | 14 | Burkina Faso | 0.445 | 10 | Burkina Faso | 0.677 | 10 | Burkina Faso | 0.748 | 6 |
| Botswana | 0.634 | 12 | Botswana | 0.169 | 33 | Botswana | 0.14 | 35 | Botswana | 0.677 | 9 | Botswana | NA | NA |
| Central African Rep | 0.469 | 27 | Central African Rep | 0.184 | 31 | Central African Rep | 0.456 | 6 | Central African Rep | 0.657 | 37 | Central African Rep | 0.739 | 16 |
| Côte d’Ivoire | 0.479 | 25 | Côte d’Ivoire | 0.24 | 27 | Côte d’Ivoire | 0.339 | 22 | Côte d’Ivoire | 0.673 | 15 | Côte d’Ivoire | 0.708 | 28 |
| Cameroon | 0.664 | 9 | Cameroon | 0.279 | 22 | Cameroon | 0.315 | 23 | Cameroon | 0.669 | 25 | Cameroon | 0.746 | 7 |
| Congo, Dem. Rep. | NA | NA | Congo, Dem. Rep. | NA | NA | Congo, Dem. Rep. | NA | NA | Congo, Dem. Rep. | NA | NA | Congo, Dem. Rep. | NA | NA |
| Congo, Rep. | NA | NA | Congo, Rep. | 0.199 | 29 | Congo, Rep. | 0.197 | 32 | Congo, Rep. | 0.662 | 33 | Congo, Rep. | NA | NA |
| Comoros | 0.446 | 30 | Comoros | 0.283 | 20 | Comoros | 0.208 | 30 | Comoros | 0.671 | 19 | Comoros | 0.738 | 17 |
| Cabo Verde | 0.709 | 3 | Cabo Verde | 0.282 | 21 | Cabo Verde | 0.299 | 26 | Cabo Verde | 0.683 | 4 | Cabo Verde | NA | NA |
| Ethiopia | 0.61 | 15 | Ethiopia | 0.666 | 4 | Ethiopia | 0.273 | 28 | Ethiopia | 0.67 | 21 | Ethiopia | 0.734 | 20 |
| Gabon | 0.476 | 26 | Gabon | 0.177 | 32 | Gabon | 0.142 | 34 | Gabon | 0.697 | 2 | Gabon | NA | NA |
| Ghana | 0.571 | 21 | Ghana | 0.296 | 19 | Ghana | 0.39 | 18 | Ghana | 0.678 | 7 | Ghana | 0.738 | 18 |
| Guinea | 0.569 | 22 | Guinea | 0.105 | 37 | Guinea | 0.186 | 33 | Guinea | 0.663 | 32 | Guinea | 0.731 | 22 |
| Gambia, The | 0.669 | 8 | Gambia, The | 0.574 | 5 | Gambia, The | 0.446 | 9 | Gambia, The | 0.68 | 6 | Gambia, The | 0.723 | 25 |
| Guinea-Bissau | 0.462 | 29 | Guinea-Bissau | 0.157 | 34 | Guinea-Bissau | 0.202 | 31 | Guinea-Bissau | 0.67 | 22 | Guinea-Bissau | 0.727 | 24 |
| Equatorial Guinea | 0.236 | 33 | Equatorial Guinea | 0.031 | 38 | Equatorial Guinea | 0.018 | 38 | Equatorial Guinea | 0.651 | 39 | Equatorial Guinea | NA | NA |
| Kenya | 0.595 | 17 | Kenya | 0.729 | 1 | Kenya | 0.519 | 3 | Kenya | 0.667 | 27 | Kenya | 0.748 | 5 |
| Lesotho | NA | NA | Lesotho | 0.267 | 24 | Lesotho | 0.394 | 16 | Lesotho | 0.726 | 1 | Lesotho | NA | NA |
| Madagascar | 0.587 | 18 | Madagascar | 0.301 | 18 | Madagascar | 0.307 | 24 | Madagascar | 0.672 | 17 | Madagascar | 0.744 | 12 |
| Mali | 0.643 | 11 | Mali | 0.271 | 23 | Mali | 0.348 | 21 | Mali | 0.675 | 12 | Mali | 0.703 | 29 |
| Mozambique | 0.679 | 5 | Mozambique | 0.478 | 7 | Mozambique | 0.449 | 8 | Mozambique | 0.669 | 24 | Mozambique | 0.741 | 14 |
| Mauritius | 0.318 | 31 | Mauritius | 0.141 | 35 | Mauritius | 0.136 | 36 | Mauritius | 0.666 | 29 | Mauritius | 0.662 | 30 |
| Malawi | 0.608 | 16 | Malawi | 0.69 | 3 | Malawi | 0.546 | 1 | Malawi | 0.667 | 26 | Malawi | 0.745 | 10 |
| Namibia | 0.677 | 7 | Namibia | 0.35 | 12 | Namibia | 0.426 | 11 | Namibia | 0.684 | 3 | Namibia | 0.728 | 23 |
| Niger | 0.581 | 19 | Niger | 0.386 | 11 | Niger | 0.393 | 17 | Niger | 0.671 | 18 | Niger | 0.733 | 21 |
| Nigeria | 0.315 | 32 | Nigeria | 0.265 | 25 | Nigeria | 0.125 | 37 | Nigeria | 0.669 | 23 | Nigeria | 0.71 | 27 |
| Rwanda | 0.624 | 14 | Rwanda | 0.435 | 10 | Rwanda | 0.473 | 5 | Rwanda | 0.66 | 36 | Rwanda | 0.746 | 8 |
| Senegal | 0.715 | 2 | Senegal | 0.303 | 17 | Senegal | 0.36 | 20 | Senegal | 0.675 | 13 | Senegal | 0.742 | 13 |
| Sierra Leone | 0.463 | 28 | Sierra Leone | 0.26 | 26 | Sierra Leone | 0.42 | 13 | Sierra Leone | 0.664 | 30 | Sierra Leone | 0.737 | 19 |
| Sao Tome and Principe | NA | NA | Sao Tome and Principe | NA | NA | Sao Tome and Principe | NA | NA | Sao Tome and Principe | NA | NA | Sao Tome and Principe | NA | NA |
| Swaziland | 0.646 | 10 | Swaziland | 0.212 | 28 | Swaziland | 0.305 | 25 | Swaziland | 0.673 | 16 | Swaziland | 0.712 | 26 |
| Seychelles | 0.749 | 1 | Seychelles | 0.304 | 16 | Seychelles | 0.298 | 27 | Seychelles | 0.677 | 8 | Seychelles | 0.756 | 1 |
| Chad | NA | NA | Chad | 0.141 | 36 | Chad | 0.362 | 19 | Chad | 0.67 | 20 | Chad | NA | NA |
| Togo | NA | NA | Togo | 0.504 | 6 | Togo | 0.452 | 7 | Togo | 0.676 | 11 | Togo | 0.745 | 9 |
| Tanzania | 0.553 | 23 | Tanzania | 0.323 | 15 | Tanzania | 0.423 | 12 | Tanzania | 0.662 | 35 | Tanzania | 0.744 | 11 |
| Uganda | 0.581 | 20 | Uganda | 0.19 | 30 | Uganda | 0.213 | 29 | Uganda | 0.674 | 14 | Uganda | 0.748 | 4 |
| South Africa | 0.532 | 24 | South Africa | 0.456 | 9 | South Africa | 0.394 | 15 | South Africa | 0.662 | 34 | South Africa | 0.749 | 3 |
| Zambia | 0.627 | 13 | Zambia | 0.46 | 8 | Zambia | 0.48 | 4 | Zambia | 0.657 | 38 | Zambia | 0.75 | 2 |
| Zimbabwe | NA | NA | Zimbabwe | NA | NA | Zimbabwe | NA | NA | Zimbabwe | NA | NA | Zimbabwe | NA | NA |
NA, not available.
The tax effort is heterogeneous according to the type of tax. In particular, Benin appears relatively better ranked in terms of VAT (rank 4) and corporate income tax (rank 13) than in terms of trade tax (rank 28), excise (rank 15), and personal income tax (rank 14). The tax effort for VAT is 0.686 and on trade tax 0.666, and only 0.344 and 0.396 on average for corporate income tax and personal income tax. The ranking in terms of Togo’s performance is more homogeneous, but the values of the tax effort vary according to the type of tax: from 0.676 for trade tax to 0.504 for corporate income tax and only 0.452 for personal income tax. These results tend to corroborate those of Cui et al. (Reference Cui, Sola and Dieterich2016), which show an under-performance in terms of income tax relative to the performance in terms of trade tax in Benin.
III The Determinants of Tax Effort: A Logistic Regression Analysis
Using a logistic regression, we now study the effect of some variables – natural resources, aid, institutional quality, political regime, and political stability – on tax effort.
As a first step of the analysis we present some general descriptive statistics. We can observe that non-resource-rich countries and non-fuel exporters have higher tax effort scores than their resource-rich peers. This may support the view that governments in resource-rich countries have less incentive to mobilise tax revenues when they have resource rent. Similarly, landlocked countries make a more intense tax effort and countries that are considered as offshore financial centres have low performance in terms of tax effort. East African Community (EAC) and WAEMU member countries appear to have better performance than Communauté Economique et Monétaire d’Afrique Centrale (CEMAC) and South African Community (SAC) countries. If we look at the evolution of tax effort in the WAEMU and CEMAC countries, it appears that WAEMU countries are on average better performing, which lends some support to the arguments in favour of regional harmonisation (of both customs and domestic tax policies).
Benin has little room to increase tax revenues unless it addresses the reasons why it is below weak taxable capacity by conducting institutional reforms to expand its tax revenue potential. Using the International Country Risk Guide (ICRG) database and following Frankel et al. (Reference Frankel, Vegh and Vuletin2013), we compute an index of institutional quality based on an average of four normalised variables: investment profile, corruption, law and order, and bureaucratic quality. Higher values of the index are associated with better economic and political institutions that should favour tax revenue collection.
In order to study rigorously the determinants of tax effort, we carry out an econometric analysis to complement the previous statistical analysis. Based on an international comparison, we examine the effect of some variables on tax effort scores. Our focus here is on the effect of natural resources, official development assistance (ODA), transparency, corruption and accountability (CPIA indicator), and the political regime and stability.
The analysis of the factors explaining the level of tax effort is based on a logistic regression. Tax effort scores range from 0 to 1, the most efficient countries having the highest scores. The ranking is grouped in quartiles according to the score obtained: we have four classes, from Q1 to Q4. Thus, the observations with the lowest scores belong to the first quartile, while the observations with the highest scores are in the fourth quartile. These quartiles are considered as the dependent variable. Using quartiles allows us to estimate the effects associated with each group of countries.
As the dependent variable is thus an ordinal variable, we use a mixed-effects ordered logistic model (see Liu and Hedeker, Reference Liu and Hedeker2006; Rabe-Hesketh and Skrondal, Reference Rabe-Hesketh and Skrondal2012). This model is an ordered logistic regression containing both fixed and random effects. The identification strategy makes it possible to control for the characteristics of countries that can affect the evolution of efficiency over time. We use a two-tier model. For M countries, the cumulative probability that a Yit observation belongs to an efficiency quartile greater than q is given by:

with Xit a set of covariates,  a set of cut points,Footnote 9 and ui a set of random effects (i=1,…,M country, each i has a given number of occurrences in time t=1,…,n occurrences). H() is the cumulative logistic distribution function that represents the cumulative probability. The Xit vector of dimension 1*p represents covariates for fixed effects with β coefficients. The 1*q vectors of Zit are covariates corresponding to random effects and can be used to represent intercepts and random coefficients.
While the estimation of tax effort scores requires focusing on structural supply variables, we now consider the potential effect of demand factors on the estimated level of tax effort: natural resource rent, aid, institutional quality (transparency, corruption, and accountability), political regime, and political stability.
The effect of natural resource rent on tax revenue ratio is widely evidenced in the literature. Natural resource endowment is associated with lower non-resource tax revenue, suggesting a natural resource curse (Sachs and Warner, Reference Sachs and Warner2001; Eltony, Reference Eltony2002; Melou et al., Reference Melou, Belinga, Paul and Nganou2017). In particular, during commodity price upswings, governments in resource-rich countries have less incentive to mobilise tax revenues so that resource rent crowds out tax revenue. We consider in our model total natural resource rents (percentage of GDP) as the sum of oil rents, natural gas rents, coal rents (hard and soft), mineral rents, and forest rents.Footnote 10
ODA can also modify government behaviour (Bahl, Reference Bahl2000; Bird and Smart, Reference Bird and Smart2002). The literature highlights several effects. Among the most documented, the flypaper effect is an empirical regularity: any increase in transfers/aid leads to greater public spending than an equivalent rise in the private revenue of the population (Hines and Thaler, Reference Hines and Thaler1995). In a context of informational asymmetries, aid challenges the fiscal discipline of recipient governments by raising a moral hazard problem (Pisauro, Reference Pisauro2001; Kornai et al., Reference Kornai, Maskin and Roland2003): it can be perceived as a kind of windfall resource, which crowds out own-source revenue by reducing the willingness of governments to improve their tax effort. More broadly, aid dependency seems to erode governments’ accountability, a prerequisite for the quality of public expenditure and taxpayers’ voluntary compliance. Hence, we consider in our model ‘Net ODA’ (from the World Bank). This consists of ‘disbursements of loans made on concessional terms (net of repayments of principal) and grants by official agencies of the members of the Development Assistance Committee (DAC), by multilateral institutions, and by non-DAC countries to promote economic development and welfare in countries and territories in the DAC list of ODA recipients’.Footnote 11
Institutional quality may also play a key role in mobilising resources. Indeed, it can improve tax policies and administrations’ ability to collect revenues, as well as taxpayers’ voluntary compliance. In particular, the degree of transparency, accountability, and corruption in the public sector determines the extent to which citizens can hold the executive accountable for its use of funds, and for the results of its decisions and actions. It also determines the extent to which public employees within the executive are required to account for administrative decisions, use of resources, and the final results obtained. Using the ‘CPIA transparency, accountability, and corruption in the public sector rating’ variable makes it possible to account for these potential effects. The three main dimensions assessed in that indicator are ‘the accountability of the executive to oversight institutions and of public employees for their performance, access of civil society to information on public affairs, and state capture by narrow vested interests’ (World Bank, 2009, p. 301).
Beyond the institutional aspects, the political regime in place may explain the level of tax effort. A growing body of literature suggests that political regime type matters in determining taxation. Garcia and Von Haldenwang (Reference Garcia and Von Haldenwang2016) identify three different causal mechanisms that affect the relation between regime type and taxation: economic growth, redistribution, and legitimacy. First, based on a positive link between democratic rule and economic growth, democracy should lead to higher tax collection because of growing taxable income. Second, based on the median voter theorem (Milanovic, Reference Milanovic2000; Acemoglu and Robinson, Reference Acemoglu and Robinson2006), the expansion of suffrage induced by democracy should lead to higher levels of redistribution and more public services, which may impact the level of taxation. Third, tax contractualism emphasises the importance of legitimacy and credibility in bargaining processes and tax compliance (Moore, Reference Moore, Brautigam, Fjeldstad and Moore2008; Timmons, Reference Timmons2005; Levi and Sacks, Reference Levi and Sacks2007; Bates and Lien, Reference Bates and Lien1985; Mahdavi, Reference Mahdavi2008). In this context, democracy should lead to higher tax collection, as taxpayers can be more confident that fiscal resources are spent for the common good and that the distribution of the tax burden is fair. Empirical research on the relationship of political regimes to taxation yields mixed results and it appears that there is no linear trend in favour of democracy. To test for these potential effects, we use a modified version of the ‘Polity’ variable proposed by the Center for Systemic Peace that allows the use of a regime measure in time-series analyses. This variable captures the political regime authority spectrum on a 21-point scale ranging from −10 (hereditary monarchy) to +10 (consolidated democracy).Footnote 12
Tax effort may also be influenced by political instability. An important literature shows that political stability determines the level of taxation (Cukierman et al., Reference Cukierman, Edwards and Tabellini1992; Aizenmana and Jinjarak, Reference Aizenmana and Jinjarak2008; Melo, Reference Melo2011). A rise in the level of political instability generates a decrease in the resources available and public expenditure in the next period. Moreover, the risk of radical policy changes in the future can have a detrimental effect on the tax behaviour of governments and on tax compliance. We include in the empirical analysis a variable from the World Bank that measures ‘perceptions of the likelihood of political instability and/or politically-motivated violence, including terrorism. The estimate gives the country’s score on the aggregate indicator, in units of a standard normal distribution, i.e. ranging from −2.5 to 2.5’.Footnote 13
Table 6.6 presents the results of the regression of the logistic model. We regress successively each of the interest variables (columns 1 to 5) and then all these variables at the same time (column 6). Aid is associated with a lower probability of belonging to a quartile of high tax effort, while institutional quality (measured by the CPIA index) increases the probability of belonging to an efficient quartile in terms of tax effort. If the effect of the political system is not clear, political stability is strongly and positively associated with a greater likelihood of having a high tax burden. When the model is regressed across all variables, the effects of aid, institutional quality, and the political system appear to be significant.
Table 6.6 Logistic regression results
| Quartiles of tax effort | (I) | (II) | (III) | (IV) | (V) | (VI) |
|---|---|---|---|---|---|---|
| ODA | −0.001*** (0.000) | −0.001* (0.000) | ||||
| Natural resource rent | 0.048 (0.017) | −0.003 (0.032) | ||||
| CPIA | 1.626*** (0.203) | 1.030* (0.770) | ||||
| Political regime | −0.027 (0.022) | −0.060** (0.026) | ||||
| Political Stability | 0.617*** (0.160) | −0.207 (0.386) | ||||
| Cut 1 | −2.351*** (0.305) | −1.501*** (0.263) | 0.418 (0.966) | −1.891*** (0.489) | −1.833*** (0.258) | 1.549 (2.596) |
| Cut 2 | −0.554 (0.296) | 0.176 (0.258) | 2.316** (0.972) | −0.064 (0.481) | −0.106 (0.251) | 3.696 (2.613) |
| Cut 3 | 0.567* (0.299) | 1.286*** (0.262) | 3.769*** (0.981) | 0.821* (0.484) | 1.093*** (0.255) | 5.222** (2.620) |
| Var (Const) | 1.475* (1.097) | 1.474*** (0.203) | 1.454*** (0260) | 1.465*** (0.345) | 1.453*** (0.212) | 1.515** (0.842) |
| Observations | 851 | 845 | 684 | 288 | 864 | 216 |
| Number of groups | 24 | 24 | 19 | 8 | 24 | 6 |
| Log-likelihood | −779.05 | −795.29 | −662.16 | −261.35 | −801.82 | −223.43 |
* Coefficient significant at 10% level.
IV Tax Policy or Revenue Administration Reforms
In this section, we review some tax policy and tax administrative issues in Benin, and suggest some reforms to improve tax mobilisation.
A Tax Policy and Tax Expenditures
The Beninese government sets the tax policy under the control of the legislative authority and following the WAEMU tax Regulation (Règlement in French), Directives, or Decisions.Footnote 14 WAEMU tax Directives define the rates and bases of the main taxes: VAT, corporate income tax, excises, portfolio incomes, and so on. Therefore, WAEMU member countries share a similar set of tax laws, which are encompassed in their respective national tax codes. However, tax effort analysis highlights the leading role of Senegal, which belongs to WAEMU too. Senegal displays a tax effort above 70 per cent, meaning a tax gap of less than 30 per cent of potential tax revenue over the most recent period (2015).
A potential explanation of this discrepancy between Benin and Senegal (or Togo) is a derogatory tax regime, such as the Investment Code (IC). Indeed, all the WAEMU countries, like almost developing countries, provide some tax incentives through their IC (or Act). Such a policy, sometimes suggested by the World Bank, aims to attract foreign direct investment. The main issue is in the details of these incentive schemes, which may also reflect the effects of lobbying.
The comparison of the Beninese IC, enacted in 1990 and modified in 1998 and 2008, with the Togolese one (in force since 2012) yields the conclusion of a greater generosity towards investors in Benin. Indeed, the Beninese IC offers a complete corporate income tax exemption over a period from five to nine years (even fifteen years if the investment is located in remote areas). Moreover, tax advantages and their duration increase with the investment amount. Meanwhile, the Togolese IC does not provide such a corporate income tax break, but only a 50 per cent rebate on corporate income tax owed. Moreover, this advantage is limited to five years and does not apply to some sectors, such as mobile phone companies, banks, insurance companies, retailers, or firms in charge of seaport and airport infrastructure. Another noticeable difference between the Beninese IC and the Togolese one concerns the importation of second-hand materials necessary for projects: Togo raises a unique 5 per cent tax for VAT and duty purposes, while Benin provides a complete exemption.
If the efficiency of such incentives in attracting foreign direct investment remains uncertain (see Van Parys and James, Reference Van Parys and James2010), tax revenue losses captured through tax expenditure assessment are more obvious.Footnote 15 Consequently, despite similar tax laws between Benin and Togo, tax expenditures such as these provided in ICs may differ significantly, partly explaining the gap in tax effort between these two countries. Yearly tax expenditure assessments and publications contained in the appendices to finance laws, in accordance with the 2015 WAEMU Decision, would contribute to streamlining these incentives, and improving the tax effort by reducing the policy gap.
B Tariff Policy and Informal Trade with Nigeria
Beyond tax policy, an important component for Benin is the tariff policy, which is determined by the WAEMU Commission and, officially since 2015, by the Economic Community of West African States (ECOWAS) Commission. ECOWAS is a customs union with fifteen members.Footnote 16 The ECOWAS Common External Tariff implementation is still ongoing, but it will impact Benin’s tax revenue, given the weight of the transit activity in this country. Tax revenue collected at the border represented almost half of total tax revenue in 2015: 4.41 per cent of GDP for trade taxes and 2.64 per cent of GDP for VAT collected at the border.
A large part of Beninese imports is not for the domestic market, but for the Nigerian one, and for landlocked countries (Burkina Faso, Mali, and Niger). Indeed, Nigeria has developed a protectionist trade policy by banning the importation of some goods (e.g. poultry meat, beer, used clothes, tyres, used cars, etc.) or raising high tariff rates on some other goods (e.g. 50 per cent on rice or sugar). This trade policy fuels smuggling activity in Benin and Togo. The former manages to extract significant tax revenue from this activity, which is estimated at 14 per cent of total tax revenue, or equivalent to 2.4 per cent of GDP in 2008 (see Golub, Reference Golub2012; IMF, 2012). Despite a geographical advantage for Benin given the common border with Nigeria, there is competition between Benin and Togo to attract this illegal transit activity. This competition may seriously limit efforts to improve domestic revenue mobilisation, at least at the border. For instance, despite or because of the WAEMU Common External Tariff in place in Benin and Togo since 2000, competition takes place on the reported value of imported goods for the Nigerian market. Such competition does not respect the World Trade Organization transaction value principle. Hence, special attention should be given to tariff policy in Benin, taking into account the existence of the informal trade with Nigeria.
C Administration Capacity
Tax effort is closely related to the tax and customs administration capacity. Benin still has a ‘classic’ organisation of these administrations, while Togo implemented a SARA in 2014. While it may be too early to assess the efficiency of such a reform in this particular case, Ebeke et al. (2015) found a significant positive impact of SARA on domestic revenue mobilisation: an increase by 4 percentage points of GDP. A natural question, then, would be whether Benin should switch to a revenue agency.
First implemented in Africa by Ghana in 1985, the SARA is a drastic reform, which can be understood as a strategic delegation of taxation power to an autonomous agent. The autonomy, which differs significantly across countries, is a signal of a more credible audit policy, since control occurs, at least theoretically, without any political interference. Two main advantages of SARAs are advanced in the literature. First, SARAs involve the merger of tax and customs administrations in order to (1) exploit synergies, in particular for VAT on imports (Keen, Reference Keen2008); and (2) save costs by combining operational functions in tax collections (World Bank, 2010). The second advantage is human resource management. Recruitment, promotion, and dismissal do not have to respect civil service rules, allowing a number of flexibilities, such as higher wages (Fjeldstadt and Moore, 2009; Moore, Reference Moore2014). Table 6.7 shows preliminary evidence of a positive correlation between public-sector wages and salariesFootnote 17 and estimated tax effort.
Table 6.7 Correlation between civil service wage bill and tax effort
| [1] | [2] | [3] | [4] | |
|---|---|---|---|---|
| Payroll [1] | 1.0000 | |||
| Total tax effort [2] | 0.1766* | 1.0000 | ||
| Time-varying tax effort [3] | 0.1473* | 0.9697* | 1.0000 | |
| Persistent tax effort [4] | 0.1423* | 0.3395* | 0.1017 | 1.0000 |
Switching to a SARA is a radical reform and the transition may be costly and risky, as it involves the replacement of a significant share of the staff. Alternative reforms may focus on the payment and incentive mechanisms in place in the Beninese tax and customs administrations. In 2016, the Beninese tax administration numbered less than 500 staffFootnote 18 (there are more than 1,500 in Togo and there are 1,200 in Senegal). These staff receive several premiums in addition to their wage: prime de rendement, prime d’incitation, prime d’impulsion, and potentially a risk premium. A large part of these premiums remains collective, reducing their incentive dimension. Several empirical studies have highlighted the advantage of reviewing such incentives. For instance, Khan et al. (Reference Khan, Khwaja and Olken2016) show that a reward scheme based on collected revenue significantly improved property tax revenue in Pakistan. However, they emphasise also that the revenue gain resulted from a small number of properties, the values of which were reassessed, and that a risk of higher bribes emerged with the increase in collectors’ bargaining power because of this new incentive mechanism. Thus, the introduction of individual performance contracts may be necessary, but is not sufficient to reduce the risk of corruption. As with a SARA, this mechanism should be complemented by extensive and effective monitoring (see Fjeldstad, Reference Fjeldstad2002).
In 2017, Benin carried out a reform of its tax administration through a significant reorganisation,Footnote 19 which follows the segmentation approach of taxpayer population. It introduced a risk analysis for its audit policy and human management based on results. The details of this reform are unknown and the previously described incentive mechanisms seem to remain.
The 2017 tax administration reform also established a tax policy unit. This unit is in charge of defining the tax policy, forecasting expected tax revenue and the effect of tax reforms, and assessing tax expenditure. If the creation of a tax policy unit is an improvement in designing the Beninese tax system, the location of this unit inside the tax administration itself may seriously limit the efficiency of such a reform. First, it reflects a common inconsistency in French-speaking countries, and even in France, in which the tax administration not only collects taxes, but also designs the tax policy. Moreover, given the role of the tax policy unit in forecasting tax revenue, the tax administration seems to have complete control over the goals to be achieved in terms of tax revenue, and the bonuses to be distributed to its staff. Second, customs remains an important tax collector and should be included in any tax reform and tax expenditure assessment. A natural location of the tax policy unit would have been ‘above’ both revenue administrations, headed by the special tax adviser of the Ministry of Finance. There is a need to clarify the role of each stakeholder: the revenue authorities, which collect taxes, and the Ministry of Finance, which designs the tax policy, with parliamentary control.
V Conclusion
Based on a large database covering forty-one SSA countries and the period 1980–2015, we analysed the effort by Benin to raise non-resource tax revenue in light of its structural characteristics. The stochastic frontier analysis, by comparing the non-resource tax-to-GDP ratio in Benin with its peers, identified whether Benin was away from the tax frontier: the tax effort in Benin remained relatively stable during the period, with an average of 65.1 per cent over the period and a rank of thirteen out of forty-two countries. A tax effort of 65.1 per cent means that the level of non-resource tax revenue is at 34.9 per cent of the country’s maximum capacity. Knowing that, on average, Benin collects 11.14 per cent of its GDP in non-resource tax revenue and is at 65.1 per cent of its capacity, it would have raised 17.11 per cent of its GDP as non-resource tax revenue if it had used all its potential, given its characteristics. Hence, Benin has little room – insufficient to reach the WAEMU criterion of 20 per cent of tax revenue to GDP – to increase tax revenues, unless it addresses the reasons for the weak taxable capacity and conducts institutional reforms to expand its tax revenue potential.
In order to study rigorously the determinants of tax effort, an econometric analysis then complemented the previous statistical analysis. Based on an international comparison, we examined the effect of natural resources, ODA, transparency, corruption and accountability (CPIA indicator), and the political regime and stability on tax effort scores. We found that aid is associated with a lower probability of belonging to a quartile of high tax effort, while institutional quality (measured by the CPIA index) seems to increase the probability of belonging to an efficient quartile in terms of tax effort. Political stability appears to be strongly and positively associated with a greater likelihood of having a high tax burden.
Analysing potential policy and administrative sources of these tax gaps, we shed light on the human resource policy of the tax administration and the remuneration mechanisms, which may be obsolete. The payment and incentive mechanisms in place in Beninese tax and customs administrations should be reviewed and associated with extensive and effective monitoring to improve tax effort and limit the risks of corruption. The 2017 tax administration reform may improve tax revenue through a more efficient organisation of departments and divisions. However, it also raises a critical issue of providing the decision-making power in tax policy to the tax administration through the creation of a tax policy unit.
The chapter by Emilie Caldeira and Grégoire Rota-Graziosi presents the tax collection situation in Benin in comparison with the performance of tax collection in Togo. The text is clear and easy to read. However, there are some observations to make:
The theoretical question is whether the increase in the tax burden is an end in itself. Is a lower tax burden not an incentive to invest? The question needs to be asked. The USA has a lower tax burden than Denmark, but it has a per capita income and higher productivity. The tax burden should not be viewed as an absolute goal.
In practical terms, the study would be more useful for both Benin and Togo if it indicated the causal relationship between the various indicators cited and the difference in tax collection rates between the two countries. The study cites as possible causes corruption, motivation of staff, the merger of the tax and customs administrations, the status of the staff (contract or civil servant), and so on. If the Government of Benin seeks to use this document to correct its tax policy, it will not know what lever to act on to improve the tax return.
The bibliography contains no items by authors from the countries concerned and more generally from French-speaking West African countries. The only bibliographical references are to authors from/writing about English-speaking countries in Africa.
I Overall Point of View
The study chooses the institutional perspective as an angle of analysis regarding the issue of brakes on and adjuvants to growth for development in Benin. In this regard, we can advance ideas that complete the comparison between Benin and Togo, especially on the tax issue. Togo has created a revenue office and this has improved tax revenues. The Togolese scheme, which is similar to those in place in Rwanda and Burundi, addresses a major obstacle in Benin: the power of the trade unions in the finance sector (customs and taxes). The government has reduced by law number 2017–05 of 29 August 2017 the rights of workers by limiting to ten days per year the annual statutory period of walkout. The unions are therefore reduced to grumbling without a real threat capacity as regards the continuity of public services. However, there is reason to fear a similar manoeuvre to that adopted by Burkina Faso trade unionists in the finance sector, which led to the departure of their minister of guardianship and a ministerial reshuffle after a work-to-rule strike (presence at the office but not actually working through the entire period), in February 2019. For its part, the Government of Benin has shown no intention of going in the direction of a revenue agency. On the other hand, it has strongly oriented its administrative policy towards the creation of agencies in all sectors. In general, the agency as a management institution appeared in the course of the reforms undertaken with the advent of new public management in the 1980s. The goal is to apply the managerial methods of the private sector to allow public administrations to become more competitive while guaranteeing a quality public service. Countries like Sweden, the UK, New Zealand, Japan, Canada, and many others have followed this path. An agency makes it possible to combine the advantages of a public administration (regulatory power, power of constraint, general interest) with the managerial flexibility enjoyed by private individuals: a merit pay system, recruitment according to need, simplified dismissal, ease of appreciating individual and collective performance.
In the space of three years of government, the new President of the Republic, elected in 2016, has created about fifty agencies. In the particular field of taxes, the National Agency of Domain and Land was created (by decree no. 2015–10 of 29 January 2015). This agency deals with cadaster issues and facilitates upstream collection of property tax.
The question of the modernisation of public administration goes back a very long time (as mentioned by Pisani, Reference Pisani1956). Today we speak more often of development administration, in the logic of what we could call the ‘government by corporations’. The dynamics of differentiation present the attraction of the flexibility of management rules, the ease with which managers are recruited, and the rules of public accounting. Development administration resembles a management administration in the durability of its existence and its power of constraint. On the other hand, it is closer to mission administration in the resulting requirements and its management flexibility. Development administration is more concerned with performance. The question of the performance of administrations is evident in the massive ‘agencification’ underway in Benin, which is the beginning of a solution to the problem of administrative institutions and their impediment to growth in Benin. By multiplying agencies in Benin, the government provides solutions to two types of problems:
First of all, the large numbers in general administration with profiles that often do not correspond to job positions. Public administration is often a refuge for incompetent people who cannot find jobs in the private sector. Very often, offices are cluttered with staff who work little because there are five or ten in a position that only one person can occupy with adequate working means. This overpopulation of the public administration goes hand in hand with insufficient staffing for certain managerial or high-tech positions. We are thus witnessing a contradictory phenomenon where on the one hand some people get bored at work, and on the other hand other agents are on the verge of burnout.
The question of motivation of the staff could also be regulated by the ‘agencification’. Indeed, public officials receive premiums and are subject to a promotion system that is usually based on seniority and not on the quality of work. This is the standard contained in the General Code of the Civil Service (Law No. 2015–18 of 2 April 2015 on the General Statute of the Civil Service). In an agency, staff should be periodically evaluated on their professional performance, results achieved, innovations made, and quality of work done (attendance, relations with colleagues, etc.). This evaluation of the agent could be sanctioned by bonuses, promotions, and many other things. Poor performance should lead to punishments, downgrades, and even dismissal if necessary. The agent in an agency knows that he or she is recruited because of his or her skills and abilities, and not because of his or her relationships.
Then comes the question of recruitment and dismissal: officials are guaranteed employment and can only be dismissed from their job in extreme circumstances. They are safe from economic redundancy and even if a nurse receives only two patients in the day for his or her village infirmary, this work is enough to guarantee the salary at the end of the month. The notion of return has no place in public administration. Officials obey the rules of the public service of the state. Labour productivity is not evaluated, and neither is yield. The agency offers the possibility to its leaders to leave the administrative framework of the civil service. Recruitment is carried out on the basis of a need for staff. The employment contract that binds the agent to his or her agency will be able to continue on two conditions: first, whether the agent fulfils his or her professional obligations correctly. He or she does what he or she must do on time and perfectly, under the appreciation of his or her managers. Then, the overall performance of the agency will justify the maintenance of the agency or not. An agency that is not performing can be dissolved, merged with another, or its team renewed entirely to give it a new lease of life. The fate of an agency is not very different to that of a private company, and nor is its management.
Finally, there is the question of remuneration: civil servants are considered to be poorly paid and are not motivated at all to do quality work. It is popularly believed that the state pretends to pay officials and officials in turn pretend to work. The management of an agency makes it possible to combine an optimum workforce, satisfactory remuneration, and good motivation of the agents. It is total quality management.
II Agencification of the Revenue Services in Question
In the African countries that have adopted this approach (Togo, Rwanda, Kenya, etc.), the agencification of the services responsible for collecting taxes (domestic taxation and door taxation) has had consequences for:
The motivation of staff.
A synergy effect that favours revenue optimisation.
The system of corruption.
Benin has not chosen this solution of agencification. The option is to be able to push on other levers to achieve the same results regarding staff motivation and the system of corruption.
The promotion of results-based management: The African Center for Training and Administrative Research for Development pleaded in 2010 for accountability and transparency in tax administrations. These are values promoted by governments in general government. The African Union has adopted the Public Service Charter (2001) to highlight the concepts of productivity, objectives, and evaluation. For its part, the General Tax Directorate of Benin has started to apply a results-based management system: defining objectives, issuing mission letters, evaluating performance, and implementing positive and negative sanctions. The record of this policy is mixed, but the method may have a more convincing impact with the development of other managerial techniques, notably the dematerialisation of procedures.
The dematerialisation of procedures: This means that information technology is used to reduce contact between tax and customs agents and users. At the customs port of Cotonou, the importer does all of his or her own operations, without ever encountering a customs officer. Import documents are entered into the electronic platform and the amount of customs duty is generated automatically. Payment of tax and customs is made in a commercial bank. The number of the payment receipt is entered into the computer system, which immediately issues the notice with the right to remove the goods. However, customs posts at land borders are not yet equipped with this computer system. As for the Directorate General of Taxes, it has also started a system of dematerialisation of these procedures of calculation and payment of tax. The immediate consequence is the reduction of opportunities for contact between users and the tax administration. This should reduce the risk of corruption involving tax officials.
Saving time: Dematerialisation must also enable time savings in the execution of formalities with the tax authorities. According to the 2017 Paying Tax Report, it takes 908 hours (37 days) to fulfil tax obligations in Nigeria, 630 hours (26 days) in Cameroon, 124 hours (5 days) in Rwanda, and 82 hours (3.5 days) in Djibouti. Time management is related to the management of paperwork. It has a cost for the tax administration and generates additional costs for taxpayers. In South Africa, the use of electronic platforms has improved tax revenue mobilisation and reduced the cost of corporate tax compliance by 22.4 per cent.
III Conclusion
The Government of Benin is using the technique of agencification to modernise the public administration and to make it more efficient.Footnote 20
Curiously, the same government seems not to be moving towards agencification with respect to tax management. We understand that the decision is to achieve the same results that allows agencification using other managerial techniques: the promotion of results-based management, the dematerialisation of procedures, and the reduction of the time that taxpayers dedicate to their tax obligations.
I Introduction
This chapter analyses the recent land reform that was enacted by the 2013 Code Foncier et Domanial (Land and Domain Code) and its results at end 2018, five years after.Footnote 1 Its orientation is significantly different from the other chapters, both in its purpose and approach. It is not so much a question of highlighting desirable areas for reform as it is of analysing an ongoing reform. In particular, it deals with the political economy of the reform. It provides a detailed history of a complex and contradictory process, discussing the reform’s political and economic stakes, the groups of actors and interests that pushed it, those who are opposed to it, and those who seek to shape it for their own benefit.Footnote 2
A matter of ‘power, wealth, and meaning’ (Shipton and Goheen, Reference Shipton and Goheen1992), land is at the heart of societies and of the formation of the state: (1) the way of thinking and organising access and control of land and its resources reflects the conception of the society, its forms of authority, and the differentiations that structure it; (2) the distribution of rights over land and resources determines, in part, statutory and socio-economic inequalities; and (3) the capacity to define rules governing land rights, and to grant or validate them, is at the heart of political power and construction of the state (Boone, Reference Boone2014). Any land policy necessarily has power-related stakes (politics) and societal stakes (polity) (Léonard and Lavigne Delville, Reference Léonard, Lavigne Delville, Colin, Lavigne Delville and Léonard2022). Land reform processes are also linked to the interests of the different groups of economic and political actors, the weight of professional corporatism, the conflicts of societal projects, and the question related to the plurality of norms that run through the society (Lund, Reference Lund and Winter2001).
Since the middle of the 1980s the land issue in Africa has come back again onto the agenda of development policies, in a context of state crises, economic liberalisation, and increased conflicts in rural areas. Two major visions clash, both challenging the colonial and post-colonial state’s monopoly on land. The first one promotes the replacement of informal customary rights, considered as obstacles to productivity, by private ownership rights, supposed to be a condition for economic development. The other one, described as ‘adaptative’ (Bruce, Reference Bruce1992) or ‘pro-poor’ (Borras and Franco, Reference Borras and Franco2010; Zevenbergen et al., Reference Zevenbergen, Augustinus, Antonio and Bennett2013), acknowledges the dynamics of local/customary land rights and considers that they are not, as such, a constraint on productivity. Thus, the issue of land reforms is to build a favourable institutional environment that secures people’s rights and allows these rights to evolve peacefully.
Both paradigms emphasise the issue of the security of land rights, but with different assumptions regarding what ‘tenure security’ means. For the privatisation paradigm, it means private ownership rights recognised by the state and full capacity of transfer and sale. It is however a biased definition. Land tenure security means that one’s rights (of whatsoever kind) cannot be challenged without good reason, and that legitimate authorities (customary, state, or hybrid) are able to settle conflicts (Lavigne Delville, Reference Lavigne Delville2006).Footnote 3 Tenure security is above all an institutional issue: it requires rules and authorities able to design and enforce them; one can be in security with informal rights, which is the case in most customary contexts. While emphasising tenure security, the ‘adaptation’ paradigm also largely supports the formalisation of customary informal land rights in rural areas. However, according to this paradigm, formalisation has to adapt to the diversity of rights and to be implemented through progressive frameworks, and the development of innovative, adapted, inexpensive, and accessible approaches.
In French-speaking Africa, the debate on the legal recognition of property rights is strongly structured around land titles,Footnote 4 issued after ‘immatriculation’. Immatriculation is a land registration procedure that had been specifically designed for colonial areas (decrees of 1906 and 1932). In contrast to France, where the proof of ownership is the sale contract prepared by notaries, it is based on the granting by the state of a quasi-absolute private ownership, incontestable and guaranteed by the state, based on the purging of all pre-existing rights. Every plot that does not have a land title is subject to informal rights or ‘presumed ownership’ and is considered to be part of the state’s private domain. Immatriculation (hereafter referred to as standard titling or registration) allows for ‘the entry into legal life’ of land that previously had ‘informal’ status. However, it is a complex and costly procedure and colonial powers never tried to generalise it (Chauveau, Reference Chauveau, Lafay, Le Guennec-Coppens and Coulibaly2016). Historically, it has been at the service of colonial power and its allies, and not of the recognition of the rights of inhabitants, who were considered as subjects and not citizens (Mamdani, Reference Mamdani1996). It has been retained after independence and remains accessible only to a minority.
For the majority of West African land professionals and policy makers, the land title is the only conceivable form of legal property right and the aim of a reform is to unify land rights and to generalise private ownership and land titles. For some of them, and for most sociologists or anthropologists, standard titling is an obstacle to large-scale access to land rights formalisation, since its very logic – not to mention its cost – is contradictory to the aim of recognising the various existing land rights. In this conception, it is the law that has to adapt to society in order to overcome the colonial legacy.
The debate on agricultural productivity and on the relations between society and law is not only a technical one. It encompasses diverse conceptions of society, of relations between individuals, social collectives, and the state, of the place of market relations, of the role of law, and so on. It challenges people’s historical exclusion from access to the law. These various and intricate issues explain why, even though almost every West African country has launched attempts at land reform, the processes and outcomes, as well as the degree of implementation of adopted reforms, have been very different from one country to another (Seck et al., Reference Seck, Lavigne Delville, Richebourg, Vaumourin and Mansion2018).
The case of Benin is particularly interesting from this point of view because, within the space of a few years (from 2007 to 2013), Benin adopted two different contradictory land reforms. The first was led by the Ministry of Agriculture and supported by European donors. It focused on rural areas and promoted an alternative to standard registration and land titles, which the promoters considered fundamentally unsuitable for rural areas. It resulted in the 2007 Rural Land Law.Footnote 5 The second has a national focus. It was led by the Ministry of Urban PlanningFootnote 6 and the Millennium Challenge Account Benin (MCA-Benin).Footnote 7 It aims to standardise land law and develop access to private land titles by reforming the national land administration. It was embodied by adoption of the Land and Domain Code in 2013 (which abolished the 2007 law and was slightly revised in 2017), and the establishment in 2016 of the Agence Nationale du Domaine et du Foncier (ANDF, National Agency of Land and Domains).
The succession, within a few years, of two reforms based on different paradigms, carried out by different networks of actors, supported by different donors, and having experienced varying degrees of implementation, represents a textbook case for highlighting the intricate issues of land reform, and questioning the stakes and the actors’ interests around the reform’s framing and implementation. It also offers an opportunity to question the diverse conceptions of land tenure security and of land governance and the conditions for institutionalising a land reform.
In this chapter, I study the history of these two intricate land reforms, with a focus on the second one, which – at the end of 2018 – won the battle. I begin with a brief institutional analysis of the land sector in the early 2000s. Section II discusses the different, concurrent reform projects that took place during the 2000s. Section III details the vision and process of the second reform, with its dual focus on field registration projects and land law formulation. I then analyse the 2013 Land Code, its orientations and the controversies around it, and finally discuss the strengths and limitations of this reform, particularly in terms of citizens’ inclusion.
My analysis relies on a perspective of ‘socio-anthropology of public action in countries under aid regime’ (Lavigne Delville, Reference Lavigne Delville2016), which aims at studying through qualitative enquiries the way public policies are framed, negotiated, contested, and implemented in aid-dependent countries. In an ethnographic and constructivist approach, it studies the interplay of actors and conflicts of representation and interests throughout the policy process, taking into account the multiple disjunctions between its different stages. By empirically following networks of actors, ideas, and instruments, from the global to the local, this approach shows the intertwining of ideas, interests, and institutions (Hall, Reference Hall, Lichbach and Zuckerman1997), and the intricate issues of policy, politics, and polity. This analysis focuses on a reform that is still being implemented and ends with the National Workshop on Land organised in October 2018. The chapter therefore concerns an incompletely stabilised process, and in no way claims to evaluate it. Focusing on retracing the reform’s history, it offers primarily a retrospective look, and does not intend to take note of recent developments. However, some of them are presented in the Afterword.
II Competing Projects for Reforming Land Law and Administration (1990–2005)
A State Ownership, Informality, Semi-formal Arrangements and ‘Confusion Management’: A Brief Analysis of the Land Sector in the 1990s–2000s
From independence up to the 2007 Rural Land Law, land in Benin was governed by a legal framework resulting from the early years of independence (Gbaguidi, Reference Gbaguidi1997):
Law No. 65–25 of 14 August 1965 on land ownership in Dahomey,Footnote 8 which largely incorporates the colonial registration procedures defined by the 1932 decree.
Law No. 60–20 of 13 July 1960, established the system of ‘housing permits’ in Dahomey, which made it possible to grant ‘essentially personal, precarious and revocable’ rights to urban actors established on the private domain of the state.
Law No. 61–26 of 10 August 1961 defining and regulating rural development schemes (périmètres d’aménagement rural).
As in most French-speaking African countries, the colonial decrees of 1955 and 1956 were set aside by the new authorities. Enacted at the end of the colonial period, those decrees allowed ‘indigenous’ people to obtain legal recognition of their land rights. Rarely implemented, they have never formally been repealed before the 2013 Code, and were sources of inspiration for the 2007 rural land reform (Lavigne Delville and Gbaguidi, Reference Lavigne Delville and Gbaguidi2022).
Throughout this period (1960–1990), the widespread informality was not necessarily perceived as a policy problem in rural areas, where customary and semi-formal regulations continued to organise access to land and conflict arbitration. Land tenure insecurity was mostly found where the state was involved in development projects, and where the land market was developing, mainly in urban or peri-urban areas. This section describes the situation around 2000, when reform processes began. Since the reform is still partly implemented, it has not changed very much in most of the country.
Decentralisation policy in 1999 transformed the former districts into communes, giving them expanded powers on land and housing, and land became a central part of the local political economy (Aboudou et al., Reference Aboudou, Joecker and Nica2003).
1 Generalised Informality, Institutional Weaknesses and Semi-formal Arrangements
Around 2000, land tenure informality (or semi-formality) was largely dominant. Across the entire country only 1,980 titles were issued between 1906 and 1967 (Comby, Reference Comby1998b, pp. 11–12). Demands for land titles, mostly from urban well-off citizens, have risen since the 1990s, along with economic liberalisation and democratic transition. However, in 2004 there were only 14,606 land titles (MUHRFLEC, 2009) for a population of 6,769,914 inhabitants in 2002 (Zossoungbbo, Reference Zossoungbbo2016). Titles covered less than 20,000 ha or 0.17 per cent of the national territory. They concerned fewer than 15,000 households (1.23 per cent of the total number; République du Bénin, 2004). In 2007, only 5 per cent of urban residents and 0.8 per cent of rural residents had land titles (INSAE, 2009, p. 166), with high inequalities by wealth level: 4.4 per cent of the ‘richest’ had a land title, compared to 1.1 per cent of the ‘poorest’ (INSAE, 2009, p. 167). While the demand for titles increases, the pace is slow: ‘the proportion of parcels or land with a land title rose from 2.1% in 2006 to 3.4% in 2010 and 3.0% in 2011’ (INSAE, 2012, p. 53).
The responsibility for the management of both the state domain and private land titles is entrusted to the Direction des Domaines, de l’Enregistrement et du Timbre (DDET, the Directorate of Land Tenure, Registration and Seals), within the Ministry of Finance. DDET is a highly centralised body: it has only two offices, in Cotonou and Porto Novo, for the full country. Under-equipped, the land administration delivers few titles. Many files are incomplete or outdated. A survey done for a World Bank Project (Comby, Reference Comby1998b) states that many old titles are practically unreadable, due to poor storage conditions, and that some are even destroyed or missing. In the absence of a cadastral plan, the existence of a land title can only be known through a survey among neighbours. The plot maps drawn up by the surveyors are not connected to a general system of topographical markers, and the location of some titled plots is inaccurate. A new title can thus be issued on a plot of land that has already been titled in whole or in part (see Comby, Reference Comby1998b and Lavigne Delville, Reference Lavigne Delville, Bourguignon, Houssa, Platteau and Reding2019 for details).
The titling procedure is supposed to guarantee the reliability of the information. However, the number of steps in that procedure increases its costs and duration. This also increases the risk of the file becoming bogged down, and therefore the opportunities for personalised and clientelist, if not corruptive, processing of the files. Contradictory demarcation on the plot itself is supposed to ensure the legitimacy of the claimed rights. However, demarcation notices are to be published in the State Gazette, and posted in the Court of First Instance and in the subprefecture or town hall. They are rarely posted on the plot of land itself. Information on neighbours and possible local rights holders is fragmentary or non-existent. Applicants can thus obtain a title even with incomplete or sometimes illegal files and/or without the customary holders of the land in question being informed. The impossibility of contesting a title, which is supposed to protect the owner, serves in practice to ratify errors, fraud, and spoliation.
Applicants for titles are essentially wealthy urban actors, who are familiar with land administration and who want to secure their rights on the plots they have purchased, mainly in peri-urban areas. However, many executives – and even lawyers – acknowledge that they do not go through with the procedure: they start it in order to have a surveyor demarcate the plot on the field to discourage possible claims. Then they stop. The state itself rarely carries out registration procedures on its own land and the consistency of the state’s domain is unclear. The text defining the price for buying state land has not been updated since the 1960s, allowing actors familiar with the procedures to buy at low prices portions of the private domain of the state, which has been largely discounted over the years (Lassissi, Reference Lassissi2006).
The revolutionary regime (1974–1990) did not bring significant changes. It did not nationalise the land and forbid land sales. The 1977 Basic Law recognised and protected private property. This period saw the creation of numerous state farms on land expropriated from farmers, and the allocation of ‘uncultivated’ land to state companies and administrative services, with redistribution to clients and political allies (Le Meur, Reference Le Meur1995). The promotion of palm groves led to the creation of cooperatives where state agents could gain land. Until today those cooperatives remain sites of conflict between members of cooperatives and former customary owners. Furthermore, the official ban on owning more than one urban plot of land has multiplied bypass strategies, at the risk of subsequent conflicts during succession when some plots were put into the name of children (Andreetta, Reference Andreetta2019, p. 118).
Sitting beside the land law, or reinterpreting it, various procedures, most of them dating from the colonial period, have gradually constituted a ‘semi-formal system’ (André, Reference André, Lavigne Delville and Mathieu1999; Mathieu, Reference Mathieu and de Villers1996) of land regulation; that is, a set of procedures and documents not explicitly integrated into the legal framework but nevertheless implemented in a relatively stable way, by official authorities. This is the case for customary/unregistered land. For example, local authorities (formerly the district heads, now the mayors) issue administrative certificates – normally after a field survey but not always – to attest the ownership of a plot of untitled land. They also validate sales contracts on untitled land by signing and stamping them, with reference to the colonial 1906 decree on agreements between indigenous people. Local authorities also widely distribute housing permits, including outside land registered in the name of the state, which is illegal (Le Meur, Reference Le Meur2008).
In other countries, transactions on unregistered plots can be formalised through written contracts, handwritten or typed, which are officialised with the signature of an administrative or communal authority. This is much more institutionalised in Benin, despite some variations: municipalities print and sell specific forms with the commune stamp. Most land sales are officialised this way, against payment of a tax. However, this institutionalisation does not prevent all conflicts over sales, for several reasons. Field surveys are not always done before issuing administrative certificates. When signing a land sale contract, the mayor has no means to ensure that the seller is really the owner and has the right to sell. A ‘certificate of non-litigation’ (attestation de non litige) is requested from the village chief, but is not enough as the chief has no obligation to check the property rights on the plot and to alert in case of risk. Moreover, while numerous sales concern family land, the form has room only for an individual seller, and there is no obligation to have formal approval of the sale by the family rights holder before endorsing a sale. Archives are not properly managed. Communes have multiple responsibilities in terms of housing and planning, without having the tools and staff that would be necessary to carry on these responsibilities. Commune leaders are often engaged in land business, due to its political and financial issues.
Outside buyers cannot rely on their knowledge networks to check whether the person claiming to sell a plot of land is really the owner and whether the plot is a family property or not, and are not on site after the purchase to protect the plot against fraudulent sales. They are thus are particularly vulnerable to conflict and insecurity. Palm plantations in the Ouémé Valley, and more generally all land purchased in peri-urban areas, are thus equipped with cement pillars, and panels indicating the name and telephone number of the owner, in the hope of avoiding having the plot taken over by others.Footnote 9
While lack of staff plays a role,Footnote 10 the weaknesses of untitled land management by communes come first from the fact that the state has never structured and supervised it. In practice, the land law only deals with titled land and the process of immatriculation. Untitled land (customary land, but also plots in housing estates having housing permits) is left to these commune-level semi-formal procedures. However, at the same time, the state recognises them: administrative certificates and endorsed land sales contracts are part of the necessary documents for requesting a land title. By acknowledging them, and even more so by leaving citizens’ needs in terms of securing unregistered land without a political and institutional response, the state endorses these practices.
As access to a title is in practice impossible for most citizens, these procedures are the only way by which most interested citizens – mainly urban or peri-urban – can obtain official documents attesting to their land rights. They can be seen as ‘palliative solutions’ that attempt to provide practical responses to the problems encountered, given the shortcomings of public services. As stated by Olivier de Sardan (Reference Olivier de Sardan2014), those behaviours are ‘unofficial’, ‘out of step with what the texts provide’, ‘at the limit of legality’ (and sometimes even illegal), but they provide informal solutions to bottlenecks in public services.
2 Land Markets, Conflicts, and Insecurity: A High Regional Diversity
In 2007, 40 per cent of plots of land in urban areas, and 10–13 per cent in rural areas, have been purchased (INSAE, 2009, p. 165). However, only 5 per cent of individuals have a land title in urban areas and 0.8 per cent in rural areas (INSAE, 2009, p. 106). In 2011, 6.6 per cent of plots had a housing permit and 44.4 per cent had a sale agreement from the town hall. In Cotonou, 72.0 per cent of individuals who own a plot of land have a sale agreement from the commune and 7.5 per cent a land title (INSAE, 2012, p. 53). The proportion of loan amounts secured by a land title is very low (1 per cent at most; Steward International, 2010, p. ix).
Legal uncertainty is widespread, due to an absence of legal documents or to poorly managed land information. However, this does not impede land transactions. Land markets are absent in most rural areas, but they are common in urban and peri-urban contexts, as well as in countryside in the south.Footnote 11 Moreover, it does not always translate into real insecurity, or into a proven risk. Informality does not mean insecurity as long as land rights are not contested and legitimate authorities are able to solve conflicts. Insecurity and conflicts are concentrated in some areas, some configurations, and for the least powerful actors.
In the cities, a large part of the territory has been subdivided for housing, people’s rights on the plot they live on are quite stabilised by occupation, and the inhabitants frequently hold one or more documents: residence permits, sales agreements, and administrative certificates. Cases of conflicts or insecurity arise due to contradictory overlapping rights, or conflicts over inheritance or sales. Some houses in cities are marked ‘contentious, not to be sold’. Family rights holders may contest sales made without their consent, even a long time after the fact. Sellers’ heirs can even go to trial when they see that the value of land has dramatically increased and they can win in court. In some cases, buildings have to be destroyed because of a court decision, due to a conflict relating to a sale, but there are few reliable data on the number of such cases.
Conflicts frequently involve disputes over past sales, or inheritance disputes. Family houses are occupied by different family members and the eldest son often takes responsibility for them upon the father’s death, postponing the distribution among the heirs. He manages the income from the rented property for his benefit. The youngest, and especially women, are increasingly claiming their share of inheritance, based on the recent Family Code (2004), and are less hesitant to go to court, which has led to an increase in the number of such cases (Andreetta, Reference Andreetta2019).
In rural areas, land governance is largely by customary or neo-customaryFootnote 12 norms and by ‘traditional’ authorities, whose power varies greatly from one area to another, with the intervention of state agents and the territorial administration or municipal elected officials in the event of conflicts. Depending on the region, population density and land-use patterns, land tenure relationships are more or less individualised. The contrast is striking between the southern regions (Mongbo, Reference Mongbo, Longbottom and Toulmin2002) – densely populated, highly individualised, where an inter-farmer land market for purchase and sale has existed for a long time – and the rest of the country, where such a market is non-existent or almost non-existent. Urban buyers, with financial resources that are disproportionate to those of rural families, are one of the major factors in the commodification of land, in – sometimes even remote – peri-urban areas, along roads and in pioneering areas, where land is still available. Sales contracts are sometimes based on a mutual agreement, but can also rely on corruption, manipulation, or even force (Kapgen, Reference Kapgen2012).
Investing in land is indeed one of the preferred strategies of urban elites and the middle classes. This rush on land fuels acute land speculation, which is felt far inland. All those who can afford it buy plots of land on the periphery or in remote suburban areas according to the available opportunities and their financial means. ‘Land mafias’ expand around large cities, which bring together landowners’ lineages and ‘canvassers’, surveyors, and municipal or state agents. Multiple sales of the same plot of land, and contestation of former sales by rights holders (shortly after a sale made without their knowledge, or years or even a generation later when they discover that the plot’s value has increased significantly) are frequent, causing insecurity for buyers. Nevertheless, these buyers rush to take advantage of all opportunities, hoping to secure at least part of the plots they buy.
Numerous actors highlight the high prevalence of land conflicts. However, solid figures are rare. Existing surveys are often ambiguous in their definitions of conflicts.Footnote 13 In 2007, a survey shows that the proportion of plots that have been the subject to a dispute is 1.4 per cent in urban areas and 1.1 per cent in rural areas, which is considered ‘a low proportion’ (INSAE, 2009, pp. 169–70), but the difference in figures between 2006 and 2007 is astonishing. The percentage of conflicts is highest in the urban and peri-urban departments of the south of the country (around 4 per cent) and very low elsewhere (less than 1 per cent). Numerous communes in rural areas recorded no land conflicts in 2007.
Contestation of property rights (inheritance, land sales, land grabbing) is the most frequent source of conflict (33.9 per cent; INSAE, 2012, p. 122).Footnote 14 Plots of land with a written document are less prone to conflict, but the title does not provide much more of a guarantee than other documents. Land conflicts affected 3.4 per cent of plots with no administrative documents, against 2.7 per cent for plots with a non-formal sales agreement, 2.4 per cent with a sales agreement established by municipal authorities, 2.3 per cent with a residence permit, and 2.0 per cent of plots with a land title (INSAE, 2012, p. 121). Having a document reduces the risk of conflicts, but a land title does not provide complete security.
These data show clearly that conflicts are more frequent in urban and peri-urban contexts. There is no direct link between informality and conflict, and a land title is not much more secure than a sales agreement issued by a commune. Most conflicts are solved outside courts and at a lower cost. Only 12 per cent of property rights disputes are settled by the courts (INSAE, 2012, p. 130). Most of them are solved at family level (26 per cent), at commune level (25 per cent), and at village or subcommune level (24 per cent).
3 Institutional Bottlenecks before Reforms: Vested Interests in Confusion
We can summarise the situation at the end of the 1990s as in Table 7.1, proposed by the research project.
Table 7.1 Institutional bottlenecks
| Deep factors | Proximate causes | Identified weaknesses | Economic consequences |
|---|---|---|---|
| Plurality of social and land norms within society | Obsolete legal texts | Legal recognition of land rights inaccessible to the vast majority of the population | Importance of informality |
| Normative conception of the law, not seen as being in the service of the society | Unregulated legal duality between state law and neo-customary norms | Registration procedure that does not guarantee reliable publicity and protection of existing rights | Conflicts, especially in peri-urban areas |
| No affordable solution for ordinary people | |||
| Conception of ownership as ‘absolute’ and given by the state, ‘from the top’ | Centralised land tenure administration | Unorganised plurality of state and neo-customary bodies in land governance and conflict resolution | Spoliations, in particular in land subdivisions and plots of land purchases |
| Colonial legal framework, left in place without major change since independence | Expensive procedures for having a land title | Poor reliability of ‘semi-formal institutions’ | Transaction costs in land purchases |
| Multiple interests in ‘confusion management’ | Duplicate procedures and rent-seeking strategies by land administrations and professionals | Unsecured sales (for family rights holders and for buyers) | Cost of conflict for households and businesses |
| Rent-seeking financial system | Semi-formal palliative institutions | Little/no access to credit for rural producers, nor in the case of urgent need | Distress sales |
| Shortcomings in the supply of credit to rural people | No taxation on purchased land not valued | Unproductive or speculative | |
| Accumulation by elites |
Some forty years after independence, land governance is still based on the colonial duality between private titles for land and informal or semi-formal plots. Most of the country’s plots are governed following customary or semi-formal procedures at commune level. Instead of designing sound commune-level procedures to make them more reliable, and answer to the needs of the majority of citizens, government has allowed them to develop unchecked, leaving gaps for manipulation and power grabs. For Piermay (Reference Piermay1986, Reference Piermay, Frelin and Haubert1992), who studied urban land practices in central Africa, and Mathieu (Reference Mathieu and de Villers1996), who was interested in the rural situation in Sahelian Africa, the situation of informality and vagueness about the land rules does not result from chance. It is the product of a deliberate strategy of ‘managing confusion’ by political and administrative elites, who are well integrated into the political and administrative networks and able to take advantage of it.Footnote 15 The situation of Benin confirms this analysis. The obsolete nature of the texts, the vagueness of the rules, the institutional shortcomings, the complex procedures, the lack of resources for the administrations are greatly responsible for the current situation. These institutional deficiencies are partly the product of a lack of interest – and budgeting – on the part of the state. Constraints on human and financial resources in state administration bodies have been aggravated by structural adjustment.Footnote 16 However, their maintenance over time cannot be attributed solely to negligence and it is advantageous for certain parties. Informality in rural and peri-urban land allows urban dwellers to buy it at a cheap price; the lack of updating of the state property register and the obsolescence of the state land transfer scale clearly favour the grabbing of the state’s domain by actors who know the rules and have relations with land administration agents; land title registers are not maintained properly, which allows for manipulation.
Land subdivisions are a privileged place for land corruption (Aboudou et al., Reference Aboudou, Joecker and Nica2003; Kakai, Reference Kakai2014, pp. 16–18). Surveyors apply an exaggerated ‘reduction coefficient’ that allows them to illegally create new plots that they share with local elected officials. The heads of communal land services and elected officials are also involved in land speculation. The ministry for urbanism states that ‘some land canvassers maintain a land mafia which sometimes leads to the counterfeiting of Land acts with the complicity of the Land affairs services of the Mayor Office’ (MUHRFLEC, 2011b, p. 58). These deficiencies and the lack of resources open up many opportunities for negotiation, privatisation, and informal transactions, and even manipulation or corruption. As Bayart (Reference Bayart1993) explained thirty years ago, in Africa land and property ownership is the wealth par excellence and the main source of accumulation for national and local politicians, and state agents and the institutional shortcomings do not only result in losers.
B Adaptation versus Replacement: Competing Attempts at ReformFootnote 17
1 The Emergence of the Debate on Land Security in the 1990s
In Benin, the first seminar on housing and land tenure security, in 1984, is regularly quoted as the starting point for further reflection. But it was only around 1990 that the spoliations linked to a collapsing revolutionary regime, the land grabbing by the elite on the private domain of the state, and the abuses by state agents against the population led to the state’s land monopoly being called into question (Gbaguidi, Reference Gbaguidi1997). The context was one of economic liberalisation and democratic transition. Land rights’ informality and tenure insecurity started to be raised as a problem, in both urban (Comby, Reference Comby1998b) and rural areas (Hounkpodoté, Reference Hounkpodoté, Toulmin, Lavigne Delville and Traoré2002). In both contexts, the issue was to favour wide access to legal recognition and to prevent land conflicts. Several reform projects were raised in different ministries.
2 In Urban Areas, Tool for Commune-Level Land Taxation and Unsuccessful Discussions on Legal Reform
In the early 1990s, the French cooperation set up local land taxation tools, called Registres Fonciers Urbains (RFUs – urban land registers), in Cotonou and Parakou (Charles-Dominé, Reference Charles-Dominé2012). An RFU consists in a map of land occupations – regardless of their legal status – built from field surveys, allowing the issue of tax notices. The RFU allows a significant increase in tax resources, but remains incompletely mobilised by the municipalities, both because elected officials are reluctant to increase the pressure to pay taxes, and because of weak institutional anchoring in the municipalities’ administrative system (Simonneau, Reference Simonneau2015). RFUs have then been disseminated to other municipalities, by various donors, in various forms and with limited success (Simonneau, Reference Simonneau2015). While RFUs are primarily a fiscal tool, their designers thought they could help to register ownership: the presence on a plot for a sufficient period, as evidenced by the regular payment of property tax, could be considered after a given number of years as a proof of ownership, avoiding the complexity of immatriculation.
As part of the Urban Rehabilitation and Management Project (Projet de Gestion et de Réhabilitation Urbaine [PGRU], with World Bank financing), a series of studies conducted in the 1990s laid the groundwork for possible land reform. Comby (Reference Comby1998b) identified four possible strategies. The first was ‘an improvement of practices and reorganization of administrative means in compliance with existing law’. The second was ‘a policy of occasional improvements leading to a significant improvement’. The third built on the development of group registrations. The last strategy was based on deep modification of the conception of ownership and land rights legalisation: ‘in a more radical break with current legal and administrative practices, making ownership a matter to be settled between private persons. The State and its administrations no longer deal with the recognition and allocation of property. The peaceful owner of a piece of land is presumed to be the owner, with the burden of proof to any interested person to the contrary by taking legal action’ (Comby (Reference Comby1998b, p. 17). This would mean abandoning the colonial conception of state-guaranteed land ownership in favour of a contractual approach, like in the French Civil Code.
‘For many people’, according to Comby (Reference Comby1998b, p. 17), ‘all the current difficulties stem simply from a lack of respect for existing texts. They think that it is not the law that needs to be changed, but that it is the practices that must be brought into conformity with the law, all the evil coming from the fact that the law was no longer respected’. However, this expert supported the ‘bottom-up ownership’ perspective and thus an exit from the standard registration model. He explained that the scenario for implementing existing law was doubly unworkable: first, it would imply being able to prohibit sales of unregistered land, and then the cost and pace of issuing land titles are incompatible with a desire to address the problem on a significant scale.
Prepared by Beninese experts, the collection of legal texts compiled for the PGRU (SERHAU, 1999) timidly opens the question of alternatives to land titles, or in any case significant changes in procedures: ‘It may be necessary to study at the State level how to make it accessible to as many people as possible and if it must always be maintained as the mother of evidence of land ownership […]. There is a need to simplify the procedure along the lines of the procedure for establishing customary land rights […] and to restore the contract as an essential role in the acquisition of property’ (SERHAU, 1999, p. 350, emphasis added).
In practice, however, it is the first scenario that the Beninese authorities adopted, with the establishment in 2001 of a ‘Commission for the transformation of housing permits into land titles’, which was supposed to accelerate the issuance of land titles. The ‘Land and residential security’ programme driven by the Ministry for Urban Planning planned to issue 45,000 land titles between 2005 and 2007 (Le Meur, Reference Le Meur2008, p. 10). Blocked by complex procedures and by the entry of land professionals raising bids on procedures, this has been quite ineffective (see later). At the same time, the Ministry of Urban Planning launched a reflection on a possible reform of land and urban planning.
3 In Rural Areas, the PFRs and the Draft Rural Land Law: The Search for an Alternative to Land Title
In rural areas, two successive development projects, under the supervision of the Ministry of Agriculture and with French and German funding,Footnote 18 have integrated the issue of land tenure security, first as a tool for encouraging farmers to invest in anti-erosion techniques. The project began in 1992 and experimented in different regions in the country with the Plan Foncier Rural (PFR) approach, imported from Côte d’Ivoire, where it had been invented a few years earlier (Chauveau et al., Reference Chauveau, Bosc, Pescay and Lavigne Delville1998; Gastaldi, Reference Gastaldi and Lavigne Delville1998).
In the PFR approach, land rights are identified through cross-checked field surveys, conducted on a plot-by-plot basis. Each plot holder explains the rights he or she has and how – and from whom – he or she has obtained them. The boundaries of the plots are measured with a decametre and then drawn on an aerial photo.Footnote 19 Two types of situations are considered: those of individual owners (‘presumed owners’ in legal language) and those of family communities, represented by their ‘manager’, in other words the representative of the group of rights holders, who has authority to make decisions on the plot in question. The plot holder and the holders of the neighbouring plots sign the survey report. After a publicity phase, which is supposed to allow everyone to verify or correct the collected information, the final plot map and rights-holders’ register are given to the village committee, which is supposed to register future changes in rights (inheritances, sales, leases, etc.) and to keep the land documentation up to date. PFR is thus a kind of village land cadastre, without legal value. However, in the idea of its promoters, the demonstration that it is possible to map ‘informal’ customary rights, which are often considered difficult to understand from the outside, should contribute to promoting a legal reform. This reform could create a new and more appropriate legal status for rural land and thus enable rural actors to obtain legal recognition of their rights.Footnote 20 Some forty pilot PFRs have been carried out in two successive projects in different regions of the country, which allowed the methodology to be put to the test and to be improved. However, the idea of a coherent village territory constituted of juxtaposed farmers’ plots is a simplification. It does not really consider the diversity of customary land rights (CIRAD-TERA, 1998); pastoral rights, commons, and agricultural areas where land rights are not stabilised (Edja et al., Reference Edja, Le Meur and Lavigne Delville2003) are not taken into account.
Present from the outset, the legal reform was put on the agenda in 1998 when a second project was negotiated between the Ministry for Agriculture and donors. Working under the supervision of several ministries (agriculture, justice, economy), a group of Beninese experts (lawyers, anthropologists, economists) drafted a law that was a potential legal revolution: it renounces the presumption of state ownership of unregistered land and provides that every plot subject to ‘rights established or acquired according to custom and, more generally, local practices and standards’ (art. 7) is part of private land. The draft law institutionalises PFRs and gives them, as an outcome, a new legal document, the CFR (certificate foncier rural, rural land certificate). A CFR is a ‘document of recognition and confirmation of land rights established or acquired according to custom or local practices and norms’ (art. 111). It can be individual or collective, it is transferable, assignable, and usable as collateral for credit (arts. 9 and 112). ‘A presumption of acquired rights is attached to it as proof until proven otherwise, established before the judge’ (art. 111).
In line with the recent administrative reforms creating elected local governments (1999), the draft law sets up a local land management framework, anchored in the communes and integrating village-level bodies. Communes deliver land certificates for plots registered in the PFR and maintain land information. Villages benefit from PFRs at their request and can define their own rules for managing natural resources on their territories. All transfers of land rights must be formalised at the village level, and permanent transfers (sales, heritage) have to be recorded at commune level, so that new certificates can be issued.
This reform clearly relies on an ‘adaptation’ paradigm. It rests on a legal innovation, thought to be more fitted to rural areas and much cheaper. The objective is to expand PFRs and thus land certificates with a progressive approach, relying on villages’ demand. Meanwhile, the institutional framework at commune and village level has to be put in place everywhere, to allow for local registration of land transfers even without PFR. The land certificate can be transformed into a land title but, for its promoters, most farmers will stay with a land certificate, which answers to their needs and is supposed to become dominant. With that draft law, new land legal and management frameworks are proposed for rural areas, alongside the land title and the state land administration.
The paradox is that this ambitious reform is made of a policy tool, the PFR, and a law, without a policy statement stating its objectives. It benefits from a relative consensus in MAEP (the Ministry of Agriculture, Herding and Fishing, where some actors support agribusiness and land titling) and more generally among the actors involved in the rural zones and decentralisation policies. Nevertheless, it faces opposition from actors in the Ministry of Urban Planning: for them, specifically rural legislation makes no sense and raises insoluble problems at the boundaries between rural and peri-urban areas; CFR can only be an intermediate document, of much lower status than the land title, and is contradictory to the provisions of the Organisation pour l’Harmonisation en Afrique du Droit des Affaires (OHADA, Organisation for Harmonising Business Law in Africa), which provides (art. 119) that only the land title (or failing that, an ongoing application) is recognised as the basis for a mortgage.
Partly because no policy statement defines the vision, different conceptions of the reform coexist. For its promoters, it creates a long-term alternative to land titles, allowing rural dwellers to have access to legal recognition of their rights. Among them, some want to quickly generalise PFRs over the country, while others prefer a more progressive strategy for expansion, depending on means and needs, starting from areas where PFRs are most useful (Lavigne Delville, Reference Lavigne Delville, Colin, Le Meur and Léonard2009). For those who support classic land titling, PFR is only a temporary framework, and land certificates must quickly be transformed into titles. The diversity of policy options that PFR can serve helps to build adhesion around it.
Ready since 2002, the ‘law on rural land tenure’ was initially blocked by the MCA team. It was finally passed in 2007 with MCA support. In the meantime, an action plan for implementation had been designed, which proposed a progressive strategy under the aegis of an Agency for Rural Land Tenure Management, to be created to take charge of coordination, technical support to communes, and management of a multidonor fund.
4 In the Mid-2000s: The MCA-Benin and the Emergence of a Global Reform Project
In the mid-2000s two separate policies were thus ongoing (Figure 7.1): in urban areas, the Committee for Transforming Housing Permits, which was practically ineffective (see Section II.B.2), and in rural areas, the PFRs, a draft law on which was ready (see Section II.B.3). A new initiative emerged at that time, carried out by the MCA-Benin, with a view to harmonising land law at the national level. Following the 2004 Monterrey Conference on aid funding, the US government created the MCC to support economic development projects proposed by beneficiary countries, officially selected based on good governance criteria. Benin was among the first countries selected. Its government set up a series of workshops to identify the themes around which to build a proposal. Land issues emerged from discussions between the government and the MCC. The Compact was signed in 2006 and implementation took place between 2007 and 2011. The Compact’s ‘Access to Land’ project aimed at overcoming the divide between rural and urban and promoting a global land reform, making access to land title easier and cheaper (Figure 7.1). It had two components: at institutional level, a legal reform that aims to standardise land law, overcome legal dualism, and provide the country with updated legislation; at operational level, field projects were supposed to scale up previous initiatives, in both rural and urban areas. Positioned under the aegis of the Presidency of the Republic, the MCA was the central actor, and the centre for the design and preparation of the land reform. In 2007, shortly after the launch of the Compact, the new President of the Republic, Boni Yayi, officially placed responsibility for land reform under the aegis of the Ministry of Urban Planning. These two bodies have steered the reform.
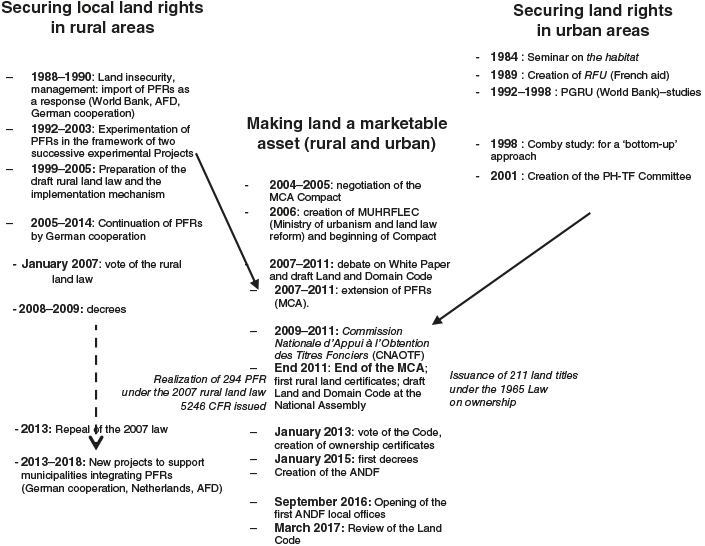
Figure 7.1 Chronology of land reforms in Benin.
The MCA project has been clearly oriented towards the promotion of land titling. During its formulation, the fight has been fierce between the Ministry for Agriculture, defending the PFR and the draft Rural Land Law, and MCA and the Ministry of Urban Planning, claiming leadership of the global reform and wanting to use PFRs as a tool for issuing land titles. Having high-level political support and a strong budget, the MCA reform took the lead after 2006 and signature of the Compact.
Several initiatives towards land reform emerged in Benin in the 1990s–2000s, from several ministries and with the support of different donors (Figure 7.1). All of them tried to answer the issues of informality and insecurity in a context of economic liberalisation and democratic transitions. All relate to what Muller (Reference Muller1990) calls a global/sectoral adjustment: a situation where a given policy sector, built and organised in coherence with a former global policy paradigm, has to adapt to a change in this paradigm, because its vision, tools, and institutions are now outdated. These competing reform projects were all attempts to adjust the land policy and administration to the liberalisation of the economy and to the democratic turn. However, the answers were different, illustrating the contrast between replacement and adaptation paradigms.
In rural areas, titling is almost non-existent, individual ownership is not the rule and most land is held by family groups, and the value of land does not justify supporting the high costs of titling. Specialists in rural areas promoted adaptative strategies, based on a new land administration and new legal documents, to allow for cheaper, affordable access to legal recognition of individual or collective land rights. While the centrality of the land title has been timidly questioned in urban areas, and the shortcomings of classic strategies for developing access to law have been explained by World Bank experts, state bodies clearly chose to push to titling.
III Expanding Access To Land Title Through a Deep Reform of Land Administration: The MCA-Benin-Led Reform (2006–2018)
A ‘Making Land a Marketable Asset’: MCA-Benin and Its ‘Access to Land’ Project (2006–2011)
With a budget of about US$30 million, out of the US$350 million in the Compact, the MCA Access to Land project had the stated objective of ‘making land a marketable asset’, consistent with a vision of the land issue in terms of economy, or in any case with the MCC’s priorities: ‘The aim is to facilitate access to land ownership for the greatest number of people, to remove people from land insecurity by formally registering them, to increase their capacity to access credit and to stop the “slumming” of urban centres that have become areas for receiving massive flows of rural people in search of better living conditions’ (République du Bénin, 2004, p. 4). The reform aims at making access to land title faster (one year against three or more) and cheaper (CFA Franc 100,000 – €150 – instead of a minimum of CFA Franc 300,000 – €450).
In five years, the project wanted to (1) reform land legislation to modernise and standardise it; (2) implement 300 village-level PFRs, issue 80,000 rural land certificates (CFRs), and transform 75,000 CFRs into land titles;Footnote 21 and (3) reform the ‘Commission for the transformation of housing permits into land titles’ and issue 30,000 urban land titles. With its significant resources and its tight timetable, the Compact was for its promoters an opportunity to fight against conservatism, force institutional reforms, and finally make it possible to get rid of informality. The initial schedule of the Land Project provided for the first year to be devoted to land reform, after which the operational components would be implemented in a clarified framework during the following four years. This tight timeframe has been largely overwhelmed.
1 The Institutional Component: Updating the Land Law and Negotiating the Agencification of Land Administration
While the will to reform the land administration was clear, the institutional vision was not yet designed at the beginning. The MCA team recruited an American consulting firm specialising in the sale of technological solutions for the legal security of land transfers to manage the process. The relationship between the MCA and the firm has been stormy, due to conflicts of vision. The diagnosis made (on conflicts, land speculation, women’s access to land) did not take into account current economic and social science results or field studies (Edja, Reference Edja, Bierschenk, Le Meur and von Oppen1996, Reference Edja2001; Mongbo, Reference Mongbo, Longbottom and Toulmin2002; Le Meur, Reference Le Meur2006; Magnon, Reference Magnon2013). It was based on the standard but biased assumptions that customary laws were outdated, and that informality was the source of the problems. The diagnosis partly included the misdeeds of surveyors during housing developments, the monopolisation of the private domain of the state by the elites, and the absence of regulation and supervision of real estate agents. Nevertheless, the operational strategies then took little account of these problems, and seemed to consider that legal and organisational change would suffice to prevent them in the future.
State bodies and professionals involved in land management (surveyors, notaries) were involved in the ‘participatory’ process of policy formulation, civil society organisations, scholars, and other resource people being largely put aside. Debates between interest groups, state structures, and professional corporations were lively. While the initial principle had been to reform the DDET and push for creating local offices, DDET strongly resisted this to keep centralised control over titling. To overcome this blockage, the study on the institutional framework suggested in 2009 a more ambitious reform, with the creation of a National Agency for Land and Domain taking over a set of functions previously carried out by different technical departments spread over several ministries, and issuing and managing land titles, though local offices. Agencification is supposed to bring more professionalism, efficiency, and transparency in land administration.
The white paper (MUHRFLEC, 2011b) was adopted and translated into a policy document (MUHRFLEC, 2011a), itself adopted in June 2011. At the end of the contract with the consulting firm, only a first draft of the Code had been written. The process was then taken up directly by the MCA team, which enabled finalising a draft Code that was finally voted on in January 2013.
2 The Operational Component: Trying to Deliver Legal Documents at a Large Scale
Field operations were supposed to take place after the legal reform. In practice, both took place simultaneously, which led to institutional contradictions, in particular for PFRs. The progress and difficulties that MCA’s operations faced in the field highlight the practical and managerial issues of land rights registration, shedding light on issues that the reform’s implementation will also face.
PFRs and Land Certificates: Institutional Contradictions, Implementation in a Hurry, and a Sudden Ending
The Land Project aimed to create PFRs in 300 villages, covering around one-tenth of Benin. Due to delays in the land legislation component, it was implemented under the 2007 law that had just been enacted and not under the Code in preparation. This led to different biases in the implementation process. The MCA could not rely on a national body for the implementation of PFRs; by mutual agreement, it contracted a consulting firm. Moreover, the MCA team did not support the commune-level institutional framework created by the 2007 Rural Land Law and had little interest in its effectiveness and sustainability. While the existence of a sustainable system for the administration of registered rights is a prerequisite for the sustainability of land rights formalisation operations, the project put the emphasis on the production of maps and registers and the issuance of CFRs, in a non-stabilised institutional framework.
In the pilot PFRs, the priority for field operations was the legitimacy of registered rights. The firms leading the process were committed to sociological surveys, the surveyors being subcontractors. During the tenders for the implementation of PFRs in the villages, the surveyors’ firms claimed to be the leaders of the consortia. They won after a year of struggle, which had consequences for the quality of land rights surveys, which were considered secondary compared to delimitation. The high quantitative ambition in a few years also had many impacts on the quality of the work, by multiplying inexperienced teams, who had to complete the work in a limited time. Moreover, the coordination team did not carry out any real training and support work for the field teams they hired, in order to help them overcome the problems they encountered. While identifying land rights is subtle work, they did not exercise any quality control, leaving the investigations to be carried out by teams of varying quality and sensitivity. The record of rights was heterogeneous depending on the teams, which sometimes pushed for collective registration to limit the number of plots to survey, and sometimes pushed to register individual use rights, even within households. The state public domain has not always been identified in the maps, with the risk of re-creating legal confusion. Almost everywhere, teams could not survey the full village territory, due to conflicts – particularly but not only between migrants and indigenous people (Lavigne Delville and Moalic, Reference Lavigne Delville and Moalic2019) – as well as absentee owners, refusal to survey uncultivated areas, lack of time, and so on. These biases, errors, and problems resulted from a vision of PFRs that underestimated the issues and difficulties of registering customary rights. This is surprising because part of the field teams had already experienced some of these difficulties during the pilot phase, but lessons were not learned.Footnote 22
The first rural land certificates were issued in a hurry, in mid-2011, just before the end of the project, mainly to allow the MCA to say that the process had begun. At the end of the contract, in 2011, 294 PFRs had been carried out of the 300 planned. Many had incomplete surveys and more or less numerous errors. The software for managing tenure information was not fully working. Village committees and communal services were left alone without support for learning and developing experience. Some adopted a wait-and-see attitude, while others tried to conduct their work as best as they could. A new heterogeneity emerged, linked to local land tenure configurations, the interest shown by communal authorities and heads of communal services in land issues, and their capacity and initiative.
An econometric study of the impact of PFRs (Goldstein et al., Reference Goldstein, Houngbedji, Kondylis, O’Sullivan and Selod2018) nevertheless identified impacts. Even without certification, land demarcation activities caused a 28 per cent increase in the proportion of plots with clear borders among male-headed households (which is significant but relatively low for a systematic plot bornage); and plots registered to PFR are 2.4 percentage points more likely than control parcels to be used primarily for perennial crops. However, no impact is seen on farm yields or input use. One year after the end of the MCA project, an MCA survey noted ‘very poor results’ (MCA-Benin/Unité de Formulation et de Coordination, 2013, p. 4). Only 25 of the 40 communes with PFRs used the land information system that had been set up; only 5,246 certificates had been issued (7.2 per cent of the 72,742 expected) and only 3,527 had been withdrawn (4.8 per cent).
The delivery of CFRs was slowed down by enduring hardware problems that in some cases hid the reluctance of communes with regard to PFRs and their management. Communes had not really been involved in the decision to create PFRs on their territory. Their priority was urban land and housing allotments. Taxes on sales, which are an important part of local revenue, were called into question by the PFR system, which provided for sales contracts to be drawn up at village level. Finally, several commune officials were concerned about their future capacity to negotiate land in villages for public infrastructure: if plots had land certificates, would the villagers still agree to freely give land to the commune for building a school? If land had to be purchased or expropriated by the commune, the cost of investments would increase.
As a result of pressures from the MCA Coordination Unit, the number of CFRs issued and delivered increased, at a very heterogeneous pace depending on local issues. However, their future was uncertain as they were recognised in the Code, but with a low legal value, equivalent to the old administrative certificates.
Transforming Housing Permits Into Land Title: A Stalemate
In urban areas, the objective was to accelerate the transformation of residential permits into land titles. The pilot operation carried out in Cotonou and Porto Novo had issued only 1,483 titles in three years, including 292 in the name of the state and 1,191 in the name of land interest associations, bringing together the owners of housing land. By July 2006 only 110 beneficiaries had withdrawn their title (Lassissi, Reference Lassissi2006). The Land Access Project restructured the National Commission and provided it with substantial financial resources. A new Commission Nationale d’Appui à l’Obtention des Titres Fonciers (CNAO-TF, National Support Committee for the Acquisition of Land Titles) was created in February 2009 and began its work in June 2009. The first land titles were delivered in June 2011, six months before the end of the MCA project. At the end of 2011, more than 10,000 cases had been initiated but only 211 titles issued. After the end of MCA funding, the Commission continued operating, with reduced resources coming from the national budget. By August 2014, 3,531 titles had been issued, of which only 1,567 had been withdrawn by their holder (including 1,190 for the city of Cotonou alone).Footnote 23
The restructuring of the Commission and the amount of resources mobilised have therefore only partially improved its productivity, which remains marked by a low demand, a complexity of procedures requiring the intervention of multiple actors, and great difficulties in gathering legal evidence, even on housing allotments made by the state. Created for an initial period of five years, the CNAO-TF was extended in 2014 for another five years, with a target of 3,000 titles per year, too small to reach the initial MCA target in ten years, and in any case largely insufficient to move urban land out of the informal sector. After the establishment of the ANDF in 2016, the CNAO-TF was shut down and its files were transferred to its decentralised offices.
In rural as well as urban contexts, the important MCA funding proved unable to significantly enhance the delivery of legal land documents. In urban areas, institutional bottlenecks linked to the participation of notaries and surveyors, as well as the complexity of meeting the legal requirements, have bogged down the process and the very small number of land titles withdrawn raises questions about people’s interest. In rural areas, contracting with firms allowed the target of 300 PFRs to be reached, at the cost of low quality but above all a lack of institutional anchoring. Very few land certificates had been issued at the end of the project.
3 After the End of the MCA Project (2012–2015): Uncertainties, Reconfiguration, and the Vote on the Code
At the end of the MCA project, the planned major reorganisation of land management had only been initiated. A geodetic station system had been set up. A preliminary draft Code had been drafted, but did not seem at that time to have strong political support and its adoption was uncertain. The delivery of titles and certificates fell far short of the targets. The rural land management system had been put in place in forty of the seventy-seven communes, but its future remained largely uncertain, and the whole system was in danger of rapidly collapsing due to a lack of institutional consolidation. The MCA team, which carried out all of these actions, had been dispersed. However, the reform process continued with the vote on the Land Code in early 2013, the redaction of the decrees in 2015, and the creation of ANDF in 2016.
Finalisation and Voting on the Land and Domain Code (2012)
The legal reform process went on after the end of the project. The lawyer in charge of it in the MCA team pushed on the work after the end of the Compact and tried to move the issue forward at the political level. Confronted with their desire to unify the legal framework and with strong criticism of standard registration and land title, the reformers eventually abandoned the term ‘land title’. They conceptualised the logic of the Code in terms of ‘confirmation of land rights’, with a twofold channel, that of individual demand (which barely modifies the standard registration procedure) and that of PFR, both resulting in a single private property document, the Land Ownership Certificate. No provision is made for collective processes in urban contexts. Unlike the land title, a Land Ownership Certificate can be challenged in court for a period of five years in the event of fraud or error.
A preliminary draft Code, a long text of 543 articles, was completed at the very end of the MCA project in 2011. It bore the imprint of the multiple expert meetings and controversies that marked it. Fearing that the Code would favour land grabbing, a young farmers’ union, Synergie Paysanne, gathered a dozen non-governmental organisations (NGOs) within an ‘Alliance for a consensual and socially just Land Code’. Faced with difficulties in accessing information and a certain lack of transparency in the process, the Alliance mobilised to impose itself at the table and try to influence it through public meetings and advocacy (Lavigne Delville and Saïah, Reference Lavigne Delville and Saïah2016). It unsuccessfully advocated for restrictions on land sales. The final draft Code was submitted to the National Assembly in 2012. The government was indeed facing an emergency, as new MCA financing was in sight (which would not work on land). For the government, enacting the Code was a proof of goodwill towards the MCC, in a context in which Benin was, for a time, criticised for corruption and could have lost the opportunity of a second Compact.
The vote on the Code occurred in January 2013. The text puts the future ANDF under the supervision of the ‘Ministry in charge of land’. However, no ministry at that time had land in its attributions. A strong inter-institutional struggle then opposed the Ministries of Finance (head of DDET) and of Urban Planning. The former highlighted the possible risks for land tax collection if land and cadastre were not under its responsibility and ultimately gained control of ANDF. The text was finally promulgated in August 2013, but by the end of September no signed version had been circulated and the various actors were still trying to verify if it had really been promulgated.
A Reconfiguration of International Support and Field Projects
The end of the MCA Compact led to a vacuum. Although not involved in land issues until that time, the Dutch Embassy agreed in 2012 to support a transitional phase, aimed at advancing the implementation of the recently adopted Code, through the preparation of implementing decrees and support to municipalities in the management of PFRs. It also supported the creation of an informal coordination group on land issues, bringing together donors, national institutions, NGOs, and farmers’ unions, to facilitate the exchange of information. This coordination group allowed for a certain institutional decompartmentalisation of the land sector, after the strong monopoly exercised by MCA.
As no national institution was at that time clearly in charge of the reform, the Embassy gave responsibility to the MCA Coordination Unit, the team coordinating the preparation of the new Compact, even though the land experts from the first phase had been dismissed and the second Compact would not work on land. In a phase of institutional vacuum, a MCA team with no legitimacy on land issues any longer was asked to prepare decrees. The legal expert recruited, who had been strongly involved in PFRs since the beginning, did important work in mediating and negotiating decrees, and in attempting to remedy a number of shortcomings in the Code. Fourteen decrees were prepared, which were promulgated in January 2015.
Support to municipalities in the management of PFRs only started at the end of 2014, after three years during which the PFR system, the commune land services, and the village committees were left alone. The consolidation project only in practice had time to refinance some equipment and run a series of training sessions and could not prevent the gradual collapse of PFRs.
During that period, several development projects, funded by the German Corperation for International Cooperation (Deutsche Gesellschaft für Internationale Zusammenarbeit, GIZ) and the Agence Française de Développement (AFD), continued to implement PFRs in their own areas. These projects had supported the initial design of PFRs as an alternative to land title and were concerned about the orientations of the Code. After the vote on the Code, they reviewed their approaches in the light of changes in the legal framework, and in particular the obligation to also survey residential areas. Finally, in parallel with supporting the preparation of the decrees and first contacts with ANDF, the Dutch cooperation financed a local land management project in two municipalities in the south of the country (2015–2018), in order to experiment with the reform and provide tools and methodologies. Conceived as projects to support decentralisation, these various projects promoted PFRs from a rural and communal point of view, and sought to negotiate modalities of implementation of the Code that were anchored in local contexts. They were in tension with the newly created ANDF, which was seeking to assert itself.
4 The Gradual Implementation of the New Institutional Framework (2016–2018)
The years 2016–2018 saw the establishment and ramping-up of ANDF, the repositioning of the various actors, and the beginning of the actual implementation of the Code. The amount of work done during these years is impressive. The institutional landscape became clearer after the adoption of the decrees in January 2015 and the attribution of ANDF’s supervision to the Ministry of Finance. The state then took charge of the deployment of the institutional mechanism provided for by the reform, which took place in a coherent manner. The Ministry of Finance reorganised itself, dissolving DDET and integrating ANDF into its organisational chart. An action plan for implementing ANDF was defined in July 2015 (Gandonou, Reference Gandonou2015). The lawyer who led the reform at the MCA level was recruited as general director. While ANDF is supposed to have offices in every one of the seventy-seven communes, fourteen ANDF local offices (one per department, plus one for Abomey-Calavi and Ouidah) were officially opened in September 2016.
President Talon’s coming to power in 2016 gave a boost to the reform. His programme (Bénin révélé) provides for a faster and cheaper transformation of housing permits to land title, the creation, of a national cadastre and the operationalisation of ANDF. President Talon ordered taxes on land registration to be lowered to make access to title cheaper. The committee for the cadastre was created in November 2016.
In May 2017, the Parliament passed a law (no. 2017–15) amending and supplementing the 2013 Code. At the same time, a digitisation project for land documentation was launched from April 2017, implemented by a French consultancy firm, which collected all land information (titles, supporting documents such as sales agreements or administrative certificates, plot maps of PFRs and housing allotments) to digitise them and integrate them into a single geographic information system (GIS). The spatial calibration of land titles was a huge task, since the references used by surveyors were heterogeneous. Land subdivisions were relatively easily repositioned on satellite images, but for individual titles it could be more complex. The team almost succeeded in positioning existing maps and titles in the GIS, but the information on landowners was still indicative, as the data were sometimes fake (in cases where only the planned resettlement plan exists, and not the final one) or obsolete due to changes, inheritances, transfers, or even fragmentation since the time the maps were drawn up. The consulting firm also had to validate the demarcation plans for new titles before integrating them into the GIS, which led them to reject many plans and force surveyors to do their work again. Field experiments for the implementation of the land cadastre in areas without land information were launched in early 2019, as part of Dutch support.
At the end of 2018, the institutional framework and its tools and procedures were more or less in place, apart from the cadastre. 47000 titles had been digitalised. ANDF had just over 200 agents, many more than the former DDET. Land documentation had been transferred almost entirely to the BCDFs. ANDF began issuing new land titles in April 2018Footnote 24 at a very slow pace (only 1,587 land titles were createdFootnote 25). Applications for new land titles were being processed, with a view to meeting the tight deadlines imposed by the Code. Pending applications were processed gradually.
In October 2018, Benin national mayors’ organisation (Association Nationale des Communes du Bénin, ANCB), with the support of the Projet Foncier local (local land management project), funded by the Netherlands, organised a National Workshop on Land to assess the situation. It established a progress report on the reform five years after the vote on the Code and allowed a dialogue between commune heads, ANDF, and the projects (Boughedada and Lavigne Delville, Reference Boughedada and Lavigne Delville2021). A new support project for ANDF, the Land Administration Modernisation Project, was launched in December 2018, also funded by the Netherlands.
B The Land Code, Its Provisions and Controversies
In this section I will describe the main provisions of the Code, and highlight some contradictions or loopholes. I will then explain the controversies that followed the vote and the main changes made by the 2017 revision.
1 The Main Orientations of the Code
The 2013 Land and Domain Code is an ambitious text that aims at radically reforming the legal and institutional framework of land tenure in Benin. It includes 543 articles, organised into 10 titles and 31 chapters. It explicitly repeals the 1965 Ownership Act, the 1960 Housing Permits Act, the 2007 Rural Land Tenure Act, and also, implicitly, the 1955 and 1956 decrees.
The Code updates the 1965–25 law on ownership, adding specific provisions from the 2007 Rural Land Law, and reorganising land administration around ANDF. Focusing on private ownership, the Code intends to break with legal dualism and standardise the law. It recognises a single title of ownership, the Land Ownership Certificate (Certificat de Propriété Foncière). This new name for what is fundamentally the classic land title is the result of a compromise between land title and CFR, and an answer to criticisms on the intangible, unassailable nature of land title, which allows dispossession and enables impunity even in the event of fraud or error. The Land Ownership Certificate is still intangible, but it temporally violates this principle by assuming that it can be contested in the event of fraud or error within one year after the discovery of the fraud (art. 146). However, any action lapses after five years from the date of establishment of the Land Ownership Certificate.
The Code follows the logic of the ‘confirmation of land rights’, with two ways of obtaining a Land Ownership Certificate. One is on an individual basis and follows the former standard procedure of registration, while improving local information. This process must respect a maximum duration of 120 days (art. 139). The other is collective, via the PFRs or collective confirmation processes (art. 142 ss), at the request of local authorities or a group of urban owners organised in a land interest association. The Code creates an Attestation de Détention Coutumière (ADC, Attestation of Customary Possession) for the rural environment, a new intermediate document issued by the local land management offices. In individual applications, this attestation, relocation certificates (obtained after land subdivisions for housing), and tax notices for the last three years can be used as ‘presumption of ownership’ documents to initiate the confirmation request. The recognition of tax notices as implying a ‘presumption of ownership’ is an important step towards the recognition of peaceful occupation as a source of ownership. However, sales agreements, housing permits, administrative certificates, and CFRs – that were until now the most accessible documents and the most used by citizens – are no longer recognised as documents allowing a person to apply for a Land Ownership Certificate.
As in the 1965 law on land ownership, the confirmation of rights is not mandatory. This maintains a dualism between plots having a Land Ownership Certificate and other plots. A new ‘certificate of membership’ (mentioned but unspecified in the Code) may be issued by the Land Agency to allow the sale of a plot whose registration is ongoing, and to allow for a credit. As in the 1965 law, only sales create an obligation to obtain a certificate, under penalty of nullity. It remains to be seen whether ANDF will have the means to impose this rule, knowing that it imposes a deadline of several months, which is incompatible with the urgency of financial needs that frequently trigger sales. Any sale concerning a titled plot of land must be drawn up in the form of a notarial deed or, failing that, under private contract and deposited in the minutes of a notary (art. 18), before being copied and added to the Land Ownership Certificate by the local land office. The transition from ‘informality’ to land title is thus progressive, with a long period of coexistence between informal and titled plots.
In urban areas, possession of a Land Ownership Certificate is the norm. Housing permits have been abolished. The idea of a quasi-automatic transformation of existing housing permits into land ownership has therefore been abandoned. The Code reaffirms that housing permits can only be issued on state titled land. The future of the hundreds of thousands of housing permits issued by communes is thus unclear. In rural areas, the Code integrates PFRs and the institutional framework created by the 2007 law, with a land management committee at commune level with few prerogatives, having branches in every village. Every land transfer contract (final or temporary) relating to rural land must be registered at the village committee. PFRs now lead to Land Ownership Certificates issued by ANDF local offices. It is not clear whether obtaining a certificate for a plot registered in a PFR is automatic or upon request, but CFRs already issued are ‘upon simple presentation by the holder, transformed into a Land Ownership Certificate’ (art. 520). The Code therefore introduces some specificities for untitled rural land, which is inconsistent with its ambition to standardise the law and reproduces the problem of delimiting rural and urban land, which was criticised in the 2007 law.
The Code establishes a cadastre (Chapter 4, art. 452–481) with a triple purpose: technical (representing all the plots of land in the country), fiscal, and also legal, for land covered by a Land Ownership Certificate. The Code also defines the rules for the management of the public and private domains of the state and of local governments. ANDF is in charge of the state domain, and is supposed to hold the general picture of the state’s ownership, which the former DDET proved unable to do.
The Code incorporates an innovative principle of ‘extinctive’ prescription for customary land, in order to avoid former owners or relatives of former owners challenging the sale of plots of land. However, no prescription is possible for land titles, even if one existed in the 1965 law for the benefit of the state (art. 82). It also creates a right of pre-emption by the state, exercised by ANDF, in order to reconstitute a private domain of the state. However, the purposes and modalities of pre-emption are not defined either in the law or in a decree. The Code devotes a full section to the question of litigation and defines the methods of contestation and arbitration. It also introduces a criminal land law, which has not existed until now: to discourage fraud and errors, it provides for severe penalties, both for individuals and for officials (mayors, land administration officers; art. 487–515). The amount of penalties provided for land administration managers in the 1965 law had never been revised and were not dissuasive. The heavy threats may have a real deterrent effect on local elected officials in particular. New research will be necessary for assessing whether they materialise and make it possible to end the wide impunity that has so far been the rule.
2 Criticisms of the Code and the 2017 Review
The controversies during the negotiation of the Code did not stop after the vote. The preparation of the decrees raised various conceptual and practical problems. The need for a partial revision was quickly recognised and it occurred in 2017.
The professional organisations of specialists working in land issues had been largely involved in the preparation of the Code. However, two months after the law was passed, the organisations representing the professions working on land issues (notaries, surveyors, architects, etc.) published an open letter denouncing the inconsistencies and weaknesses of the text, and in particular calling into question the change from land titles to Land Ownership Certificates.Footnote 26 For them, the Code made confusing terminological choices and introduced new legal concepts whose consequences had not been assessed. It did not remove legal dualism. More than that, it introduced new land insecurity by challenging the ‘inviolability and sanctity of ownership’ and by introducing a five-year time limit during which it is possible to contest a Land Ownership Certificate.
For these professionals, those few openings in the conception of land titles represented sources of insecurity and were unacceptable. They followed the analyses of lawyers (Djogbénou, Reference Djogbénou2013, p. 28) who, while acknowledging the innovations of the Code, also considered that the possibility of challenging a Land Ownership Certificates weakened it deeply and was ‘a step back from the 1965 law’. They considered that this measure would increase the number of disputes, and the risk of the certificates being challenged prevented banks from granting loans.
The communes had had little direct involvement in the preparation of the reform. Under the Code, they no longer have the right to endorse sales agreements and receive taxes for that. However, the revenues derived from their land responsibilities constituted a significant part of their resources: throughout the country, resources of land origin represented 14–18 per cent of communal revenues, half coming from taxes on land sales agreements (Gandonou and Dossou-Yovo, Reference Gandonou and Dossou-Yovo2013, pp. 29–30). The ANCB was particularly active after the Code vote. It engaged in efforts to secure a seat on the ANDF Board of Directors and the Land Advisory Council, and to recover some prerogatives for communes, mainly with ADCs.
Development projects carrying out PFRs and the ANCB had also invested in the new ADCs and insisted on the need to better define its content and modalities. They worked together to propose a methodology and format for ADCs and fought to ensure that their delivery – which must be paid for – is devolved to the municipalities.
The 2017 amending law tried to answer these issues. It provided for the return to the land title, with its intangible nature. Any fraud or error can again only give rise to compensation, paid by the state from the newly created land compensation fund (art. 147). The state may then claim compensation from the fraudster. The return to land title was legitimised by both the OHADA (French-speaking Africa’s regulations for business) and the fears expressed by professional organisations of lawyers and surveyors. The fact that the state should compensate victims is an innovation that might be costly for the state.
In accordance with the demands of the ANCB, the 2017 law recognises the responsibility of communes to issue ADCs, without explaining whether those ADCs are to be registered with ANDF and how. In the 2018 Finance Act, the state defined tariffs, preventing communes from setting them freely and reducing their expectations in terms of financial resources. An ADC would cost around CFA Franc 35,000 (€53), depending on the size of the plot. This is well above the cost of the former CFRs (between CFA Franc 2,000 and 5,000 – €3–7.50 – depending on the commune and the size of the plot) and quite expensive for rural people.
In practice, as lawyers involved in the Code recognise it, the ADC is nothing more than a renewed administrative certificate, with more formalised procedures and a mandatory field survey involving village land committees. The first requests registered in the municipality of Tchaourou were made by buyers looking for a ‘document of presumption of ownership’ to initiate a request for land title. As farmers’ interest in documents is not very high in most of the country, it is very likely that the ADC will mainly play this role, diverting it from its primary purpose.
The 2013 text was very restrictive and only a few documents could be used for requesting a land title. The documents giving presumption of rights and allowing a title to be applied for have been extended and now include again administrative certificates and CFRs. Sale agreements are still not recognised as giving a presumption of ownership.
An additional paragraph to article 112 should make it easier to transform housing permits into land titles. A first decree (No. 2018–473 of 10 October 2018) was promulgated that concerns housing permits established on land belonging to the state. Another one was scheduled for housing permits delivered by communes on non-state land, outside the law, which is a crucial issue for many urban dwellers, but it has not been released. The duration of the transition phase has been extended to ten years (art. 256) – that is, until 2023 – which will be barely sufficient for the actual deployment of the system.
The 2017 version of the Code also contains a strange, long new section of eleven articles on ‘land ownership in border areas’. According to some informants, a specific law on borders had been prepared but had not been put on the agenda of the National Assembly. The content of this draft law in this new section was incorporated into the Code at the request of the National Border Management Agency, and the Members of Parliament hardly noticed it during the debate in the Assembly.
Several contradictions or inconsistencies (or even French-language mistakes) identified earlier have not been addressed and new ones have been introduced, showing the limited ambition and care of this review.
C Conclusion: Temporality of Projects versus Temporality of Policy Reform
The five years following the end of the MCA project (2012–2016) were a period of further institutional change and consolidation of the reform. The tight schedule provided for in the MCA project was considerably extended. The initial project, which in five years wanted to link legal reform and a scaling-up in the field, was confronted with the reality of policy change and project implementation, with induced negotiations, power relations, and operational constraints. One can finally consider that the temporalities were eased with a policy reform that was almost done in 2016, allowing implementation to begin, while results on the ground were far below the initial objectives (Figure 7.2).
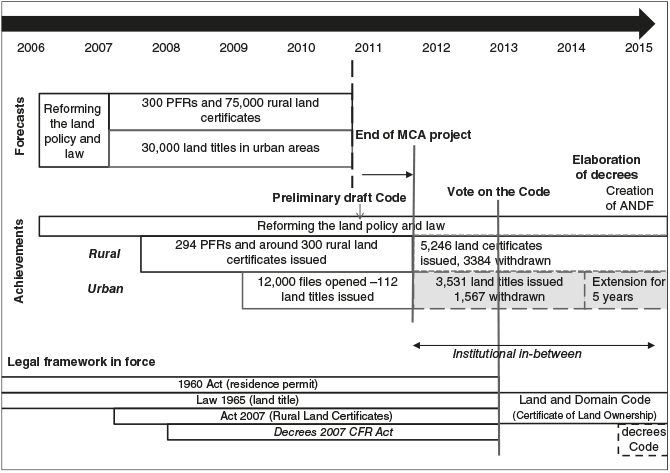
Figure 7.2 The MCA project: Delays in time and results
The objectives and timeframe planned into the Compact had been very optimistic, not to say unrealistic. The corporatist struggles largely slowed down the operational aspects. But even more, the conception of the reform created a confusion between the temporality of the policy reform, which is not predictable as it includes political negotiation and compromise, and the temporality of projects, which are supposed to be feasible in a given timescale. The MCA team saw land policy reform as a technical issue that they could achieve in a short timeframe, allowing for a quick implementation in the field. However, negotiating the legal reform took much more time than planned. In consequence, land reform and field operations were done simultaneously. The latter were implemented within the former legal framework, in an institutional in-between period. Therefore, the transformation of housing permits into land titles could not benefit the intended flexibility in the registration procedure and PFRs were made within the context of the 2007 law, whose institutional arrangements were under question. One can consider that the operational component has been quite a failure and a big waste of money. It nevertheless obliged reformers to take stock of implementation issues.
The institutional component has been more successful. In 2016, however, the reform was not yet fully stabilised. The Code was slightly revised in 2017. The Finance Law reduced the cost of land titles and customary ownership certificates and temporarily offered free registration of transactions (instead of at a cost of 8 per cent of their amount), which led to many regularisations. However, the compilation of available land information is still ongoing, and not all the tools are set up. The agency’s decentralised offices are open in only fourteen communes out of seventy-seven. The teams face difficulties in processing land title applications in a timely manner. The cost of the land title has not dropped significantly, because the main cost – plot demarcation and landmark setting – is still at the discretion of the surveyors. Even if new offices have been opened, the number of notaries remains very low, and above all very unevenly distributed throughout the territory. The same applies to surveyors. The cadastre is being built gradually from existing documentation, but with uncertain information on owners outside the areas with land titles. Extension to areas without cartographical documentation will face the same difficulties as PFRs and will require considerable resources, which are not yet available.
IV Five Years After the Code: The Reform’s Strengths and Limitations
A A Difficult Negotiation: Promoters and Opponents
The broad consensus on the need for reform by the 2000s masked different visions of the origin of the land problems and the solutions to be promoted, with an intersection of political visions, a variable knowledge of land realities as they are experienced by citizens, and corporatist or institutional visions and interests.
The main foundations of the reform were laid very early on, in the 2005 Compact’s project document, but its precise formulation and implementation have been a process, hampered by several conflicts of vision and interests, which have affected its trajectory. Those political conceptions and representations of the land sector and those interests strongly influenced the reform process. Several groups of actors and dividing lines can be identified.
1 A Struggle between Two Visions of Problems and Solutions
The first controversy was between PFR promotors and the MCA formulating team, on the way to adapt to the new context of the 1990s–2000s. While some experts timidly tried to discuss the centrality of the land title in the urban context, they did not constitute a real force, and it does not seem that associations representing urban populations mobilised on the subject or criticised the focus on land title in terms of inclusion.
The historical network of actors supporting PFRs as an alternative to land title was partly anchored within MAEP, and partly within the various projects implementing PFRs under its supervision. They highlighted the specificities of land tenure in rural areas and they contested the land title, both in its logic of exclusive private property guaranteed by the state, and in its procedures, cost, and defects in terms of people’s security of rights. Some of them joined the MCA team and were considered as traitors by the others, who continued to challenge the very logic of the reform promoted by MCA or to negotiate compromises, using their position as experts in field projects, anchored in communes, to emphasise concrete problems linked to the implementation of the Code. These opponents tried to preserve CFRs as a durable solution for farmers and a commune-level management system for those certificates, autonomous vis-à-vis the national land administration. For them, a Land Code only had to be a hat, encompassing various sectorial texts including the 2007 Rural Land Law.
While farmers’ organisations had not been involved in the design of the PFR and the drafting of the 2007 law, a young farmers’ union quickly mobilised against the risk of land grabbing linked to the emphasis on titling and fought to obtain better control over those risks. The umbrella farmers’ organisation explicitly entrusted the land reform issues to this farmers’ union. However, its leaders, who are big farmers, did not necessarily contest the land title itself. On the other hand, livestock associations were rightly concerned about the future of pastoral areas, mobility, and access to crop residues in a Code based on private ownership that does not say a word about their existence.
Even if their priorities were different, the network of experts defending historical PFRs, MAEP, and the farmers’ organisations thus shared interests in working together, exchanging information on a process that they found very opaque and trying to influence the draft Code. After the vote of the Code, each of them repositioned themselves around the issue of implementation and its practical problems. The project teams made a new alliance with communes. The new issues related to the future of existing CFRs and completed PFRs, the future role of communes in land management, technical criteria for the implementation of PFRs, modalities for the integration of PFRs, and the future cadastre. These were all points of contention with an ANDF that had just being set up and was seeking to assert itself. Those tensions reflected both different conceptions of reform, a defence of PFRs (which seemed threatened by the ANDF), and a demand for the autonomy of projects and their programming from ANDF. In particular, the end of 2016 saw a major conflict between ANDF and the projects: ANDF wanted to stop every cadastral operation until its own cadastral software was ready; while the project teams agreed that while new PFRs had to be integrated later into the cadastre, they refused to stop making new PFRs because of their own objectives and contractual commitments.
After the vote on the Code, the issue of the desirability of formalising land rights, which had been raised in the early 2000s around the scope of validity of PFRs and the case of pioneer areas and village reserves (Edja et al., Reference Edja, Le Meur and Lavigne Delville2003), had largely disappeared from the debate. The latter then concentrated on the spaces left by the Code for other options: was it still possible to deliver CFRs on PFRs that were already finished? Were PFRs without legal formalisation useful for securing farmers’ rights? In private, some stakeholders questioned the relevance of continuing to conduct PFRs in the new context. Others tried to address the issue of user rights, and the relationship between rights holders and farmers, in conjunction with the Ministry of Agriculture. This related issue of land tenure security had always existed in historical PFRs but had remained secondary.
2 Inter-institutional Struggles to Protect Interests
A second front of struggles opposed the reformers to existing land management bodies. They first faced DDET, responsible for the issuance and administration of land titles within the Ministry of Finance. We saw that DDET’s lack of equipment and its practices, but also its high degree of centralisation, were one of the causes of the problems identified. The decentralisation of DDET was already planned in 2004. The MCA team fought throughout the Compact for the opening of district offices, which DDET slowed down as much as it could. Such decentralisation was essential to bring land administration closer to the people, but it meant cutting the power of the DDET head, who had control over title application files for almost all the country and in particular on the periphery of Cotonou where the land issues are most intense. The strong resistance of DDET to any decentralisation finally convinced the MCA team that internal reform was impossible and that land administration should be entrusted to an autonomous agency.
The Ministry of Finance did not seem to be very active in formal debate arenas, preferring to follow the process, negotiate directly at a high political level, and assess the risks without being overly visible. DDET exercised strong passive resistance during the first phase. After the reform was adopted, the Ministry of Finance invested heavily to win the battle for the agency’s supervision. Having won, it became a supporter, undertook a series of internal reforms to integrate the ANDF into its organisational structure, reformed the scope of DDET’s competence, and organised the transfer of files.
The Institut Géographique National du Bénin (IGN) is part of the inefficient public structures in a situation of monopoly rent. The entire history of PFRs has been marked by complicated relations with the IGN, which did not provide – or only did so very late – the services that were required of it in terms of the provision of aerial photographs or satellite images. During the MCA project, the IGN was responsible for the quality control of the PFR maps produced, which it did with very variable rigour. Without real success, the reform tried from the outset in the early 1990s to reform the IGN by integrating it into the ANDF. The IGN finally avoided it.
The reformers also opposed the communes. The MCA team and land specialists strongly criticised their land practices (allotments, issuing administrative certificates, asserting sales agreements without real rigour, and issuing housing permits outside the legal field). Mayors rightly consider that the reform represents a deliberate desire of the legislator to reduce the prerogatives of communes in land management (Gandonou and Dossou-Yovo, Reference Gandonou and Dossou-Yovo2013, p. 24). As we have seen, the reformers condemned communes’ land practices without taking into account the institutional deficiencies of the state, which partly explains their ‘semi-formal practices’, and without attempting to reorganise and upgrade them. The Code removes most of the land responsibilities of communes, also greatly reducing their resources. After the vote on the Code, communes fought to recover some responsibilities and incomes.
The reform also challenges the role played by MAEP on rural land. MAEP is divided between the promotion of family farming – and thus the protection of peasant rights – and of agri-business. While the 1999 policy paper supported family farming, the first draft of its 2005 policy document was clearly pro-agri-business and the official position is now mixed. From an institutional point of view, the fact that the management of the reform has been entrusted to the Ministry of Urban Planning extends its prerogatives to the rural world. MAEP tried to maintain control over rural land, mainly in supporting the PFRs, the supervision of which was explicitly assigned to it in the 2007 law. Its defence of this Rural Land Law is as much about this institutional challenge as it is about a vigorous defence of peasant rights. However, the Ministry is politically and technically quite weak and it could not really influence the reform. After the vote on the Code, MAEP repositioned itself around the productive dimensions of land and invested in the theme of tenure contracts, totally neglected by the Code.
3 Professionals: Between Carrying Out the Reform and Protecting Vested Interests
The last group of actors is made up of the various professionals working in the land sector, in particular surveyors and notaries. Surveyors have a very strong position in Benin. They are at the heart of the defence of the classic land titling procedure, which offers them a comfortable income. Indeed, for each plot they have to do two delimitations, the first to make the map that is part of the application, the second during the titling procedure. The decree regulating their profession gives them a monopoly over all topographical work even where less skilled professionals could do it cheaper (we have seen how they fought for leadership over land operations in MCA PFRs). They are also among the actors who benefit greatly from the confusion by managing land subdivisions in a discretionary manner, manipulating registries and selling the land information they keep for themselves. IGN surveyors frequently hold positions both in the public service and in private practice, with obvious conflicts of interest. They have been at the forefront of demands to apply urban standards to rural areas, and to take advantage of the use of high-precision GPS to impose unnecessary accuracy. MCA commissioned the President of the Order of Surveyors for the study on PFR techniques (Steward International, 2009), which, not surprisingly, advocated the application of titling standards to PFRs.
Land professionals can be considered as co-authors of the reform, including when they have hindered any simplification of procedures that would be against their interests. One can wonder if and how far extending their role and clarifying the rules of the game will be sufficient to stop their illegal practices. Notaries also benefit greatly from the reform: at the end of the transition period, no plot of land can legally be sold without the sale being carried out in the form of an authentic deed or in any case registered in the minutes of a notary. This increases notaries’ volume of activities and allows them to develop their intervention outside urban centres. Although they were involved in the drafting of the Code, surveyors and notaries were both signatories in April 2013 to the open letter vigorously contesting the Code.
B A Deep and Necessary Reform of Land Administration and Tools: The Limits of an Orthodox Approach
During the same time as they have opposed the Ministry for Agriculture and rural experts on the issue of customary rights, the promoters of reform have thus had to fight also against an ossified land administration. They have had to force it to reform itself, rally professionals who were part of both the problem and the solution, and marginalise those who contested the basic options proposed while taking into account some of their proposals. In an interview in 2008, one of the reform’s main architects said to me that his work was in fact a huge task of administrative diplomacy. Having succeeded in overcoming those many obstacles, bringing the draft Code to a successful conclusion and obtaining the political support necessary for the implementation of the reform are in themselves important achievements.
When no real attempt had been made between 1965 and 2007 to update the land law and administration, the Beninese Government supported by the MCA team succeeded in promulgating a new Code that is a single, up-to-date text, integrating private land and state ownership. Besides reforming land administration, the Code brings institutional innovations to address real problems, such as measures on litigation, extinctive prescription, and criminal land law. It also partly endorses the innovations made by the 2007 Rural Land Law.
However, it reflects a classic and normative conception of land rights, where practices must be brought into conformity with the law. Far from starting from current land rights and problems faced by citizens to design concrete solutions, it mainly reproduces the classic conception of land titling, under the assumption that most of the evil came from the fact that the law was not respected, and from the lack of technical tools. In the typology suggested by Comby (Reference Comby1998b, p. 20; see Section I.A), the reform mainly follows the logic of ‘improving practices and reorganizing administrative means in compliance with existing law’, coupled with elements of ‘a policy of punctual improvements leading to significant improvement’, a logic that he thought was a dead-end.
The Benin reform is more a reform in land administration than a reform changing the conception of land issues. This strategy allows for significant progress (institutional coherence, more proximity, with land offices in each department; cadastral maps for localising titles; titles less costly and with faster delivery; hope of more transparent land administration), which was necessary and cannot be underestimated. At the same time, it also has its limits, especially for the rural world:
Despite the willingness of its promoters to move away from legal dualism and to standardise the law, the Code could not avoid reproducing this dualism, maintaining a divide between titled lands and others. This applies to the urban environment, at least until every urban plot is titled, which will necessarily take time. It is much more the case in the countryside. There, the Code had to create a new intermediary document, the ADC, to respond to situations where title is unaffordable. But, while being legally defined (which was not the case with the old administrative certificate), ADCs may pose the same problem: a lack of cartographical support to locate the plot, and a relatively high cost that can be problematic for poor farmers or in places where the need for such a document is not obvious for rural dwellers. One can even perceive a step backward compared to the CFR, which was limited to plots of land registered in the PFR, but represented an intermediate document, with the same legal content and really inexpensive.
Although it officially aims to reduce insecurity and conflict, the Code only addresses the problem of sales conflicts by prohibiting any sale on a plot without land title. While legally coherent, such a measure is difficult to apply in a context where very few plots have a title and where the rate of issuance of new titles by ANDF remains very low. Even more, it imposes a temporality that is incompatible with the rates of sales (distress sales, which are urgent, form the majority in rural areas) and the cost of a title is still high compared with the value of the land in most regions. Moreover, nothing is said about what should be put in sales contracts, and how to ensure that the seller has the right to sell and, in the case of family plots, that the other rights holders agree. While they play an important role in the land market, the profession of intermediary or direct sellers is not regulated. A significant part of the functioning of land markets is not addressed.
Although incorporating provisions specific to the rural environment, the Code refuses to take into account the diversity of rights existing in rural areas and the existence of collective rights at different scales. Such rights are mentioned here and there, but their status and treatment remain extremely ambiguous. The reality of land rights in rural areas is very diverse, as we saw. While PFRs have sometimes induced a dynamic of individualisation, this is not general and does not always leads to individual ownership. By proposing only individual ownership, the Code induces tensions both within extended families and between indigenous people and migrants (Lavigne Delville and Moalic, Reference Lavigne Delville and Moalic2019), far from the ambition to ‘overcome the climate of mistrust that generally prevails between customary landowners and that are generally indigenous and migrant exploiters’ (République du Bénin, 2004, Annex 1, p. 16). This situation jeopardises the principle of access to land for every lineage member, which is obsolete in the densest areas, but remains valid elsewhere and plays an important role in social security.
Finally, the measures planned to combat land speculation in rural areas appear to be largely symbolic: authorisations are required for land purchases in rural areas (art. 261), with an obligation to carry out a development project above 2 ha and authorisations that depend on surface thresholds. No acquisition of land can exceed an area of 1,000 ha, but 1,000 ha is already huge for Benin and it is easy to bypass the thresholds by dividing the purchase into several contracts. A ‘per purchase’ threshold does not prohibit in any way accumulation of ownership far exceeding 1,000 ha for a single body. Moreover, the experience of authorisation thresholds, which exist elsewhere in Africa, shows that they more frequently result in political control over major acquisitions than in real regulation linked to the quality of productive projects. There is currently no definition of the criteria for judging this point and ANDF does not have the necessary skills to do so. Finally, the prohibition on the purchase of land by non-Beninese, which is a problem for border residents and migrant farmers, is also symbolic here, because it is sufficient to have a joint venture with a Benin shareholder or to create a subsidiary under Benin law to circumvent it. The Code also takes from the 2007 law the measures of forced rental in the case of unused land, but their practical feasibility is questionable.
1 The Issue of Inclusion
Providing that ANDF is able to deliver quickly reliable land titles and to manage them soundly, the main issue of the reform is inclusiveness. Real efforts are being made to reduce the fees of the titling process. ANDF’s services and various taxes should not cost more than CFA Franc 100,000 (€150). However, the overall reduction in the cost for citizens is doubly limited: first, surveyors freely fix the cost of demarcation, which is one of the major costs of the procedure, and frequently exceeds CFA Franc 300,000 (€450). Second, the registration procedure requires several steps (purchase, having a certificate, etc.) and the full cost for users includes the cost of those steps, as well as other indirect expenses (travel to the office, etc.). Introducing notaries as a mandatory step for transfers adds significant costs upstream. The total cost continues to be high regarding the value of plots in towns outside major urban centres and may be even more in rural areas.
Standard land registration and land title have historically been designed to be in the service of colonial officers and their allies, and then of national elites after independence, and are by no means meant to be in the service of the entire population. The possibility of really lowering the costs is limited as long as that still is the reference. The problem is considerable for the urban poor or small middle class. It is crucial for rural dwellers. Therefore, the ability of the reform to make title largely accessible to the population risks being hampered, to a level that is still difficult to predict.
2 The Issue of Cadastre
Created by the Land Code, the cadastre is supposed to provide information also on untitled plots of land, thus avoiding the problems linked to the fact that legal dualism is maintained. Multifunctional, it has technical, fiscal, and legal roles. It is supposed to cover the entire territory. By assigning a unique number to any plot of land in the country, whether or not it is the subject of a land title, the cadastre is intended to avoid ambiguities about presumed owners and facilitate the transition to title of unregistered plots.
The first step, which is in progress, is to digitise information on existing titles and geo-localise them. The second step is to gather and compile existing land information wherever there has been work to map plots and identify the rights holders, such as subdivisions, PFRs, and urban land registers. The question here is the reliability of the information, and especially its accuracy when the documentation is old or incomplete: there is a very high risk of creating an obsolete database from the outset, putting wrong names in the software. The third step concerns the creation of land information on areas on which there is currently no information, which form the vast majority of the national territory. The approach was tested in early 2019 by ANDF and the Dutch-funded Projet de Modernisation de l’Administration Foncière (PMAF) project. The PFR methodology, which combines the identification of plot boundaries and the investigation of rights held, could provide most of the necessary tools. Identification of the presumed owners may be trickier, as the difficulty in transforming housing permits into land titles has shown. In rural areas, developing the cadastre will face the same difficulties as PFRs for areas that are not individually owned (land reserves controlled by customary authorities, lineage heritages, etc.) and for plots where rights are not quasi-ownership. Even more than PFRs, the future cadastre will reduce overlapping rights into a single registered property right and exclude other rights holders since there is no provision for registering them. It will not be able to avoid the risk of generating conflicts and spoliations.
In addition, the real problem of any cadastral system is updating it. When it is not possible to ensure the registration of changes, a land information system quickly becomes obsolete. Registering millions of plots of land in a few years is a challenge that only two authoritarian countries (Rwanda and Ethiopia) have succeeded with in Africa. Success in ensuring updating is another question: in Rwanda, in some municipalities, the rate of unregistered transfers is very significant (Ali et al., Reference Ali, Deininger, Mahofa and Nyakulama2021). The ability of the future cadastre to register changes is all the more uncertain since the registered land will not have legal status.
Assuming that the obligation to title a plot of land before it is sold can be guaranteed and that every sale is recorded (which is not evident, as we have seen), the legal cadastre will slowly expand and update with the rhythm of sales (and recorded inheritances). But a large part of the territory, where the land is transmitted by inheritance, will remain for several decades outside the updating mechanisms and therefore with obsolete land information, which raises questions about the opportunity of systematic mapping, at least for a significant part of the countryside.
The future of the land cadastre therefore depends first on Benin’s ability to mobilise the necessary resources to implement it, and thus on the willingness of donors to provide the corresponding resources. But it depends even more on the ability to ensure that information on ‘presumed owners’ – with or without presumed ownership documents – is accurate and updated, which could be problematic where sound information does not exist and where there are few or no incentives for citizens.
3 The Issue of the Transition: Length and Management
The reform strategy initiated in 2004–2005 was both proactive and extremely ambitious. It was designed based on both a quite technocratic vision of change and an overly optimistic timetable. This desire for a rapid changeover was also reflected in the 2013 Code, which provided for a transitional phase of five years before all the measures would be in force, and in particular that any sale would be carried out in an authentic form or recorded in the minutes of a notary. This corresponded to the logic of the replacement paradigm, which promotes a rapid switch from ‘informal’ rights to generalised formal ownership and aims to prevent the persistence of intermediate situations and devices, on the margins of the law. However, the time needed to implement the measures provided for in the Code and necessary for such a switch is in contradiction with this five-year transition phase. Besides the creation and deployment of ANDF, the full deployment of the new institutional framework requires having surveyors and notaries available in every region: in 2013, there were only thirty-five notaries in Benin, all or almost all of them based in the south of the country. The state opened new offices in the regions, but these remain largely insufficient. Consequently, the compulsory registration of any sale by an authentic instrument or by an agreement recorded in the minutes of a notary will remain difficult to achieve in a significant part of the country for several years. The 2017 revision extended the deadline to ten years (art. 516) – that is, 2023 – which was still a very short timescale.
The Code opened up the possibility of defining transitional arrangements, but this was not taken up, which caused institutional uncertainty, particularly on the issue of sales of plots of land: were sales agreements signed by communes forbidden from the Code’s promulgation or only after the five-year transition? The shortcomings in thinking about the temporality of the reform (and more generally the temporality of institutional change) are also reflected in ANDF’s aborted desire to suspend topographical operations until the cadastral software is ready, as if land dynamics could be stopped until the new system is set up. Since the transition inherent in such a reform can probably not last for less than 15 or 25 years, it seems important to think of it as such, by dealing with intermediate situations, which are inevitable. Failing to do so leads to the risk of leaving a legal and institutional fog, and the risk of seeing new unregulated, adaptative semi-formal solutions redeployed during this time.
V Conclusion
Land tenure is at the heart of societies and the relationships between states, social networks, and citizens. The way in which a society defines property rights and ensures their security has a deep connection to the way in which social relations are thought of, whether inequalities (of status, wealth, and power) are considered acceptable or opposed, and the way in which people see the state and its role. Any land reform project necessarily has simultaneous, intricate political, economic, and societal stakes (Léonard and Lavigne Delville, Reference Léonard, Lavigne Delville, Colin, Lavigne Delville and Léonard2022). It also necessarily crystallises multiple issues at very different levels.
In Benin, negotiating the reform, in its orientations and modalities, has been a complex process, involving multiple actors: institutional, private, and customary, but also international experts and donors. It first gave rise to a battle on the very vision of what the reform had to be, and behind that on divergent conceptions of society, law, and property. It also confronted visions, institutional logics, and interests all along its history and the current state of reform is the unplanned product of power, compromise, and bricolage. In this process, donors have been instrumental, in funding but also in providing ideas, models, and expertise, the succession of priorities corresponding to different donors. However, the opposition between adaptation and replacement paradigms has to be analysed in terms of concurrent policy networks, each one with national and international state agents and experts, and not in terms of opposition between the national state and external actors.
Benin land reform has the real merit of confronting long-standing institutional deficiencies and consolidated interests. It has deeply transformed the legal and institutional framework for land management, with the creation of ANDF and its decentralised offices, which now have many more staff and resources than the former land administration and have opened some institutional locks. It has set up an efficient geodetic infrastructure, making it possible to link topographical surveys to a single reference frame. It has digitised existing land documentation, corrected spatial referencing errors, centralised information, and made it accessible. The time and cost of issuing a land title have been reduced. Transparency and rigorous management are highlighted and have to be confirmed in the field.
However, framing issues in terms of classic titling is not the same as framing them in terms of securing people’s property rights. It must be noted that the quantitative data available for the 2000s confirm neither that informality is the main source of conflicts, nor that having a land title allows one to have credit, which are the two main assumptions of the reform (see Section II.B.4). This should not be surprising given the huge amount of economic research challenging these ideas (see, e.g. Binswanger et al., Reference Binswanger, Deininger, Feder, Behrman and Srinivasan1995; Platteau, Reference Platteau1996; Bromley, Reference Bromley2009 for rural, and Durand-Lasserve and Selod, Reference Durand-Lasserve, Selod, Lall, Freire, Yuen, Rajack and Helluin2009 for urban areas). Our broader institutional analysis showed that the blockages identified and addressed by the reform are more related to what the ‘Institutions and Economic Development’ research framework calls the ‘causes of proximity’ than to the ‘underlying factors’ (see Table 7.1).
Standard land titling is based on a colonial model of ‘creating ownership from the top’ (Comby, Reference Comby and Lavigne Delville1998a). It is very different from the logic of the state recognising property rights that have been constructed ‘from the bottom up’, which has historically been the experience in Europe (Stamm, Reference Stamm2013). Benin’s land reform is above all a reform of land administration, which does not question the land title and its logic, which, as we have seen, was the case for promoters of rural reform and some experts working on urban issues. Refusing to recognise the role played by existing intermediate solutions, and thus failing to build a plural system offering a range of legal solutions, Benin’s land reform reproduces in practice the legal dualism that previously left a large part of the population in the ‘informal’ or semi-formal category, which it had claimed it wanted to fight. It has been obliged to create new and sometimes ill-defined intermediate documents. It will also probably give rise to new intermediate, semi-palliative, semi-instrumental practices of the type the reform sought to combat, either for areas where the transition to title is complex or poorly justified, or after the title has been issued, due to the cost of registering transfers for poor households.
Despite the current government’s clear commitment, access to land title has been facilitated but will remain low for a long time. The risk is that this excludes an important part of the population, and thus maintains and even recreates informality. Holders of existing housing permits or sales contracts that are no longer recognised are even more in an informal situation than before, and rural buyers who are not able to fulfil the requirement of titling before selling a plot are not fully protected from spoliation during the titling process. The risk is therefore that the reform will serve above all to extend access to land ownership for an expanded but still small minority of quite wealthy actors who are able to mobilise the law and to take advantage of faster procedures (particularly urban dwellers buying land in rural areas).
Another strategy was possible, which would have started more from the situation ‘in the field’, problems, and people’s resources, and from an analysis of the role played by semi-formal mechanisms, in order to reduce contradictions and ensure greater land security in line with pro-poor approaches (Zevenbergen et al., Reference Zevenbergen, Augustinus, Antonio and Bennett2013). While also making land title more accessible and reliable for those who really need it – and in particular those who need mortgage credit – such a strategy would have focused mainly on the concrete needs of all citizens as regards securing their diverse rights over land. It would have offered them a range of institutional solutions, from which they would choose depending on the context and their own situation. Such institutional solutions would be based on the will to protect existing rights against spoliation, to favour acquisitive prescriptions to solve old cases, and to secure the negotiation and formalisation of land sales, even for untitled plots of land. In such a strategy, all transfers – except for local sales in rural areas – would be included in the land cadastre, which would focus on plots of land with legal status and would gradually expand. In this perspective, sales and inheritance contracts, drafted and formalised according to strict procedures, with a notary for urban areas and in the field with the Village Land Committee and Land Office agents for rural areas, would be the basis of ownership, including when they concern untitled land. Sale or inheritance contracts would assess the seller’s right to sell and specify the origin of the rights held and the content of the rights transferred, including various easements linked to other rights holders or local rules. Family land could not be sold without a family council record explicitly authorising the sale and specifying the distribution of its proceeds among rights holders and validated by the Village Land Committee for rural areas. Actors who do not have such documents and need to secure themselves legally could request an attestation of customary possession, which would rely on a cross-checked field survey. The plots sold or plots having an attestation would be surveyed by local surveyors using GPS of a sufficient (but not centimetre) precision and data would be integrated into the national cadastre, which would gather information on land titles as well as on sales, transfers, and ADCs on untitled plots of land. A PFR-like systematic survey would be carried out where the stakes are high, in peri-urban areas where the land market is developing, leading to certificates. The integration of plots into the cadastre would be a progressive process, along with social and economic evolution and people’s needs.
Altogether, the Benin land reform, its achievements and limits, and the fierce debate that took place during those years contribute to the general debate on land reform strategies. The reform raises questions about the potential and limits of improvement strategies that do not question the global model of land title. It contributes to a rethinking of the relevance of adaptative strategies, which organise over time the transition from an existing and dynamic situation that is problematic in specific contexts to better land governance that focuses primarily on the security of land tenure of citizens and economic actors, starting from their real situations. History will show whether and to what extent the actors in charge of the reform’s implementation will integrate pragmatic adaptations to the challenges they face, and to what extent they will be able to face the issue of social inclusion.
Afterword on Land Reforms
This text was first written in mid-2019. Since, the issue of inclusion and that of the land register have evolved. The slow delivery of titles by the ANDF and the blockages linked to the prohibition on communes’ legalisation of sales on untitled land revealed the limits of the model. ANDF issues only a few thousand new titles each year. As experts from ANDF and PMAF now recognise, it is not possible to register a significant part of the territory before the end of the transition period in 2023 (Mekking et al., Reference Mekking, Kougblenou, Vranken, Kossou and Van den Berg2020, p. 4). The reflection and experimentation around the cadastre have legitimised the search for alternative solutions integrating issues of rapid expansion and inclusivity, with a new cost–quality balance (Mekking et al., Reference Mekking, Kougblenou, Vranken, Kossou and Van den Berg2020, Reference Mekking, Kougblenou and Kossou2021). The cadastre development approach proposed by PMAF is connected to the concept of a ‘fit for purpose’ cadastre promoted by Dutch surveyors and presented as new, even if it built on the PFR methodology. It aims at rapidly expanding the registration of presumed individual or family ownership rights by field surveys on legitimate rights and plot demarcation, with only metre precision. Social intermediation prepares the survey, landowners themselves place markers on the boundaries of their plots, and surveyors are mobilised to check the maps and not for plot demarcation. Reflection is going on around the possibility of introducing a deed-based system along with the existing title-based system (Mekking et al., Reference Mekking, Kougblenou, Vranken, Kossou and Van den Berg2020, p. 7) or creating certificates of presumed rights registration that could easily be transformed into titles. Expanding the transition period and recognising a role for communes in validating land sales where there are no notaries is also in debate. Confrontation with the limits of the model seems to have opened new opportunities for building sound intermediate solutions that, for one part, had already been proposed and that, until recently, ANDF refused to consider. It could represent a new bifurcation in the reform and offer answers to at least part of its shortcomings, a kind of ex post revenge of the adaptation paradigm, imposed by reality. However, the focus is still on private ownership, and the issue of updating is far from being solved. It remains to be seen if and how far these propositions will be institutionalised, for example in the new revision of the Code, currently under discussion.
I Setting the Scene
As a resource, land produces a range of services for human development, such as food production, housing, and ecosystem services through forested areas. While statistics related to homelessness are scarce for Benin, the most recent statistics of the United Nations Food and Agriculture Organization (FAO) estimate that agriculture and forest represented respectively 33 per cent and 38 per cent of the land area of the country in 2016. However, in terms of contribution to food security, employment, income generation, and the creation of goods and services, agricultural activities play a central role in the social and economic life of the country. According to the most recent statistics, the share of the employed population working in agriculture in 2018 was estimated at 41 per cent, and contributed to producing 23 per cent of the value generated by economic activities (World Bank, 2018).
Despite this position and the positive economic performance in recent years, the agricultural performance in Benin is still very much lagging behind in international comparisons (Food and Agriculture Organization Corporate Statistical Databasem FAOSTAT, www.fao.org/faostat/en/#home). While the rest of the world experienced gradual and substantial productivity gains through the entire period, despite steady growth since the 1990s land productivity remains low in Benin. Moreover, even though the country has privileged access to trade routes and imports food from abroad, the latest report on the state of food security and nutrition in the world ranks Benin among low-income, food-insecure countries. This underlines the fact that agricultural output is not sufficient to meet local demand for food and the country lacks the resources to fill the gap by purchasing food on the international market. In that context, it is estimated that the population is affected by multiple forms of malnutrition – including a high prevalence rate of anaemia among women and child stunting – and that one out of ten persons (i.e. 1.1 million persons) was undernourished in Benin between 2015 and 2017. Agricultural production is also particularly vulnerable to climate change and this situation raises concerns regarding the future prospects of food security in Benin (see FAO et al., 2018).
This chapter on land reforms provides a thorough and in-depth analysis of the political forces that shaped the orientations of successive land reforms in Benin. In this discussion, we propose to analyse the land reforms in Benin through their impacts on the social and economic lives of individuals. To pursue that goal, we provide a bird’s-eye view of the theoretical and observed effects of the land reforms implemented and offer remarks on some of the challenges and opportunities ahead to promote sustainable improvement of the social and economic lives of individuals in Benin.
II Land Reforms in Benin: Theoretical Expectations
A property right refers to socially recognised structures of allowable individual actions. It determines how a resource is used for consumption and/or income generation (see, e.g. Besley and Ghatak, Reference Besley, Ghatak, Rodrik and Rosenzweig2010). Hence, a system of property rights provides the incentives and devises the constraints that shape human interaction, whether political, social, or economic (North, Reference North1990).
There is a well-established theoretical literature that shows that the enforcement of private property rights, which makes it possible to legally exclude others from using a good or asset, within an effective legal framework should in theory increase productivity and spur economic development (Besley and Ghatak, Reference Besley, Ghatak, Rodrik and Rosenzweig2010). The literature proposes three channels through which productivity gains arise in these contexts. First, the codification and enforcement of private property rights reduce expropriation risks and promote long-term investments. Second, enforceable property rights should lower transaction costs and allow productive farmers to negotiate land use rights from less productive farmers, thus making both parties better off. Third, a clear definition of property rights reduces information asymmetry about ownership rights and can allow individuals to use their property as collateral for loans. Nevertheless, to be effective, the ability to use land as collateral requires a number of conditions, including the presence of a properly functioning credit market.
Theoretical predictions of the effects of the enforcement of private property rights on productivity suggest that places where property rights are clearly defined and enforced should be more productive. However, most agricultural land in Benin is held under customary rules, where the allocation and enforcement of land rights involve a diverse and complex set of arrangements made and upheld by local stakeholders, such as village chiefs, councils of elders, and land chiefs (Le Bris et al., Reference Le Bris, Le Roy and Leimdorfer1982). Therefore, private property rights, as conceptually defined in theory, do not match local practices of land rights management.
Yet, there are good reasons to consider that land tenure insecurity represents a challenge for investment and living conditions in Benin. First, using detailed information on agricultural practices on plots, Lawin and Tamini (Reference Lawin and Tamini2019) find evidence suggesting that land tenure arrangements significantly influence farmers’ decisions to invest in practices that improve agricultural productivity while preserving the environment. Second, there is evidence that under customary land management, land tenure insecurity prevents farmers from leaving their land fallow, a low-cost soil fertility management investment practice that improves agricultural practices (Goldstein et al., Reference Goldstein, Houngbedji, Kondylis, O’Sullivan and Selod2018). Third, available statistics estimate that 34 per cent of the population in Benin felt insecure about their tenure rights over the home they owned or rented in 2018 (Prindex, 2019).Footnote 27 Though home tenure insecurity appeared to be evenly distributed across urban and rural areas, it varied geographically and was highest for vulnerable groups, such as women and renters.
To reduce land tenure insecurity, in a context where allocation and enforcement of land rights have historically been vested in customary practices, policy makers in Benin approved the Rural Landholding Law of 2007, which provided formal recognition of land held under customary arrangements. A new land law was then adopted in 2013 to improve the definition of property rights. This established ANDF, a national agency with responsibility for the implementation of land policies.
While little is known about the effects of the implementation of the 2013 land law, more can be learned from studying the effects of the implementation of the Rural Landholding Law of 2007. In practice, the Rural Land Law allowed willing villages to produce Rural Land Use Plans, or PFRs, which embed the resolution of land disputes, the demarcation of plots, and the recognition of individual land rights within customary practices, and which provide documentary evidence of those rights. PFRs are a community-driven approach that seeks to provide legal recognition of land rights held under customary tenure systems (see, e.g. Colin et al., Reference Colin, Le Meur and Léonard2009; Cotula et al., Reference Cotula, Toulmin and Hesse2004; Lavigne Delville, Reference Lavigne Delville2014). The approach systematically demarcates several plots at once, making it an affordable policy option. However, the impacts of the PFRs are theoretically unclear, since customary land rights that are formalised are not necessarily private and still remain (partly) vested in customary practices.
III Empirical Effects of the Plan Foncier Rural in Benin
To our knowledge, available empirical studies of the effects of Benin’s PFRs include a study of changes in land security for landowners and access to land for tenants (Yemadje et al., Reference Yemadje, Crane, Mongbo, Saïdou, Azontonde, Kossou and Kuyper2014), variation of agricultural investment decisions (Goldstein et al., Reference Goldstein, Houngbedji, Kondylis, O’Sullivan and Selod2018), and changes in individual levels of cooperation and trust (Fabbri, Reference Fabbri2021) as a result of land registration activities.
In the oil palm-based cropping system on the Adja Plateau, Yemadje et al. (Reference Yemadje, Crane, Mongbo, Saïdou, Azontonde, Kossou and Kuyper2014) report that following the land registration activities carried out as part of the PFRs, land conflicts have decreased and there was a shift towards agricultural intensification. Tenants and landowners increasingly invested in land through rotations between maize and cowpea (rather than maize mono-cropping) and the use of mineral fertilisers, without increased use of household waste. The paper suggests also that as a result of the PFRs there was a shift from oral to written land rental contracts, from unwitnessed to witnessed contracts, and from contracts backed up by local chiefs under customary rules to contracts backed up by the state in a legal system.
Covering a larger study area that spreads across forty of the seventy-seven communes in Benin, Goldstein et al. (Reference Goldstein, Houngbedji, Kondylis, O’Sullivan and Selod2018) compare the agricultural decisions of rural households in villages that were randomly selected to receive a PFR intervention to otherwise comparable households in villages that were not selected. The authors find that following land demarcation agricultural households were on average more likely to have their plots demarcated. In line with theoretical predictions, households in villages that implemented a PFR were also on average more likely to shift their investment decisions to long-term and perennial cash crops. There was also evidence that, on average, the PFRs helped to reduce the gender gap in fallowing, a key soil fertility investment.
The results reported by Yemadje et al. (Reference Yemadje, Crane, Mongbo, Saïdou, Azontonde, Kossou and Kuyper2014) and Goldstein et al. (Reference Goldstein, Houngbedji, Kondylis, O’Sullivan and Selod2018) are in line with the effects reported for similar interventions in other countries of sub-Saharan Africa. In Ethiopia, Deininger et al. (Reference Deininger, Ali and Alemu2011) find that the registration of land rights in Amhara significantly reduced fear of land loss, and increased the propensity to rent out land and the propensity to invest in soil and water conservation measures by 20 percentage points. Studying the effects of Rwanda’s large-scale land tenure regularisation programme, Ali et al. (Reference Ali, Deininger and Goldstein2014) find that the land tenure regularisation increased soil conservation investments among male-headed households by approximately 10 percentage points, and that the impact for female-headed households – at 19 percentage points – was nearly twice as large.
The long-term impacts of the registration of customary land rights on agricultural productivity and food security in Benin remain an area of active research. However, outside Benin, Holden et al. (Reference Holden, Deininger and Ghebru2009) find that, up to eight years after the rural land registration in the Tigray Region in Ethiopia, plot productivity increased. In Vietnam, Newman et al. (Reference Newman, Tarp and van den Broeck2015) studied the effect of the land use certificate (LUC) on rice production and find that ‘plots that move from not having a LUC to having a LUC experience gains in rice yields of 4.9%’ (Newman et al., Reference Newman, Tarp and van den Broeck2015, p. 99).
IV Concluding Remarks
Theoretical and empirical results suggest that land tenure arrangements matter for agricultural practices. Empirical studies of the PFRs provide evidence that the land registration activities have on average increased agricultural investment and have encouraged the adoption of soil fertility management techniques in parts of Benin. While detailed studies of the long-term impacts of the PFRs on land productivity in Benin remain to be carried out, it seems unlikely that the formalisation of land rights alone will boost agricultural productivity to the level observed in the rest of the world. To sustain investment in agriculture and maximise the chances of improving food security in Benin, a systemic approach is needed to connect farming to local demand for food while reducing externalities on the environment.
While the evidence suggests that the formalisation of land rights in rural areas can be instrumental in increasing land tenure security, it raises a number of concerns about the distributional effects of land registration under customary settings. As pointed out by Yemadje et al. (Reference Yemadje, Crane, Mongbo, Saïdou, Azontonde, Kossou and Kuyper2014), land registration of customary rights does not exist in a vacuum. Land registration activities take place in contexts marked by spatially heterogeneous land tenure management systems, and the issuance of formal documentary evidence of land rights changes expectations and coordination between individuals. For instance, the issuance of land certificates can skew land tenure security towards holders of land certificates. This can reduce tenure security for other individuals who may have claims to the same piece of land and to different dimensions of use of that land (Lavigne Delville, Reference Lavigne Delville2014; Udry, Reference Udry, Aryeetey, Devarajan, Kanbur and Kasekende2012). This is particularly a salient concern for women, who typically obtain land use rights via a male intermediary. Alternatively, land registration activities can embed conflict resolution mechanisms and can help uphold the land rights of vulnerable groups, as protected by the legal system. In this way there are also reasons to expect that land registration activities act as a magnet that helps customary and legal practices coevolve and converge (Aldashev et al., Reference Aldashev, Chaara, Platteau and Wahhaj2012).
Overall, given, on the one hand, the role that access to land plays in social recognition, access to housing, and the economic lives of individuals, and, on the other hand, the spatial variation of existing customary practices, land registration activities are expected to produce an array of impacts depending on the constraints that are locally relaxed and/or exacerbated. It therefore seems worth considering various approaches to land registration activities depending on local context.
I Introduction
Benin’s approximately 800 km north–south border with Nigeria plays a critical role in Benin’s economy. Nigeria’s population of around 190 million is nearly twenty times larger than Benin’s and the differential in gross domestic product (GDP) is even larger, with Nigeria’s output equal to nearly forty times Benin’s, reflecting Nigeria’s oil wealth rather than a higher standard of living. Thus, the economic relationship between the two countries is necessarily asymmetrical, with Nigeria’s influence on Benin much more powerful than vice versa. Moreover, Nigeria’s combination of massive oil wealth, interventionist economic policies, and high levels of corruption has led to pervasive distortions and inefficiencies.
It is in this context, during the first oil shock in 1973, that Benin adopted a development policy centred on serving as an ‘entrepôt state’ vis-à-vis its neighbours, particularly Nigeria (Igué and Soulé, Reference Igué and Soulé1992). That is, Benin aimed to expand its role as a trading hub, importing goods and re-exporting them to Nigeria, thus profiting from the distortions in Nigeria’s economy. Heilbrunn (Reference Heilbrunn and Wright1999) aptly described Benin as the ‘Flea on Nigeria’s Back’.
Benin’s dependence on Nigeria is not apparent from official trade statistics, with Benin’s reported trade with Nigeria accounting for only about 6 per cent of Benin’s exports and 2 per cent of Benin’s imports in 2015–2017.Footnote 1 These official statistics are very misleading, however, as they ignore the huge unrecorded informal trade between the two countries (Benjamin et al., Reference Benjamin, Golub and Mbaye2015). As we discuss in detail in this chapter, Benin imports very large quantities of consumer goods that are subject to high import protection in Nigeria and then transships them to Nigeria through elaborate institutional mechanisms. Conversely, Benin illegally imports a large proportion of its petroleum products from Nigeria, where consumer prices are highly subsidised. This two-way informal cross-border trade (ICBT) has in the past accounted for a large share of Benin’s income, employment, and fiscal revenues. Recently, however, the volume of this trade has dropped considerably due to a recession in Nigeria, revealing its fragile foundations. This chapter will analyse the nature, institutional foundations, and consequences of ICBT between the two countries, and it will draw out policy implications.
ICBT is pervasive in sub-Saharan Africa, reflecting a confluence of historical and institutional factors: artificial national borders established in the colonial era and maintained after independence; porous borders between contiguous nations; a long history of regional trade pre-dating the colonial era; kinship groups that transcend national borders; weak border enforcement capabilities; corruption of high- and low-level officials who profit from collusion with traders; and, perhaps most importantly, lack of coordination of economic policies among countries sharing these borders (Golub, Reference Golub, Morrissey, López and Sharma2015). We will show how these factors play out in a particularly dramatic way in Benin.
An interesting dimension of regional ICBT is the intense competition between Benin and Togo for informal access to the Nigerian market. Togo is less well situated geographically than Benin for transshipping to Nigeria, since goods coming from Togo must go through Benin or Niger, but Togo compensates in part through lower taxes and fees (Golub, Reference Golub2012). Although land-locked, Niger is also heavily involved in smuggling to Nigeria (Hashim and Meagher, Reference Hashim and Meagher1999); so too is Cameroon, though to a lesser extent (Golub and Kobou, Reference Golub, Kobou, Mbaye, Golub and Gueye2019).
Benin has developed elaborate institutional mechanisms to support ICBT, notably through specific customs procedures. In some respects these mechanisms are quite efficacious, belying the notion that institutions in Benin are dysfunctional. At the same time, however, the national priority placed on promoting unofficial trade is not a viable long-run strategy for development. The recent downturn in the re-export trade starkly reveals Benin’s vulnerability to shocks in Nigeria. Even more so than for other countries of the region, Benin’s economy is dominated by the informal sector, which provides a dubious foundation for sustainable long-term development (Benjamin and Mbaye, Reference Benjamin and Mbaye2012; Mbaye et al., Reference Mbaye, Golub and Gueye2019).
Despite the vulnerability to shocks in Nigeria and the questionable sustainability of informal trade, Benin’s heavy dependence on this trade for government revenues and the numerous beneficiaries among both formal and informal operators explain the government’s reluctance to crack down on smuggling. Furthermore, even if the government were determined to shut down informal trade with Nigeria, it would be difficult to do so as long as the underlying incentives created by Nigeria’s distortions remain. Large price differences between adjacent countries with porous borders are an invitation to smuggling that ingenious traders are bound to exploit. Thus, rather than focus on eradicating ICBT, the government should pursue policies to diversify Benin’s economy to reduce its vulnerability to Nigeria’s instability.
In this chapter, we focus on two of the main dimensions of Benin’s ICBT with Nigeria: imports of goods subject to heavy protection in Nigeria, particularly used cars and rice, which are then re-exported to Nigeria; and Benin’s imports of petroleum products, which are highly subsidised in Nigeria. The remainder of the chapter is organised as follows. Section II provides historical background. Section III discusses the effect of divergent economic policies as a key driver of informal trade between Benin and Nigeria, particularly Nigeria’s high import protection and fuel subsidies. Section IV provides evidence on the magnitude of informal trade. Section V describes the institutional processes governing informal trade, particularly the role of customs administration, with illustrations in the cases of used cars, rice, and petroleum products. Section VI analyses the effects of informal trade on Benin’s economy, particularly fiscal revenues. Section VII concludes.
II Historical Economic Relations Between Benin and Nigeria
Benin and Nigeria have deep historical economic ties, reflecting their geographical and cultural proximity. The two countries share several languages and ethnicities. Trade within the region pre-dates the colonial period, was altered by colonial economic and political relations, and further adapted to post-colonial political and social developments, most importantly divergent trade and other economic policies.
Yoruba, Hausa, and Ibo trading networks operated prior to the colonial era, but expanded in response to the arrival of European traders in the seventeenth century (Igué and Soulé, Reference Igué and Soulé1992; Hashim and Meagher, Reference Hashim and Meagher1999). Long-distance caravan trade routes linking coastal West Africa with the Sahara and the interior were based on artisanal and ecological comparative advantages, but even in pre-colonial times trade patterns of taxation and tolls impinged on trading routes. The kingdom of Dahomey, corresponding geographically to a southern part of contemporary Benin, had highly developed institutions that facilitated economic ties with Europe, notably the slave trade centred around the town of Ouidah. English, Portuguese, Dutch, and French ships arrived in Ouidah loaded with tobacco, liquor, guns, and miscellaneous items of cheap junk much prized by the local population, which were exchanged for large numbers of slaves. The slave trade was a major source of revenue for the kings of Abomey, who designated a special representative (‘Yovogan’ or ‘chief of whites’) to administer the trading relationships between leading local merchants with European slave traders (Igué and Soulé, Reference Igué and Soulé1992).
In the second half of the nineteenth century, as the slave trade collapsed, traders switched from slaves to palm oil, transacting with French trading firms from Marseille, which created trading posts in Dahomey exporting palm nuts and oil in exchange for tobacco, guns, cloth, and vegetables.
The official colonisation of Dahomey in 1894 by the French altered trading relationships for several reasons. The French colonial government granted a monopoly to French trading companies, spurring the creation of unofficial networks by displaced local businesspeople. The geographical situation of the new colony of Dahomey, sandwiched between German-controlled Togo and English-controlled Nigeria, provided a corridor for French trade with its land-locked colonies, Niger and Upper Volta (now Burkina Faso), creating a precursor to Benin’s role as an entrepôt. Furthermore, Dahomey’s relatively advanced educational system reinforced its advantage as a commercial hub. The Yoruba group’s spread provided a network across the region along the Gulf of Guinea.
The colonial borders between Dahomey and Nigeria were largely retained as national frontiers when the countries gained independence in the 1960s. These borders artificially separated people sharing similar cultural backgrounds, who largely disregarded official borders in their social relations. As Isyaku (Reference Isyaku2017, pp. 210–13) describes it:
The traditional rulers have always refused to accept this situation [partition …] The socio-cultural relationship between the two states is further fostered by the fact that Yoruba groups occupying the contiguous localities claimed a common origin from Ile-Ife, spoke […] dialects of the same language and possessed similar political, social and religious institutions. Economic links, particularly commercial routes and markets, contribute to this cultural uniformity.
In the post-colonial period, kinship groups continued to play a major role in organising informal trade between Benin and Nigeria, notably the Yoruba (Igué and Soulé, Reference Igué and Soulé1992; Igué, Reference Igué2003; Golub and Hansen-Lewis, Reference Golub, Hansen-Lewis, Benjamin and Mbaye2012). Along the northern frontier between the two countries, the Hausa are dominant. Adherence to Islam is a source of solidarity and motivation for both the Hausa and the Yoruba, providing security for transactions, mutual assistance, and credit, all based on trust rather than formal contracts (Sudarkasa, Reference Sudarkasa and Lindsay1985). In recent years, however, there have been numerous clashes between Yoruba and Hausa traders over control of markets (Porter et al., Reference Porter, Lyon, Adamu and Obafemi2010).
Informal trade was boosted by the instability in Nigeria following the Biafra war in 1967, with an influx of Ibo refugee traders into Benin, and Benin supplying goods to sections of Nigeria cut off from supplies. During the war, Benin became a major cocoa exporter, despite non-existent production of this product, as Nigerian cocoa was diverted through Benin.
Starting in 1973, Benin adopted low-tariff policies to facilitate the entrepôt role of Cotonou to take advantage of the oil boom in Nigeria following the first oil shock. Benin also took steps to expand access to credit to importers by opening up the banking system, and deregulated the importation of key products, such as rice, formerly monopolised by state-owned firms. The Marxist government of Benin deployed the nationalised banking system in favour of the re-export trade. These credits were limited to Beninese nationals, with defaults on these loans contributing to the banking crisis of the late 1980s (Hashim and Meagher, Reference Hashim and Meagher1999). During the 1980s and 1990s, Benin took several further steps to liberalise its imports. Customs duties were waived on the two main items re-exported to Nigeria at that time: rice and cloth. In 1985, the state monopoly on imports was eliminated. In 1993, all remaining quantitative restrictions on imports were removed. In 1994, a simplified system of customs duties with a maximum rate of 20 per cent was established, with rice and cloth still exempt (IMF, 1996).
The West African Economic and Monetary Union (WAEMU), a group of mostly francophone countries of which Benin is a member (and of which anglophone Nigeria is not), established a common external tariff (CET) in 2001 that lowered import duties for most member countries but raised them for Benin (and Togo), particularly for cloth, rice, and other important re-export goods (Soulé, Reference Soulé2000, Table 7.3). Nevertheless, the WAEMU duties remained well below those in Nigeria. Moreover, Benin has found ways of circumventing WAEMU import taxes by exercising customs valuation with consideration discretion, and most importantly making greater use of special customs regimes for transit and re-exports, through which it imports at very low tax rates. These customs regimes are described in detail in Section V.
Both Benin and Nigeria are members of the larger regional group the Economic Community of West African States (ECOWAS), which encompasses both the francophone and anglophone nations of West Africa. ECOWAS has progressed far less than WAEMU in regional integration. Some cooperative regional efforts have advanced, particularly in the political realm, but Nigeria is large enough that it has seen little need to coordinate with its much smaller neighbours, and it has sometimes obstructed or failed to implement ECOWAS harmonisation efforts (Hoffman and Melly, Reference Hoffman and Melly2015). After numerous delays, ECOWAS agreed to a CET in 2013. Although Nigeria is among the countries that have adopted the CET in principle, in practice it has not fully implemented this regime, or has availed itself of escape clause provisions that allow higher protection. Thus, a number of Nigerian imports face tariffs that exceed the ECOWAS maximum of 35 per cent, and there remains a list of items facing outright bans, as discussed later.
Nigeria has made repeated threats to eradicate smuggling, but with little lasting effect. The borders have sometimes been closed due to other political tensions between the two countries. From February 1984 to February 1986, Nigeria shut down the border with Benin in an effort to curb smuggling of petroleum products out of Nigeria. During this time, Nigeria closed down all service stations within 10 km of the border with Benin, in a futile attempt to curb smuggling. Heilbrunn (Reference Heilbrunn and Wright1999) observes that the effects of the border closures were short-lived at best and that the recession in Nigeria in 1985 had far larger effects on lowering ICBT than the ineffectual measures of the Nigerian authorities.
In 1996, President Abacha of Nigeria closed the border in a political dispute with Benin’s President Soglo, related to the latter’s military cooperation with the USA, which Abacha viewed as a threat. The resulting dislocations in Benin, notably gasoline shortages, contributed to Soglo’s loss in the 1996 presidential elections.
In August 2003, the border was closed for a week following a confrontation between the Nigerian and Beninese governments precipitated by the harbouring of a suspected Nigerian criminal in Cotonou.Footnote 2 Only when he was turned over to the Nigerian authorities following a meeting between Obasanjo and President Kerekou of Benin in Badagry, Nigeria, was the border re-opened. Following the meeting, the two presidents issued the ‘Memorandum of Badagry’, which committed the Benin and Nigerian governments to fostering formal trade relations while curtailing smuggling and criminality. In March 2008, Nigeria initiated a crackdown on imports of used cars, holding up car convoys at the usual crossing points such as Kraké and Igolo (Houngbo, Reference Houngbo2008). More recently, President Buhari has taken a number of measures to curb smuggling from Benin, notably prohibiting imports of rice and cars through land borders once again.
Notwithstanding these occasional border closings and frequent threats from Nigeria, the re-export trade has always recovered as the enforcement of border controls reverts to its normal laxity. A sharp downturn in informal trade in 2015–2017 for some products, notably used cars, has yet to be fully reversed. As discussed in what follows, this prolonged decline is likely due more to the recession in Nigeria dampening demand than to border closures. Regardless, these episodes reveal Benin’s acute vulnerability to economic shocks from Nigeria.
Officials from Benin and Nigeria have recently announced joint efforts to curb smuggling (Goudreau, Reference Goudreau2018). Further, the two governments have just opened a joint centre for customs control at the largest official border crossing between the countries – the Seme–Kraké corridor. As commentators have noted, however, most smuggling does not go through official border posts, so the utility of this initiative is questionable (AFP, 2018). More generally, the implementation of anti-smuggling measures is likely to remain ineffectual given the disparate interests of the countries involved, and, more importantly, given the beneficiaries of smuggling within them, as will be described.
III Causes of Informal Trade: Nigeria’s Pervasive Distortions Incentivise Smuggling
The most important underlying source of Benin’s informal trade is Nigeria’s dysfunctional economic policies, which provide incentives for traders to profit from circumventing them. It is beyond the scope of this chapter to analyse in detail the reasons for Nigeria’s corruption and mismanagement, but it surely reflects a combination of Nigeria’s size, ethnic fractionalisation, and oil wealth. Indeed, Nigeria has been one of the starkest examples of the ‘resource curse’, whereby natural resources such as oil contribute to inefficiencies and corruption (Venables, Reference Venables2016). Revenues from natural resources crowd out manufacturing and agriculture. Nigeria has attempted to maintain its industrial and agricultural base through import substitution, but this has largely fostered inefficiency and incentives for evasion. Worse, large resource rents can provide an irresistible political temptation to engage in the notorious wasteful spending and corruption that occur in Nigeria.
In effect, therefore, Nigeria’s resource curse and institutional weaknesses have been transmitted to Benin. The distortions in Nigeria fuelled by oil and corruption provide economic rents to smugglers in Benin, so much so that much of Benin’s institutions, both formal and informal, have evolved to capture these rents.
The dominance of the informal sector and the artificial nature of national borders in West Africa are also crucial underlying causes of the informalisation of trade. Throughout West Africa, and particularly in Benin, the informal sector represents approximately 50 per cent of GDP and 90 per cent of employment. The ascendency of the informal sector, including ICBT, is both the cause and effect of the weakness of the formal sector. With the economic crisis and subsequent structural adjustment programmes of the 1980s, government employment dropped sharply in Benin as in other sub-Saharan countries and formal private-sector employment failed to pick up the slack as the business environment remained poor (Golub and Hayat, Reference Golub, Hayat, Monga and Lin2015). The informal sector became the employer of last resort, particularly for young people newly entering the labour market, even those with substantial education (Benjamin and Mbaye, Reference Benjamin and Mbaye2012; Mbaye et al., Reference Mbaye, Golub and Gueye2019). Many of the informal gasoline transporters and retailers are young people with secondary education who are unable to obtain formal jobs. The booming informal sector in turn contributes to the hostile climate for formal business investment, creating a vicious cycle.
Moreover, contrary to common perceptions, the informal sector is in some respects better organised than the formal sector, with large informal firms often rivalling formal firms in size, and kinship groups linking together informal operators into networks that cross borders and even continents. The Yoruba and the Hausa are particularly important for Benin–Nigeria ICBT, as previously noted.
A Import Protection in Nigeria
Nigeria has long had some of the most restrictive import barriers in the world, including very high tariffs and import prohibitions, while Benin (and Togo) have deliberately maintained low import taxes to foster their roles as entrepôts for Nigeria (Igué and Soulé, Reference Igué and Soulé1992). Recent research has confirmed the importance of Nigeria’s import barriers in driving unofficial exports from Benin to Nigeria (Golub, Reference Golub2012; Raballand and Mjekiqi, Reference Raballand, Mjekiqi and Treichel2010; Bensassi et al., Reference Bensassi, Jarreau and Mitaritonna2018).
Table 8.1 displays Nigeria’s import restrictions on some of the key products of the re-export trade as they have evolved over time. Unlike Benin (and Togo), Nigeria has aggressively promoted domestic manufacturing and agricultural industries through import substitution, unfortunately usually resulting in highly inefficient production, with powerful interest groups favouring continued protection. While Nigeria has liberalised some sectors as part of the ECOWAS harmonisation efforts already noted, including reducing the number of goods that are subject to import bans, progress has often been reversed. For example, in 2015 Nigeria lifted its import ban on textile (cloth and clothing) imports, but then raised the import tariff to 45 per cent in 2016 and placed textiles on a list of goods that were ineligible to use the official foreign exchange market, in effect raising transactions costs via a de facto additional tax on imports to the extent that the unofficial exchange rate tends to be depreciated relative to the official rate.
Table 8.1 Nigeria’s import barriers on selected products, import tax rates (per cent) and import bans, 1995–2018
| 1995 | 2001 | 2007 | 2013 | 2018 | |
|---|---|---|---|---|---|
| Beer | Banned | 100 | Banned | Banned | Banned |
| Cloth and apparel | Banned | 55 | Banned | Banned | 45/Forex banFootnote ** |
| Poultry meat | Banned | 75 | Banned | Banned | Banned |
| Rice | 100 | 75 | 50 | 100 | 70Footnote *** |
| Sugar | 10 | 40 | 50 | 60 | 70 |
| Cigarettes | 90 | 80 | 50 | 50 | 95 |
| Used carsFootnote * | Banned | Banned | Banned | Banned | Banned/70 |
| Vegetable oil | Banned | 40 | Banned | Banned | Banned |
* The maximum age of cars banned from import has varied over time: it was more than eight years old in 1995, and was more than five years old in 2001; it then moved back to more than eight years old in 2007 and is now more than 15 years old. In addition, imports via land borders have been banned since 2016.
** Banned from using the official foreign exchange market.
*** Rice imports through land borders banned since 2013.
Import taxes on goods for domestic consumption have generally been lower in Benin than in Nigeria. With the advent of the ECOWAS CET in 2015, these differences have declined for many goods, but for goods for domestic consumption and others subject to special protection in Nigeria large gaps remain. Furthermore, import duties in Benin are largely irrelevant for unofficial trade to Nigeria, as products destined for diversion to Nigeria are mostly imported via special transit and re-export regimes with very low tax rates, rather than for domestic consumption, where normal duties and value-added taxes apply. In cases where Nigerian protection is particularly elevated, it can still be advantageous to import goods for domestic consumption and re-export to Nigeria, but clearly importing under transit and re-export status is even more attractive. The extent to which imports intended for Nigeria enter under a regime for transit rather than for domestic use varies considerably by product and over time, as we discuss further later.
B Macro-economic and Exchange Rate Policies in Nigeria
Macro-economic policies, particularly exchange rate policy, are another relevant factor driving cross-border trade, with Nigeria having a crawling peg to the US$ but an inconvertible exchange rate regime, while Benin is a member of the WAEMU Communauté Financière en Afrique (CFA) Franc single currency, formerly pegged to the French Franc and now to the Euro.
Nigeria’s economy is highly dependent on oil, and thus subject to shocks from fluctuations in world oil prices. The recent recession in Nigeria in 2015–2017, associated with a sharp downturn in world oil prices, provides a clear example of the spill-over effects of Nigerian macro-economic developments on Benin. The Buhari administration resisted devaluing the Nigerian Naira (NGN) despite severe balance of payments pressures. As a result, a shortage of foreign currency exacerbated the recession in Nigeria. Equally importantly, the black market exchange rate depreciated sharply while the official exchange rate remained fixed, as shown in Figure 8.1. With ICBT largely operating in the parallel foreign exchange market, the purchasing power of Nigerian consumers fell further as the black market exchange rate depreciated precipitously. At the end of 2014, Nigeria’s black market exchange rate was at less than a 10 per cent discount under the official exchange rate of about NGN 180 per US$. As the foreign exchange shortage worsened, in early 2016 the black market rate had depreciated to about NGN 350 per US$. A 30 per cent official devaluation in June 2016 temporarily eased pressures, but the situation soon deteriorated again after the official exchange rate was repegged at NGN 300 per US$. By February 2017, the black market exchange rate had tumbled again to about NGN 500 per US$. Since mid-2017 the black market discount has declined considerably due to the recovery of the price of oil and Nigeria’s balance of payments.

Figure 8.1 Nigeria’s official and black market exchange rates (NGN per US$)
The recession in Nigeria and the depreciation of the black market exchange rate were major causes of the sharp downturn in Benin’s ICBT in 2016–2017, as described in Section III.C.
C Subsidised Fuel Prices
The main underlying source of the pervasive informal trade in petroleum products is differential official pricing mechanisms between Nigeria and its francophone neighbours. Nigeria has long delinked domestic and world prices of fuel and set very low domestic prices, whereas Benin has largely aligned domestic prices to world prices. Official prices of gasoline in Benin have greatly exceeded those in Nigeria for the past three decades, with an average margin of US$0.22/litre for Benin in 1991–2016.Footnote 3 Similar differentials exist for other petroleum products, although the gap for diesel is smaller. Consequently, Benin imports almost all its fuel informally.
D Port Efficiency
Nigeria’s adverse business climate and particularly poorly functioning port and customs also contribute to the attractiveness of Cotonou as an entrepôt. According to the World Bank Doing Business indicators in 2018,Footnote 4 Nigeria is ranked among the worst in the world as regards the ease of trading across borders, at 182nd out of 190 countries, despite efforts to improve port functioning. Benin’s ranking is mediocre, at 107th in the world, but far better than Nigeria. Correspondingly, the time to comply with border and documentary procedures is about three times longer in Nigeria and Benin. Various studies have documented the greater efficiency of the port of Cotonou relative to Nigeria (Hoffman and Melly, Reference Hoffman and Melly2015, Reference Hoffman and Melly2018; Ezeoha et al., Reference Ezeoha, Okoyeuzu, Onah and Uche2019), motivated in part by Benin’s efforts to boost its entrepôt status.
While Benin endeavours to maintain better trade facilitation than Nigeria, that is a low bar: Benin is indeed superior to Nigeria in port functioning, but the port of Cotonou is still far from global best practices. This is even more true for other aspects of the business environment, where Benin is often ranked below Nigeria. Benin’s overall ranking in the Doing Business indicators is 153rd, slightly worse than Nigeria’s 146th. Benin does particularly poorly on important areas such as electricity provision and contract enforcement.
In short, Benin’s trade facilitation institutions function better than Nigeria’s, but Benin’s overall business climate is poor.
IV Magnitude of Entrepôt Trade Between Benin and Nigeria
This section provides estimates of the magnitude of ICBT between Benin and Nigeria for Benin’s smuggling of imported goods into Nigeria and Benin’s informal imports of petroleum products.
Smuggling is of course difficult to measure, but can be estimated indirectly through the magnitude of official imports per capita into Benin compared to Nigeria and other countries (Benjamin et al., Reference Benjamin, Golub and Mbaye2015). Our previous work showed that imports per capita into Benin of certain products that are heavily protected in Nigeria are far too large to be explained by Benin’s domestic consumption. In this section we update our comparisons of imports per capita in Benin, Togo, and Nigeria for some of the key products of the entrepôt trade – namely, those that are heavily protected in Nigeria. We confirm that imports into Benin (and also Togo) are much too large to be explained by domestic consumption. Recently, however, Benin’s imports of some of these key products have dropped off sharply. Figures 8.2a–d show imports per capita for cars, rice, cotton cloth, and poultry, respectively, for Benin, Togo, and Nigeria.Footnote 5

Figure 8.2a Imports per capita in US$ for Benin, Togo, and Nigeria: Cars

Figure 8.2b Imports per capita in US$ for Benin, Togo, and Nigeria: Cotton cloth

Figure 8.2c Imports per capita in US$ for Benin, Togo, and Nigeria: Rice

Figure 8.2d Imports per capita in US$ for Benin, Togo, and Nigeria: Poultry
While there is some domestic Nigerian production of these products, which is, after all, why they are protected, it is typically low relative to domestic consumption, or not large enough to explain the very large differences in import patterns displayed in these figures.
A Cars
Nigeria has banned imports of used cars beyond a certain age in an effort to protect its highly inefficient auto industry. While the permissible age of cars has gradually increased, all imports through land borders were banned in 2016. Nigeria also recently implemented an increase in tariffs. Despite this high protection, Nigerian automobile production has steadily declined to very low levels (Proshare, 2013). No other countries in West Africa produce cars. Togo and especially Benin have developed car-import value chains largely to supply the Nigerian market. Car imports in Benin grew rapidly to very high levels until 2015, after which they dropped sharply. At their peak, car imports per capita in Benin reached about US$80 in 2012–2014, about eight times the ECOWAS average level of about US$10 per person (Figure 8.2a). Starting in 2015, however, car imports into Benin dropped dramatically. Togo’s per capita car imports have also been well above Nigeria’s and average ECOWAS levels, although far below Benin’s, due to Togo’s geographical disadvantage relative to Benin in supplying the Nigerian market and the relatively high cost of transshipping cars. Box 8.1 in Section V describes Benin’s ICBT in cars in more detail.
B Cloth
Perhaps no product is of more importance to low-income but fashion-conscious West Africans than cotton cloth. Nigeria developed a highly inefficient and protected textile industry and most firms have either disappeared or operate at very low capacity.Footnote 6 Imports of cloth in Benin and Togo far exceed those in Nigeria (Figure 8.2b). Nigerian official imports are almost non-existent. In Benin and Togo, imports have surged since the early 2000s, to over US$100 per capita in 2008–2014, more than ten times the average ECOWAS levels of about US$7 per capita. Togo’s relative success in smuggling cloth, compared to cars, reflects the fact that cloth is easier to transport, as well as Togo’s historical role as a regional centre for the textile industry. As in the case of cars, however, cloth imports dropped steeply in 2015–2017.
C Rice
Nigeria has prioritised the development of domestic rice production using stringent import protection. Nigerian rice production remains far below domestic consumption, with the market substantially supplied by Benin, and to a lesser extent Togo and Cameroon. Rice imports into Benin exploded around 2012, while Togo’s imports rose more modestly (Figure 8.2c). A downturn in Benin’s rice imports occurred in 2015, as in the case of cars and cloth, but unlike those two rice imports recovered sharply in 2016–2017, despite continued efforts by the Nigerian government to stifle smuggling, with a ban on imports of rice through land borders in effect since 2013.
Almost all of Benin’s rice imports are of parboiled rice, the preferred type of rice in Nigeria but not in Benin. This provides additional evidence that the large volume of rice imports in Benin is intended primarily for Nigeria (see, e.g. Adefoko, Reference Adefoko2017).
D Frozen Poultry
Poultry has also been on the list of banned items in Nigeria since the early 2000s. Poultry imports into Benin have surged from a few dollars per person in the late 1990s to over US$30 per person in 2014 (Figure 8.2d). Nearly all of Benin’s imports are intended for Nigeria (Oshiotse, Reference Oshiotse2002). Probably due to the high cost of transportation and refrigeration, Togo has not imported much frozen poultry, but an uptick from the mid-2000s until 2015 can be seen. Benin’s imports have dropped sharply since 2015.
E Summary on Entrepôt Imports
Entrepôt imports into Benin are very large but also highly volatile. The sharp downturn in entrepôt trade in 2016–2017 illustrated in Figures 8.2a–8.2d is a case in point. There are two main causes of this recent decline: the recession in Nigeria, with an accompanying sharp depreciation of the Naira, and President Buhari’s efforts to close the border to smuggling from Benin. Of these two, there are several reasons why the recession in Nigeria is likely to have been far more significant than the Nigerian government’s crackdowns. First, the efforts to curb smuggling have a long history of ineffectiveness. Traders are skilled in evading official detection and, more importantly, there are numerous beneficiaries from smuggling in Nigeria, including customs officials. Furthermore, Figures 8.2a–8.2d show that imports into Nigeria also declined in 2016–2017, whereas they should have risen if supply from Benin was cut off, given that Nigerian production did not rise during this period for these products. In particular, car production in Nigeria remains minuscule. Also, the fact that rice imports in Benin declined only briefly in 2016, before shooting back up in 2017, is consistent with the fact that rice is a basic necessity, more so than the other goods shown in Figures 8.2a–8.2d. Thus, rice demand is likely to have fallen less as incomes plummeted in Nigeria. All of this suggests that a fall of demand in Nigeria rather than the Buhari administration’s hardened policies on smuggling is the primary cause of the decline in Benin’s entrepôt trade. A sharp increase in Benin’s taxation of entrepôt imports of cars in 2012–2015 likely also contributed, as discussed later.
The importance of the world oil price in driving Nigeria’s economy, and in turn Benin’s imports of goods intended for transshipment to Nigeria, is illustrated dramatically in Figure 8.3. The left axis shows the world oil price and the right axis the value of imports of nine products that are subject to import protection in Nigeria (cars, rice, cotton cloth, new clothes, used clothes, poultry, sugar, vegetable oil, and cigarettes) in millions of US$. Both series are deflated by the US GDP deflator. Changes in the world price of oil are followed with a short lag by very similar movements in Benin’s imports of key products. In 2011–2014, when world oil prices peaked, imports of these nine products alone rose to about US$4 billion, equivalent to about half of Benin’s GDP. About 80 per cent of these imports were likely destined for Nigeria. When the price of oil collapsed in 2015–2017, Benin’s imports declined by around 50 per cent. As seen in Figures 8.2a–8.2d, individual products have some idiosyncratic variation but generally followed this general pattern, illustrating their sensitivity to the world oil price due to its importance for the Nigerian economy.

Figure 8.3 Benin’s imports of selected key products that are subject to protection in Nigeria (right vertical axis, 2015 US$ millions) and the world price of oil (left vertical axis, 2015 US$ per barrel)
The products are cars, rice, cotton cloth, new and used clothes, poultry, sugar, vegetable oil, and cigarettes. Benin’s imports are measured by rest-of-world exports to Benin of these products, in millions of US$. The oil price is the average annual Brent crude price in Europe. Both series are deflated by the US GDP deflator to remove common trends due to inflation.
Import taxes and competition with Togo are also factors affecting the volume of entrepôt imports in Benin, as described in more detail in Section VI. In particular, Benin raised transit taxes on imported cars in 2012, leading to a dip in Benin’s imports and a rise in Togo’s. This explains why Figure 8.3 and Table 8.2 show that Benin’s entrepôt imports dropped in 2012 despite the high price of oil at that time.
Table 8.2 Value of Benin’s imports by customs regime (per cent of GDP), 2002–2017
| Domestic use | Transit | Re-exports | Total imports | Transit and re-exports | |
|---|---|---|---|---|---|
| 2002 | 21 | 53 | 5 | 79 | 58 |
| 2003 | 21 | 20 | 2 | 44 | 22 |
| 2004 | 22 | 23 | 0 | 45 | 24 |
| 2005 | 19 | 28 | 0 | 47 | 28 |
| 2006 | 18 | 41 | 0 | 59 | 41 |
| 2007 | 18 | 44 | 1 | 63 | 45 |
| 2008 | 21 | 53 | 2 | 75 | 54 |
| 2009 | 20 | 58 | 1 | 79 | 59 |
| 2010 | 20 | 70 | 1 | 91 | 71 |
| 2011 | 16 | 50 | 1 | 67 | 51 |
| 2012 | 16 | 28 | 1 | 45 | 29 |
| 2013 | 20 | 39 | 3 | 62 | 41 |
| 2014 | 26 | 41 | 15 | 83 | 57 |
| 2015 | 22 | 33 | 3 | 58 | 36 |
| 2016 | 21 | 24 | 1 | 46 | 25 |
| 2017 | 23 | 31 | 1 | 54 | 32 |
F Benin Informal Imports from Nigeria
Petroleum products constitute by far the largest informal import from Nigeria (Bensassi et al., Reference Bensassi, Jarreau and Mitaritonna2018). While precise measures are difficult to obtain for petroleum product imports into Benin, informal imports are estimated to supply about 80 per cent of Benin’s consumption (Mbaye et al., Reference Mbaye, Golub and Gueye2019). Box 8.2 in Section V below provides a description of the trade in petroleum products.
Benin also informally imports a variety of manufactured products from Nigeria, although the volumes are low relative to petroleum products (Golub, Reference Golub2009).
G Comparison to Other Estimates
The overall magnitude of informal trade is difficult to measure precisely, but generalising from these sectors, as well as the evidence on imports by customs regime discussed in Section V below, it is clear that informal trade is much larger than formal trade, perhaps double in size. These estimates are larger than those in most previous literature because, as noted in Golub (Reference Golub2009), previous studies have ignored the role of goods declared in transit regimes. The following paragraph shows that goods declared in transit and re-export regimes are about double the value of goods declared for domestic use.
In 2011 Benin’s Institut National de la Statistique et de l’Analyse Economique (INSAE) carried out a large-scale survey of informal trade in Benin over a ten-day period, as described in Bensassi et al. (Reference Bensassi, Jarreau and Mitaritonna2018). The INSAE study involved thousands of interviews at unofficial border crossing posts on the Benin–Nigeria border. While the survey had some important limitations, such as only taking place during the daytime and the fact that the veracity of the answers provided by traders can be questioned, the survey provides the only available direct estimates of the composition and magnitude of informal trade. Bensassi et al. (Reference Bensassi, Jarreau and Mitaritonna2018) focused only on domestically produced goods, but the INSAE dataset also surveyed trade in entrepôt regimes.Footnote 7 An examination of the summary INSAE data by product and regime reveals that the key smuggled products identified earlier constitute the bulk of goods reported in entrepôt status. That is, cars, rice, cotton cloth, new clothes, used clothes, poultry, sugar, vegetable oil, and cigarettes accounted for about 60 per cent of the goods reported by traders as transit and 90 per cent of the goods reported as re-export. The INSAE magnitudes, however, are well below those estimated indirectly, as the surveys undoubtedly did not cover many traders, particularly those crossing at night when the largest traders generally operate. On the side of exports from Benin to Nigeria, the INSAE data report that over 90 per cent of Benin’s informal exports to Nigeria consist of petroleum products. Thus, the INSAE data corroborate the focus of this chapter on a few key entrepôt goods subject to high levels of protection in Nigeria and petroleum products, which are heavily subsidised in Nigeria.
It may also be of interest to compare our indicators of unofficial trade with officially reported Benin–Nigeria trade. As already noted, official bilateral trade is very low. Figures 8.4a, b show the composition of official Benin exports to and imports from Nigeria, in US$.

Figure 8.4a Official Benin trade with Nigeria, principal products, in US$ millions: Exports

Figure 8.4b Official Benin trade with Nigeria, principal products, in US$ millions: Imports
Interestingly, the most important products in official trade are much the same as those that are smuggled, although official trade is much smaller, highly volatile, and three products accounted for almost all of official Beninese exports to Nigeria over 2009–2017: poultry, rice, and vegetable oil (in sharply varying proportions). Whereas total entrepôt trade approached US$5 billion at its peak, the vast majority of which was destined for Nigeria, official Benin exports to Nigeria peaked at US$200 million in 2010 and have since been below US$100 million. In 2009–2010, poultry and rice were the two largest of Benin’s official exports, but these two dropped sharply starting in 2011. Recently, vegetable oil has been the largest official Benin export to Nigeria. These fluctuations likely reflect shifting degrees of enforcement of Nigeria’s restrictions on informal trade for selected products, with these products sometimes allowed to enter Nigeria officially.
Figure 8.4b shows that reported imports to Benin from Nigeria are even smaller. Petroleum products are usually the largest official import by far, although these official imports are dwarfed by smuggling of gasoline and diesel.
In short, the composition of official trade between Benin and Nigeria seems roughly similar in structure to that of unofficial trade, but it is much smaller and subject to erratic changes in product composition.
V The Institutional Structure of Informal Cross-Border Trade in Benin: Highly Organised Informal Trade
This section describes the institutional processes through which goods are transshipped to Nigeria and fuel is smuggled into Benin.
A Customs Regimes
Goods imported into Benin are rarely ordered by the final consumers of these goods prior to arrival in the port. Instead, large importing companies, both domestic and foreign owned, bring goods into the port of Cotonou to sell to domestic and regional buyers. Only when the goods are purchased are they declared under one of three main customs regimes:
mis à la consommation (for domestic use);
transit; and
re-exports.
If declared for domestic use, the purchaser must clear all import taxes, including customs duties, value-added taxes, and several other smaller taxes. The import duty rates are set by the ECOWAS CET. For final consumer goods the total tax rates are about 45 per cent.
There are two main regimes for the transshipment of goods in Benin and Togo: transit and re-exports. The classification of goods into these two categories is complex, with rather minor differences often determining whether transactions are classified as re-exports or transit. These two rubrics include a variety of subcategories of transshipment based on practices that have evolved over time. In any case, the differences between the two regimes are quite small and the main point is that under both of these regimes imports are taxed much more lightly than when they are declared for domestic use, as explained in the following. In practice, the magnitude of transit trade is much higher than re-exports in almost all cases. We will use the term ‘entrepôt imports’ to describe both transit and re-exports. Togo has very similar regimes for imports.
Transshipped goods do not necessarily – or even usually – end up in the stated destination country. Most goods in transit in Benin are declared for Niger, but everyone knows that most of them end up in Nigeria. On-site visits by the authors to car parks in Benin confirmed that the buyers of vehicles are overwhelmingly Nigerian. Numerous international and local press reports also observe smuggling from Benin to Nigeria. As will be discussed, entrepôt imports are affected by Benin’s competition with Togo, as well as by events in Nigeria.
Table 8.2 displays Benin’s imports according to the three customs classifications noted earlier – domestic use, transit, and re-exports – over 2002–2017 as a ratio of Benin’s GDP. These data are reported by Benin’s customs, whereas the trade values in Section IV are from the UN Comtrade database as reported exports from Benin’s trade partners. The overall magnitudes of the Beninese data and the UN Comtrade data are similar. The advantage of the Benin customs data is that they disaggregate by customs regime, but they are not available on a consistent basis for as long a time period as the UN Comtrade data. The Benin customs data importantly also include revenues collected, and thus enable a computation of effective import tax rates for each customs regime.
Benin’s entrepôt trade (transit and re-exports) is generally much larger and more volatile than imports declared for domestic use. While imports for domestic use are stable at around 20 per cent of GDP, entrepôt imports vary from 20 to 60 per cent of GDP.
The composition of imports between domestic use and entrepôt trade may be affected by differential taxation of the two regimes. Tax competition with Togo may also play a role, as discussed in Section VI. Statutory taxes on entrepôt imports in Benin are generally very low, with the notable exception of used cars. Statutory rates are largely irrelevant, however, as there is substantial discretion in applying tax rates. In particular, tax rates are much lower if goods are labelled for land-locked countries, usually Niger, but in reality the stated destination is almost always modified from Niger to Nigeria once the goods leave the port. Thus, in the analysis we use actually applied tax rates, measured by tax revenues divided by value of imports, rather than statutory tax rates.
Figure 8.5 shows the share of entrepôt imports of total Benin imports for the three most important products exported informally from Benin to Nigeria: cars, cotton cloth, and rice. It shows that for cars, and until recently cloth, imports in entrepôt status constituted about 90 per cent of total declared imports, or, equivalently, imports declared for domestic use were only 10 per cent of total imports. The entrepôt share for cars and cloth dropped in 2016–2017 to around 70 per cent, likely due to the general reduction of informal trade to Nigeria, most of which is declared in transit or re-export. To the extent that domestic consumption in Benin did not fall as much, the share of imports for domestic use rose. The share of imports of rice declared in entrepôt regimes was lower than for cars and cloth, at about 50 per cent from 2009 to 2013, and then dropped quite sharply in 2014–2017 to about 25 per cent. This was likely due to a reduction in taxes on rice imports for domestic use, from 33 per cent prior to 2014 to 14 per cent in 2014–2017. Thus, for rice it became less advantageous to use transit status relative to importing through the regular channel for distribution in Nigeria, and a sizeable share of imports of rice was shifted from the transit regime to import for domestic use.

Figure 8.5 Share of Benin’s key imports declared in entrepôt regimes (transit and re-export): Cars, rice, and cloth (per cent of total imports of respective products)
B Social Organisation of Informal Trade
Although goods are sometimes imported legally by formal firms, distribution is dominated by informal or semi-formal operators, both foreign and domestic, once the goods are sold and exit the port storage depots. Smuggling is largely controlled by sophisticated and well-organised networks, with many small operators involved on the margins. The trust and connections provided by these informal networks, often ethnic or religious in nature, facilitate market transactions spanning continents, and enable the provision of credit and transfers of funds.
In many cases, importers and distributors are large informal firms, as described in Benjamin and Mbaye (Reference Benjamin and Mbaye2012) and Mbaye et al. (Reference Mbaye, Golub and Gueye2019). These firms have a large volume of business, yet in other respects operate in much the same way as smaller informal firms do; that is, they are controlled by a single businessperson, have falsified accounts, and do not pay regular business income taxes. Their financing is sometimes through banks, but more typically from own or family savings and retained earnings. The fate of the firms is inextricably linked to that of the owner, who often relies on political connections to maintain his status as a large businessman operating outside of the legal and regulatory system.
For bulk items, such as rice, wheat, and sugar, importers purchase directly from international brokers, with whom they are in regular contact. A few major importers dominate the rice market, with Difezi et fils controlling more than half of sales.Footnote 8 Likewise, Cajaf Common, owned by Sébastien Ajavon, is the dominant importer of frozen chicken ultimately destined for Nigeria. Lebanese business networks dominate the used car trade.
Importers of second-hand goods, such as used cars, often travel abroad or have foreign correspondents who provide information about sourcing opportunities. Overall, traders display remarkable flexibility in adapting to changing market opportunities (Golub, Reference Golub2009, Reference Golub2012).
ICBT has developed a sophisticated infrastructure and is often organised much more efficiently than public services. Goods can cross the border by land or water. By land, there are numerous and ever-changing tracks used by traders along the long borders. A complex network of canals is also used, with new canals being dug when customs agents patrol existing routes. Specialised warehouses for various goods, such as rice, are located along the Benin–Nigeria border, built and operated by brokers or private traders. A network of markets is also dotted on both sides of the Benin–Nigeria border, with sister markets on either side of the frontier.Footnote 9
Complex relationships between traders and government officials alternate between cooperation and conflict in both Nigeria and Benin. Importers have elaborate ruses for evading import taxes. Nigerian prohibitions on imports through land borders are evaded quite easily considering that the number of unofficial crossing points far exceeds official border posts. Bans simply lead to declining traffic at official posts, in favour of unofficial posts, mainly in the northern part of the frontier or through Niger. Further, poorly paid customs officials often collude with traders to get around government efforts to curb smuggling. Traders refer to the bribes they pay as ‘sacrifice’. A Nigerian trader with the pseudonym Delani vividly described the process of rice smuggling:
‘I work within a group of about seven [smugglers]. The least any of us handles is 1,000 bags. When people say rice importation has been banned though the land border, people like us just laugh. We have a leader. How we operate is that each person shops for the rice he has been contracted to supply. Any week we have a large shipment, we gather everything together. We load them on some trailers. Sometimes it may be 5,000 bags […] Then our leader approaches our contacts in customs to arrange how the cargo gets through the border. We pay the customs officials NGN 1,000 on each bag of rice and we are issued a time, date, and route we could pass through that is not being monitored. Usually, we cross the border around 11 PM’.
Even if officials were to implement orders to crack down on smuggling, smugglers are frequently more heavily equipped and armed than customs and police officials. The situation is vividly illustrated by an incident where an anti-smuggling officer in Nigeria was shot dead by an army officer of the same nationality escorting a convoy of smuggled cars into the country (Sesan, 2017).
Boxes 8.1 and 8.2 provide a more detailed description of Benin’s trade in used cars and petroleum products, respectively.Footnote 10
Box 8.1 Trade in Used Cars
Used cars have been by far the most important of Benin’s entrepôt imports in terms of employment, income, and customs revenue since about 2000. Imports of vehicles in transit status rose steeply from 50,000 in 1996 to 200,000 in 2000, and to 250,000 in 2002 and 2003. After a dip in 2004–2005 to about 150,000, they then increased steadily to nearly 350,000 in 2014.Footnote 11 Cars imported for domestic use are of the order of 20,000; that is, less than 10 per cent of cars imported in transit status. However, car imports declared for transit plunged in 2016–2017, falling below 100,000, still far above domestic consumption but down to levels not seen since before 2000.
The used car trade is one of Benin’s major industries. Huge car parks can be seen on the outskirts of Cotonou. The business is estimated to employ 10,000–15,000 people directly, in importing, selling, storing, driving, and so on, and several thousand more indirectly (Golub, Reference Golub2009). The value-added generated by the distribution and handling of used cars has been estimated at about 10 per cent of Benin’s GDP, roughly the same as cotton.
Cars are imported into Benin through a process of elaborate subterfuge. The vast majority of cars imported in transit status are declared as having Niger as their destination, but it is common knowledge that at least 90 per cent end up in Nigeria. For example, in 2014, of the approximately 332,000 cars imported in transit status, 326,000 were declared for Niger – obviously bearing no resemblance to actual shipments to Niger, where annual car purchases are almost certainly below 10,000. There is a well-established set of procedures for obtaining documents from customs authorising diversion of the cars to Nigeria.
Used car imports follow a complicated and well-organised circuit. Importers with connections in developed countries locate, purchase, and arrange for the transportation of the cars. Some of the importers are affiliated with international shipping companies, such as Grimaldi, that own their own boats. Others rent the boats. Freight forwarders (transitaires) handle all the paperwork and authorisations. Other intermediaries play a role in matching buyers and sellers of cars. After the cars clear the port, they are stored in car parks in Cotonou, before being driven to their destination by companies specialising in the delivery of cars to the border, under escort from customs and with police permission. The cars are driven at night in convoys of about 100 cars. They cross the border to Nigeria after paying bribes to both Beninese and Nigerian customs inspectors. The bribe is routine and the amount is largely set by precedent, according to the transitaires interviewed. The cars then receive valid licence plates in Nigeria. In short, government officials – from the highest to the lowest levels – on both sides of the border facilitate and benefit from this trade.
Customs also apply considerable discretion in the valuation of imported cars, which alters the effective tax rate. A lower valuation may reduce the amount of ad valorem taxes collected. Figure 8.6 shows average customs valuations of cars declared for transit and for domestic consumption in Benin and Togo, measured in US$.Footnote 12 Presumably, cars imported in the two regimes are similar in quality, since the per capita incomes and demand for cars do not differ much between Nigeria and Benin. In 2004–2007 cars imported for domestic use in Benin were assigned much higher values than cars in transit, a system that ceased from 2008 to 2011 and then resumed to a lesser extent in 2012. In Togo, on the other hand, customs valuations are higher for cars imported in transit than for domestic consumption. Customs officials in both countries are likely responding to domestic political pressure from consumers, other government branches, and smugglers.

Figure 8.6a Average valuations of cars imported under regimes for transit and domestic use, in US$: Benin

Figure 8.6b Average valuations of cars imported under regimes for transit and domestic use, in US$: Togo
Togo competes intensely with Benin for access to the Nigerian market. Togo charges lower fees for a speedier service in handling car imports, in an attempt to offset Benin’s geographical advantage.
The ample supply of ageing vehicles in developed countries and low incomes in West Africa provide a natural basis for trade in used cars. Toyota, Mercedes, and Peugeot cars predominated in the early 2000s, but other Japanese and European companies are increasingly prevalent. An accompanying market in spare parts has also flourished.
Nigeria’s ineffective attempts to protect its own struggling car industry have diverted this trade to the parallel market. At the end of the 1970s Nigeria assembled 100,000 cars, but the car industry has been moribund in the country for many years. In 1994, Nigeria banned imports of vehicles more than eight years old. In 2002, the law was further tightened to a ban of all cars more than five years old. Since then the permissible age has gradually increased. In 2013, steep tariffs were implemented as Nigeria unveiled another attempt to revive the auto industry with the Nigerian Automotive Industry Development Plan. Vehicle production increased moderately at first, but has fallen back to very low levels in the last few years, declining even more rapidly than the rest of the manufacturing sector (Economist Intelligence Unit, 2017).
Nigeria has repeatedly banned imports of cars by land routes. These bans, however, have until recently proved impervious to the porous border between the two countries, the strong demand for cheap vehicles, and the ambiguous attitudes of the authorities in Nigeria. The recent sharp downturn in Benin’s imports is likely more due to the recession in Nigeria than to the effectiveness of the import ban. Regardless, the collapse of car distribution in Benin has had severe effects on income and employment. A recent article describes the change vividly: ‘Residents say drivers used to pass by in huge convoys, speeding towards the border, beeping their horns in celebration. Bars that sprang up to cater to visiting clients have closed and dozens of Lebanese, who dominate the import business in West Africa, have departed’ (Sasse and Carsten, Reference Sasse and Carsten2017).
Box 8.2 Petroleum Product Imports from Nigeria
Smuggling of oil products into Benin began around 1980 and increased dramatically in 2000. Like the entrepôt trade from Benin to Nigeria, smuggling of petroleum products into Benin reflects differential policies combined with the ease of slipping goods across the border and the complicity of the two countries’ officials, including at the highest levels of the military. In this case, however, the main factors are the large subsidies in Nigeria, along with the alignment of domestic to world prices in Benin, which together result in much lower consumer prices in Nigeria compared to Benin (Morillon and Afouda, Reference Morillon and Afouda2005; Mbaye et al., Reference Mbaye, Golub and Gueye2019). In recent years Nigeria has partially deregulated petrol prices, but they remain well below Benin’s, although to a lesser extent for diesel than for gasoline.
The black market price in Benin is determined by a mark-up on the Nigerian official price and has little connection to Benin’s official price. In 2016, our field research revealed a persistent although variable differential between the official and black market price.
The share of gasoline supplied by informal imports from Nigeria rose from about 10 per cent in 1998 and 1999 to about 50 per cent in 2000, and to 83 per cent in 2001 and 2002, only tapering off slightly in 2003–2004 to 72 per cent (Morillon and Afouda, Reference Morillon and Afouda2005). Despite some increases in Nigerian gasoline prices, the share of smuggled gasoline was estimated at about 80 per cent of Benin’s domestic consumption in 2013 (Mbaye et al., Reference Mbaye, Golub and Gueye2019).
The dominance of the informal market in Benin is reinforced by the lack of official gas stations, and the lack of stations in turn reflects the dominance of the informal market, with the zones bordering Nigeria in particular witnessing a decline in the number of operating service stations. In contrast, there is a very dense network of service stations in Nigeria, which readily supply the informal traders who smuggle the gasoline into Benin.
The distribution network in Nigeria includes large wholesalers who have storage depots along the border that hold up to 1,000 litres of gasoline. These wholesalers have close political ties to high-level officials in Nigeria. Wholesalers sell to various intermediary distributors of various sizes, who sneak the gasoline through the border by pirogue, cars whose gas tanks have been expanded, in small quantities on scooters, or on foot.
The net effect of this massive trade in petroleum products on Benin’s economy is complex. It entails a large loss of fiscal revenues, but is also a source of employment and income for traders and distributors, accounting for about 1–2 per cent of GDP and 15,000–40,000 jobs, depending on the method of estimation (Golub, Reference Golub2009).
VI The Effects of Informal Trade on Benin
The effects of ICBT on Benin are mixed (Galtier and Tassou, Reference Galtier, Tassou, Egg and Herrera1998). Golub (Reference Golub2009) estimated that ICBT generates about 20 per cent of Benin’s GDP, and a somewhat smaller but still large part of employment, most of it in the handling of used cars and the distribution of petroleum products. The effects on fiscal revenue are particularly important. On the negative side, informal trade contributes to an institutional environment that favours informality, and that thus may impede the development of a modern formal private sector. There are also allegations of an association of informal trading with more insidious forms of illegal trade in arms and narcotics, but we do not have access to information about its extent.
A Effects on National Income and Employment
The contribution to national income from informal trade derives from the value-added in the handling and distribution of entrepôt trade and petroleum products, including tax revenues. There are no official measures of the value-added of smuggling, but rough estimates can be derived from the previous analysis. Together, our calculations suggest that the handling and distribution of entrepôt trade and petroleum product imports account for approximately 20 per cent of Benin’s GDP. Of these two, entrepôt trade is by far more significant.
For this purpose, we can consider three main categories of entrepôt trade:
Cars imported in transit status. Cars require much more domestic handling in Benin than other goods, as described in Box 8.1. Cars are also subject to relatively high transit taxation of about 20 per cent, as described in the following. We thus assume that the share of value-added in car handling, shipping, and taxation is 70 per cent of imported value.
Other goods imported in transit status, such as rice, cloth, and frozen poultry. These goods imported in transit status face minimal transit taxation and relatively little domestic handling, so we assume that domestic value-added is only 20 per cent of imported value.
Goods imported for official use but in fact transshipped to Nigeria, notably rice and frozen poultry. These goods imported in regimes for domestic use face import taxes averaging around 45 per cent (30 per cent for rice), but relatively little domestic handling, so we assume that value-added is 50 per cent of imported value.
We assume further based on the trade data that (1) total imports intended for transshipping to Nigeria are 50 per cent of Benin’s GDP; and (2) the share of cars, goods falsely declared for domestic consumption, and other goods in entrepôt status constitutes, respectively, 20, 20, and 60 per cent of informal trade with Nigeria. Under these assumptions, the contribution of value-added in entrepôt status amounts to 18 per cent of GDP.
The effects of imports of petroleum products on Benin’s GDP are even more difficult to estimate but are much smaller. The most detailed study is Morillon and Afouda (Reference Morillon and Afouda2005). Their estimates of the gross margins of distributors suggest that the value-added in informal trade of petroleum products amounts to about 2 per cent of GDP. The extent to which traders’ incomes are a net addition to GDP is questionable insofar as the informal distribution of petroleum products displaces official distribution and, in the process, results in loss of government revenues. As Morillon and Afouda (Reference Morillon and Afouda2005) rightly observe, however, the informal import of petroleum products involves a terms of trade gain, since Benin can import gasoline at prices below world levels. Nigeria’s subsidised petroleum products are in effect a transfer to Benin. Morillon and Afounda’s (2005) calculations suggest that this trade gain is around 1 per cent of Benin’s GDP.
There are likewise no official measures of employment in informal trade. Perret (Reference Perret2002) estimates that direct employment in the used car trade in 2001 was about 15,000, with indirect employment creation of around 100,000. Morillon and Afouda (Reference Morillon and Afouda2005) estimate that employment in smuggled petroleum products ranged from about 20,000 to 40,000, mostly traders and sellers, in the early 2000s. At the peak of the re-export trade around 2014, employment was likely much higher. The decline in entrepôt trade since 2015 has had significant negative effects on employment, particularly in the car distribution sector.
While ICBT with Nigeria accounts for a sizeable share of national income and employment, the longer-term effects on economic growth and diversification could be negative. ICBT attracts entrepreneurial talent into illegal or semi-legal informal activities. Furthermore, the implication of government officials at all levels in informal activities makes reform much more difficult. Nevertheless, ICBT does not necessarily preclude investment in sectors where Benin has strong potential comparative advantage, such as horticulture and agro-processing. There is abundant under-employed labour in Benin and improved opportunities in formal industry would likely attract many of the small-scale traders who work in informal trade as a last resort.
B Effects on Government Revenues
Benin’s system of import taxation has revolved around maximising the income from entrepôt trade, by taxing goods when they enter Benin at a rate well below that in Nigeria, or taking advantage of Nigeria’s import prohibitions. However, avoidance of indirect taxes on smuggled petroleum products from Nigeria mitigates this revenue gain from entrepôt trade.
Benin has a high dependence on import tax revenues, which account for about half of tax revenues, far above the average share of about 10 per cent of international trade taxes in tax revenues in low-income countries (Coady, Reference Coady2019). In 2015–2017 there was a substantial drop in the tax revenue-to-GDP ratio from 14.5 to 12.6 per cent, which was mostly due to reduced revenues from international trade taxes. This drop in international trade taxes was in turn due to a sharp decline in revenues from entrepôt trade (Table 8.3).
Table 8.3 Entrepôt trade tax rates and revenues in Togo and Benin, 2008–2017
| 2008–2010 | 2011 | 2012–2015 | 2016 | 2017 | |
|---|---|---|---|---|---|
| Effective tax rates on transit and re-exports (%) | |||||
| Benin – Cars | 12.90 | 16.40 | 33.60 | 29.70 | 23.60 |
| Benin – All goods | 3.40 | 4.40 | 6.90 | 3.60 | 2.10 |
| Togo – Cars | 0.80 | 0.80 | 0.50 | 0.40 | 0.40 |
| Togo – All goods | 0.40 | 0.10 | 0.50 | 0.50 | 0.50 |
| Share of import tax revenue due to transit and re-exports (%) | |||||
| Benin – Cars | 15.80 | 21.90 | 25.10 | 11.50 | 6.30 |
| Benin – All goods | 25.80 | 38.70 | 41.10 | 17.50 | 11.30 |
| Togo – All goods | 0.30 | 0.30 | 3.00 | 2.20 | 2.40 |
Table 8.3 shows the effective tax rates in Benin and Togo on entrepôt imports. These are calculated from customs data provided by the governments in both countries as the value of revenues from taxing imports in the transit and re-export regimes divided by the value of entrepôt trade. Table 8.3 presents information for cars as well as aggregate trade. A number of interesting features appear from these data.
First, the tax rates on Benin’s imports of cars in transit status are much higher than the rates for other goods. The effective tax rates on goods imported in transit status other than cars are well below 1 per cent, whereas the rates on cars are in double digits. Second, Benin sharply raised the effective tax rate on cars imported in transit from about 13 per cent in 2008–2010 to above 30 per cent in 2012–2015. With the recession in Nigeria lowering demand, Benin rolled back the effective transit tax rate on cars to 23.6 per cent in 2017. Third, Togo’s effective tax rates on entrepôt trade are very low for both cars and other goods, at well below 1 per cent. Undoubtedly, this reflects Togo’s efforts to remain competitive despite its geographical disadvantage in smuggling goods, particularly cars, into Nigeria. Togo, like Benin, lowered transit taxes on cars in 2016–2017, but starting from a much lower level of only 0.8 per cent.
Table 8.3 also presents the contribution of entrepôt trade regimes to tax revenues in the two countries. Not surprisingly in view of the effective tax rate differences, Benin collects much more revenue than Togo. Furthermore, and also related to the high rate of taxation on cars, cars account for more than two-thirds of Benin’s revenue from entrepôt trade. At its peak in 2012–2015, entrepôt trade regimes contributed 41 per cent of customs revenue, with cars alone accounting for 25 per cent. With the sharp downturn in trade with Nigeria, the share of entrepôt trade in revenue collection dropped dramatically, falling in 2017 to 11 per cent for all trade and 6 per cent for cars. Togo, on the other hand, receives very little revenue from entrepôt trade due to its low tax rates. However, Togo did experience an increase of this ratio from 0.3 per cent in 2008–2011 to 3 per cent in 2012–2015, due both to a slight increase in its effective tax rates and more importantly to a surge in entrepôt trade likely incentivised by trade diverted to Togo due to Benin’s higher tax rates. Like Benin, Togo’s revenues fell in 2016 and 2017 because of the recession in Nigeria.
The estimates in Table 8.3 do not include revenues from goods imported under the regime for domestic consumption. Some of these goods, particularly for rice and a few other key products, are likely intended for Nigeria, although the proportion is difficult to ascertain precisely. Since goods imported for domestic consumption face higher import taxes than those in entrepôt status, such imports have a disproportionately higher effect on government revenues, although they constitute a relatively small part of smuggling (we assumed it constituted 20 per cent of entrepôt trade in the calculation of value-added). Including these goods labelled for domestic use but intended for Nigeria raises the share of import tax revenue from informal exports to Nigeria to about half of total import tax revenue; that us, 3–4 per cent of Benin’s GDP prior to the recent downturn.
Against this, Benin’s loss of fiscal revenue due to smuggling of petroleum products from Nigeria was estimated by Morillon and Afouda (Reference Morillon and Afouda2005) at about 1 per cent of GDP. A recent government estimate reported in the press put these losses at US$37.5 million, or also about 1 per cent of GDP (Energies Media, 2018). This suggests that the net contribution of fiscal revenues from informal trade with Nigeria was equivalent to about 2–3 per cent of GDP in 2012–2015, before the recent recession in Nigeria.
Figure 8.7 looks more closely at the effects of tax competition between Benin and Togo over the period 2002–2017. The line shows the differential in the average effective tax rate on entrepôt trade between Benin and Togo (right axis). The two bars show Benin and Togo’s entrepôt trade-to-GDP ratios, respectively (left axis). Until 2015, a correlation between the tax differential and entrepôt trade is discernible, with Benin’s trade falling and Togo’s rising when the tax differential rises. In particular, Benin raised its taxes in 2003 and again in 2012, and Benin’s entrepôt trade fell while Togo’s rose. After 2014 the correlation breaks down due to demand-side shocks coming from Nigeria, causing Benin’s trade to fall despite a declining tax rate. Over the period 2002–2014 the correlation coefficient of the tax differential with the entrepôt-to-GDP ratio is –0.44 for Benin and 0.52 for Togo, confirming the visual impression.

Figure 8.7 Entrepôt tax rate differential (Benin minus Togo, in per cent) and entrepôt trade in Benin and Togo (per cent of GDP)
In summary, informal entrepôt trade constitutes a large part of national income and fiscal revenues, but they are subject to high variability due to competition from Togo and shocks in Nigeria.
VII Summary and Policy Conclusions
Much of Benin’s economy is under the spell of the policies and institutions of its giant neighbour Nigeria. Nigeria’s power as the largest economy on the African continent is unfortunately distorted by the resource curse of dependency on oil in a setting of weak institutions. A rather unhealthy, even parasitic, relationship has developed between Benin and Nigeria. Resource rents in Nigeria are ultimately transmitted to Benin through smuggling rents.
Benin has developed a sophisticated institutional structure to support its role as a smuggling hub for Nigeria. The resulting entrepôt trade has become one of Benin’s largest industries. This trade can be quite lucrative, both for the participants and for Benin’s government, which collects substantial revenues from it. Used cars are by far the most important industry in terms of national income and fiscal revenue, accounting for about two-thirds of aggregate import tax revenue from entrepôt trade. Customs administration in particular is configured to enable smuggling. The Benin tax authorities balance the priority to raise additional revenues against fostering the growth of this trade.
These benefits of ICBT to Benin, however, are very fragile, dependent as they are on the vagaries of economic policy in Nigeria. The repeated closures of the border are ominous demonstrations of Nigeria’s ability to shut down the re-export trade if it chooses to do so. Likewise, if Nigeria ever did really harmonise its trade policies within ECOWAS, the raison d’être of this trade would largely disappear. Perhaps of greater immediate concern is Benin’s vulnerability to macro-economic shocks emanating from Nigeria. The recent sharp drop in most entrepôt imports in Benin is due primarily to the recession in Nigeria rather than border closures. The severe shortage of foreign exchange in Nigeria in 2015–2017, combined with a fixed official parity, led to large depreciation of the Naira on the black market. This black market depreciation has exacerbated the downturn, as Nigerian consumers must pay higher prices in Naira for goods invoiced in foreign currencies.
At a broader level, a case can be made that the flourishing of informal trade has retarded Benin’s development. The large fiscal benefits of re-exporting have reduced the government’s impetus to promote productive economic activities. The lure of the rents in Nigeria’s distorted markets exacerbates a culture of corruption and tax evasion that is not conducive to a productive economy. It is doubtful that a development strategy based on smuggling and fraud is a viable long-run path to emerging market status.
In principle, it would be desirable for Benin to coordinate macro-economic and trade policies with Nigeria, to avoid creating incentives for Benin to circumvent discrepancies in prices between countries. It is highly unrealistic, however, to expect Nigeria to coordinate its policies with Benin. Benin is far too small to exert any substantial influence on Nigeria’s policies and Benin has limited autonomy insofar as it is tightly integrated into WAEMU. Nigeria is unlikely to abandon the protection of influential industries any time soon. For Nigeria, domestic interest groups and perceived national interest are going to trump Benin’s interests. Thus, the numerous announcements of separate or joint efforts to combat smuggling by the two governments, such as those discussed in Section II, have had no discernible long-run effects on informal trade. The incentives to take advantage of large pricing differences due to Nigeria’s high import barriers and subsidies are very powerful inducements to both traders and border officials to engage in or enable smuggling. The only sustainable solution is for Nigeria to realise that it is not in its interest to pursue policies of relying on import protection to boost inefficient domestic industries and subsidising gasoline use.
Benin can work within ECOWAS to gradually promote harmonisation of policies, but Nigeria is unlikely to cede a great deal of sovereignty to ECOWAS either. ECOWAS does have agreements to combat child trafficking and other illegal activities, but has no programmes to stop smuggling in legal goods, as far as we know. For example, Nigeria has retained an import prohibition list for which there are no provisions in ECOWAS. The Buhari government’s refusal to join the Africa Continental Free Trade Area (ACFTA) further reveals Nigeria’s intention to continue to protect domestic industries. Benin is also one of the three remaining countries that have yet to sign ACFTA (Eritrea is the third) (Wilson and Munchi, Reference Wilson and Munshi2019).
Instead, Benin should focus on improving its own institutions and productive capabilities. In some respects, Benin’s combination of formal and informal institutions supporting entrepôt trade is quite sophisticated and effective in its objective of promoting Benin as an informal trade hub. The problem is that a development policy oriented towards informality and smuggling is unsustainable. The challenge for Benin is therefore to channel its evident energy and creativity in a more viable direction. Benin is well placed to continue to serve as a regional trading and service centre for legal trade and services, benefiting from its proximity to Nigeria and links to the land-locked countries to the north. Moreover, if Benin moves away from smuggling towards formal trade, avenues for cooperation with Nigeria could open up.
Rather than focus on eradicating smuggling, which it is largely impossible to do under current Nigerian policies, Benin should take measures that improve the business environment for legal businesses. The 2005 Benin Diagnostic Trade Integration Study (DTIS; World Bank, 2005) argued that Benin could emulate Hong Kong.Footnote 13 Hong Kong transitioned from being an entrepôt for illegal trade to China in the 1950s into a diversified manufacturing and service economy (Chau, Reference Chau1997). Hong Kong developed world-class institutions, particularly trade facilitation (port and customs), a reliable legal system and property rights, and efficient infrastructure. Hong Kong managed to maintain the efficiency and probity of its own public services even as it served as an entrepôt for illicit trade. In Benin, by contrast, the institutional underpinnings of a market economy, such as the legal system and infrastructure, are better than Nigeria’s but generally still poor.
The sharp downturn in entrepôt trade in 2016–2017 (see Figure 8.2a–d), due to the recession in Nigeria and Nigeria’s efforts to close the border to smuggling from Benin, should be a wake-up call to Benin to initiate fundamental reforms. The 1951 United Nations embargo on China was a major impetus to Hong Kong’s shift from an entrepôt economy to a producer of manufactured and service exports for developed countries.Footnote 14 At the same time, if Nigeria is able to rein in corruption and tap its own massive potential it could then benefit Benin, just as Hong Kong re-invented itself as a financial and organisational service centre for Chinese manufactured exports with China’s opening to the world economy in the 1980s.
Benin is much less developed than Hong Kong, but the precedent set by Hong Kong in transitioning from illicit to formal trade is still relevant as providing a general plan. In particular, Benin needs to follow Hong Kong’s example in two ways: (1) reinvent itself as a legal commercial centre serving the region; and (2) develop competitive domestic industries. In the case of Hong Kong, export diversification involved shifting into labour-intensive manufacturing; Benin has a comparative advantage in tropical produce and horticulture. At present, Benin’s trade facilitation institutions and business climate are sufficiently superior to Nigeria’s to circumvent Nigeria’s trade barriers, but inadequate for serving as a regional service centre for legal trade and facilitating foreign and domestic investment. The mediocre quality of public services in Benin extends to the port and customs administration, which are critical for a country with ambitions to serve as a trading centre.
The two Benin DTIS (World Bank, 2005, 2015) provide detailed recommendations for improvements in trade facilitation and other institutions that could contribute to Benin’s becoming a hub for formal trade with Nigeria and other countries in the region. These include modernisation of customs, using more information technology and formal management procedures that improve accountability and transparency; improved port logistics; and linked rail and road infrastructure investments. Some progress in this regard has been made. The Millennium Challenge Corporation’s programme for improving the port of Cotonou was found to have considerable success in raising operational efficiency, lowering costs, and reducing petty corruption (Millennium Challenge Corporation, 2017). While past reforms of customs have largely failed, more recently progress has been made in the adoption of a new customs code and modern international practices, such as the SAFE Framework of Standards of the World Customs Organization,Footnote 15 the revised Kyoto Convention, and the Agreement on the Facilitation of World Trade Organization (WTO) Trade (World Bank, 2018).
More broadly, Benin needs to upgrade its institutions to boost investment in productive activities, as discussed throughout this book. A positive agenda for encouraging investment is more promising than cracking down on informal trade with Nigeria. The latter largely depends on Nigeria adopting more sensible policies, while the former is much more within Benin’s own control. In terms of the availability of resources, there is no need to eradicate informal trade with Nigeria for Benin to expand formal production of goods and services. There are plenty of under-employed people who will gladly switch to better-paying and less hazardous formal-sector jobs if these were to be created. The binding constraint is the adverse business climate that deters foreign and domestic investments in productive activities. Improvements in the business climate in turn require better governance. The question then is whether the pervasiveness of informality precludes reforms to the business climate. There is obvious cause for concern in this regard. Despite some significant improvements in trade facilitation, little progress has been made in improving governance and reducing corruption. There are numerous interest groups that benefit from and perpetuate Benin’s high level of corruption who will oppose efforts to create a more inclusive and transparent business climate. It remains to be seen if President Talon has the vision and leadership skills to catalyse reforms of the business environment that support formal investment. His background as a successful entrepreneur in the cotton sector is promising. An important symbolic step would be for Benin to join ACFTA.
Benin–Nigeria relations are based on close ties reinforced by the disparities created by historical, geographical, and colonial factors. These disparities were amplified by the discovery of oil in Nigeria in the 1950s and the spread of oil revenue in neighbouring countries. For Benin, the result was the adoption of a re-exporting policy introduced in 1973 by the revolutionary government, to take better advantage of Nigeria’s oil revenue. This re-exporting system, which turned the country into an ‘entrepôt state’, has remained in force to this day, despite the various upheavals the country has gone through.
Benin–Nigeria relations also play an important and specific role in the Beninese economy. As such, they have long been the subject of comprehensive studies by various authors, particularly within the Regional Analysis and Social Expertise Laboratory (LARES). From this perspective, the study presented by Golub and Mbaye is interesting because of the specific approach they take; that is, analysing the institutional constraints. Rather than discussing, refining, or adding to some of the points they raise, the discussion here will primarily focus on the future prospects of Benin–Nigeria relations, based on the current situation of the Benin economy. Section I will cover the difficulties facing the Beninese economy following the economic slowdown in Nigeria, and Section II will cover the strategies to be developed for the future.
I The Impact of Benin–nigeria Trade Relations on Benin’s Economic Sector
Despite the enormous benefits of Benin–Nigeria trade relations for the population and public revenues, they constitute serious obstacles to vital sectors of the economy. For the public, re-exporting and imports from Nigeria are the main activities, both in cities and in the border regions. As regards public revenues, the activities of customs authorities, and even the tax department, largely depend on these relations. As for the vital sectors of the economy, the competitiveness of the Nigerian market compared to the Beninese market paralyses industrial activity. Various economic sectors are the victim of the trade relations between Benin and Nigeria. The most affected are industry, distribution, and transport. In the industrial sector, the most affected sectors are manufacturers of reinforced concrete and the food industries, including Société Béninoise de Brasseries (SOBEBRA), the Beninese brewing company. Still in the food sector, fish farmers, such as the company Cossi et Fils, which specialises in breeding catfish, have seen a significant slowdown in their activities, as there are fewer and fewer Nigerian customers, the main buyers of these catfish. On top of these difficulties, sellers of imported fabrics, such as Indian merchants located along Avenue Delorme, who sell lace and printed fabrics from China, no longer see large numbers of Nigerian buyers in their shops. Even Walkden, which specialises in selling wax fabric, is no longer immune. These leading merchants from the Dantopka market no longer sell in the quantities they used to.
But the main difficulty for industry arising from the Nigerian financial crisis of recent years is that borne by the cement sector, which faces stiff competition from cement from Nigeria, which is sold along the border at CFA Francs 50,000 per tonne, versus CFA Francs 65,000 per tonne for cement produced in Beninese factories. Given the importance of having your own home in Benin, this trade in cement is likely to lead to the same result as occurred in the trade in Kpayo petrol: it will destroy the cement factories in Benin.
All these crisis situations and collapsing sales weigh heavily on public revenues and people’s living standards. In terms of public revenues, these are measured by customs revenues and the taxation of re-exporting activities, as well as the level of taxes paid by private companies. These revenues form the basis of the state’s resources.
As regards the consequences of Benin–Nigeria trade relations for the public, these can be assessed in two ways. On the one hand, there are the negative consequences of the state’s inability to ensure the vital needs of the population, which are partially met by the extraordinary development of the informal sector. On the other hand, these consequences can also be analysed positively in relation to the competitiveness of the Nigerian market, which is very popular with the Beninese public. Nigerian goods are cheaper, thereby enhancing the purchasing power of the Beninese. The markets for Kpayo petrol, beverages, and building materials imported from Benin’s eastern neighbour also work in the same way. These products are less expensive, allowing Beninese to save money.
II The Future of Benin–nigeria Trade Relations
The future of Benin–Nigeria trade relations depends on the envisaged strategies for improving trade relations with Nigeria and preserving the competitiveness of the Beninese economy vis-à-vis its neighbour to the east. These strategies concern both the administrative authorities and the economic actors themselves.
A The Strategies of the Administrative Authorities
As regards the strategies that should be adopted by the Beninese government, we can identify six different strands.
First, better organising Benin’s economy around promising sectors, such as strengthening the service economy, for which people based in Nigeria (including ECOWAS managerial staff and international institutions) will need Benin (efficient educational institutions, benchmark health centres, a state-of-the-art communication system with an innovative and efficient financial system, etc.).
Second, improving and promoting the agricultural sectors that are in high demand in Nigeria, including soybeans, maize, pineapples, and livestock.
Third, better organising the actors of this economy, who are currently trying to penetrate the Nigerian market without any discernible plan, only an individualistic strategy, which means it is not possible to ensure the supply and quality of Beninese products on the Nigerian market. The aim should be to organise these actors into cooperatives for each promising sector, to forge links with Nigerian economic operators in order to better negotiate the conditions for selling Beninese products in Nigeria.
Fourth, setting up new bilateral cooperation instruments. Benin–Nigeria cooperation is governed by several bilateral agreements concluded within the framework of the Benin–Nigeria Commission, which meets periodically. Despite the existence of this legal framework, cooperation between Benin and Nigeria does not always meet the expectations of the public of these two countries, who have set up several cross-border cooperation associations in the border corridors. For Nigerian and Beninese companies, the free movement of people and goods rings hollow. They want these cooperation instruments to insist on ending the harassment of traders, that new infrastructure be put in place along the border, such as central purchasing offices and storage warehouses, and that road crossings are cleaned up.
Fifth, setting up a new CFA Franc–NGN exchange rate mechanism, by:
securing funds that need to be transported, better guaranteeing the system for transaction payments; and
a comprehensive reflection between the two countries to better stabilise the exchange rate between the CFA Franc and the Naira.
Sixth, setting up a new Benin–Nigeria trade observatory, which has become necessary and urgent in order to better monitor the impact of the policies pursued by neighbouring countries on Benin’s development.
B The Strategies of Economic Actors
Various economic actors who would like to do business in Nigeria have very little knowledge of the country and how its market functions. To correct this, it is vital for Beninese economic operators to do the following:
Set up a mechanism for consultation and partnership between the chambers of commerce of the two countries, to resolve the problems of susceptibility linked to mutual mistrust. Beninese economic operators should also participate in initiatives that bring economic actors together in the region, such as that of Nextport Trade, a company that brings together businesspeople looking to move into the regional market.
Create cross-border cooperation associations involving all the economic actors who are active in the border corridors, in order to better secure and facilitate the movement of people and goods.
Better inform entrepreneurs in Benin about how Nigerian companies operate, and about strategies to access the market. Entrepreneurs also need to accept to adjust their prices on the Beninese market, to be better able to respond to the Nigerian competition.
Benin–Nigeria trade relations will remain dynamic regardless of the crises affecting Nigeria and the reforms undertaken by the country. There are two reasons for this dynamism. The first is the proximity of the capital Lagos, which has a population larger than Benin’s. (We are talking about an urban area where the purchasing power of the public is always higher than that of the Beninese, no matter how much the Naira falls.) The second reason is the fact that the reforms being implemented in Nigeria do not always take into account the fact that the statistical data in this country are approximations, resulting in fairly large margins that can be captured through local relations.
Nigerians are well aware of this, which is why at the public level everyone is interested in the relations between Benin and Nigeria. But in order for these relations to function properly, Benin needs to be attentive to all the developments going on in Nigeria, and to adjust its diplomatic economic policy accordingly.


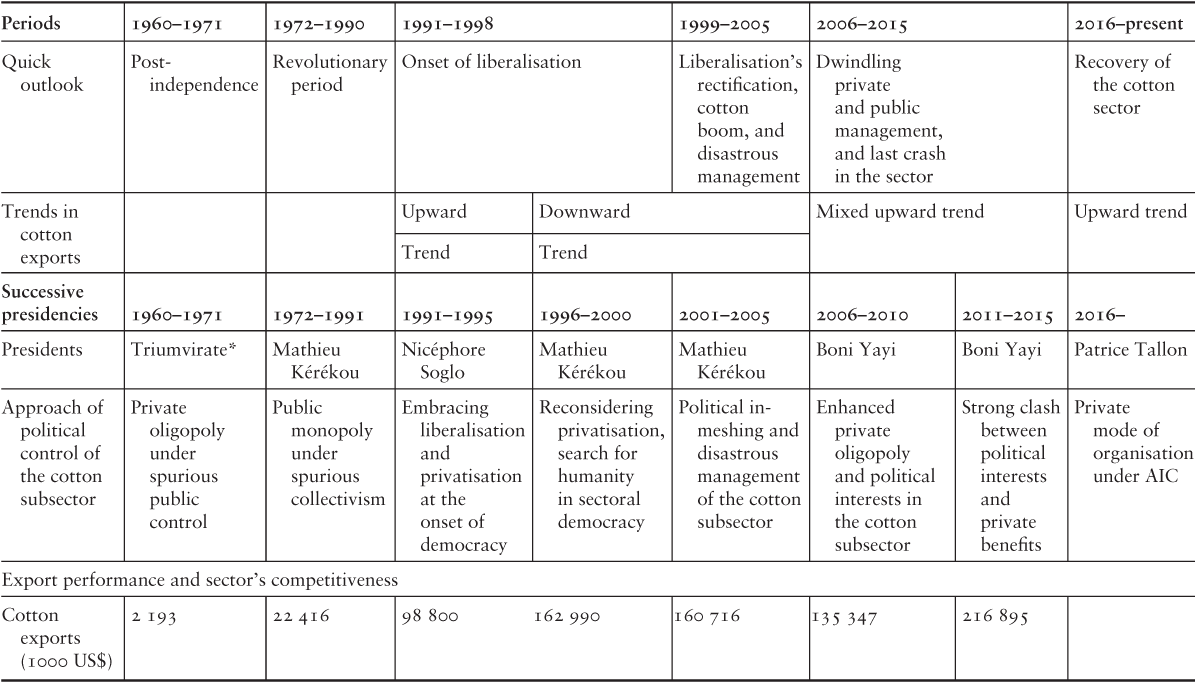


 Open access