Hostname: page-component-cd9895bd7-jkksz Total loading time: 0 Render date: 2024-12-24T00:12:59.602Z Has data issue: false hasContentIssue false

Snap-through dynamics of a buckled flexible filament in a uniform flow

Published online by Cambridge University Press:  22 August 2023
Qian Mao
Affiliation:
Key Laboratory of Education Ministry for Power Machinery and Engineering, School of Mechanical Engineering, Shanghai Jiao Tong University, 800 Dongchuan Road, Shanghai 200240, China Department of Mechanical Engineering, KAIST, 291 Daehak-ro, Yuseong-gu, Daejeon 34141, Korea
Yingzheng Liu
Affiliation:
Key Laboratory of Education Ministry for Power Machinery and Engineering, School of Mechanical Engineering, Shanghai Jiao Tong University, 800 Dongchuan Road, Shanghai 200240, China
Hyung Jin Sung*
Affiliation:
Department of Mechanical Engineering, KAIST, 291 Daehak-ro, Yuseong-gu, Daejeon 34141, Korea
*
Email addresses for correspondence: [email protected]

Abstract

The flow-induced snap-through dynamics of a buckled flexible filament was explored using the penalty immersed boundary method. The effects of the filament length, bending rigidity and Reynolds number on the mode transition were systematically examined. Three different modes were observed when the aforementioned parameters were varied: an equilibrium mode, a streamwise oscillation mode and a snap-through oscillation mode. Two mode transitions occurred when the bending rigidity was lowered and the length and Reynolds number were increased: a direct transition from the equilibrium mode to the snap-through oscillation mode and the successive appearance of the three modes. An increase in transverse fluid force induced the snap-through oscillation mode. A vortex-induced vibration and a self-excited vibration occurred in the streamwise oscillation mode and the snap-through oscillation mode, respectively. A wake pattern of 2S appeared in the streamwise oscillation mode, and a pattern of 2S + 2P appeared in the snap-through oscillation mode. A hysteresis was observed near the critical Reynolds number. The hysteresis loop increased in magnitude with increasing bending rigidity. The greater energy harvesting was achieved by the larger deflection and the higher strain energy. We found that most of the strain energy was concentrated in the last half of the filament.

Type
JFM Papers
Copyright
© The Author(s), 2023. Published by Cambridge University Press

1. Introduction

Flow-induced vibration of flexible structures has received much attention because of its applications in energy harvesting. The conversion of strain energy into electrical energy can be achieved via piezoelectric materials attached to a surface. Snap through, which is a rapid transition from one equilibrium state to another, is ubiquitous in nature and everyday life (e.g. rapid closure of a Venus flytrap (Forterre et al. Reference Forterre, Skotheim, Dumais and Mahadevan2005) or a sudden upward flip of an umbrella in wind (Gomez, Moulton & Vella Reference Gomez, Moulton and Vella2017a)). The flow-induced snap-through oscillation of a buckled elastic sheet is useful for energy harvesting (Kim et al. Reference Kim, Zhou, Kim and Oh2020, Reference Kim, Lahooti, Kim and Kim2021a). The buckled sheet exhibits large deflection with high strain energy during periodic oscillation. The energy harvesting performance is closely related to its snap-through dynamics in the surrounding flow.

Considerable research effort has been devoted to various flow-induced vibrations of a flag (or plate/filament), including self-excited vibration, forced vibration and vortex-induced vibration (Yu, Liu & Amandolese Reference Yu, Liu and Amandolese2019). The self-excited vibration of a conventional flag occurs depending on the flow velocity, flag's length, bending rigidity and flag-to-liquid mass ratio (Taneda Reference Taneda1968; Zhang et al. Reference Zhang, Childress, Libchaber and Shelley2000; Shelley, Vandenberghe & Zhang Reference Shelley, Vandenberghe and Zhang2005; Michelin, Smith & Glover Reference Michelin, Smith and Glover2008; Banerjee, Connell & Yue Reference Banerjee, Connell and Yue2015; Cisonni et al. Reference Cisonni, Lucey, Elliott and Heil2017). Instability of the flag is induced by a constructive interaction between the flag's movement and the aero/hydrodynamic load (i.e. a positive feedback among inertial force, elastic force and fluid force). Most energy harvesting devices have been developed on the basis of the self-excited vibration, even though the critical flow velocity activating the vibration is relatively high (Tang, Païdoussis & Jiang Reference Tang, Païdoussis and Jiang2009; Michelin & Doaré Reference Michelin and Doaré2013; Xia, Michelin & Doaré Reference Xia, Michelin and Doaré2015; Yu & Liu Reference Yu and Liu2016). Next, the critical flow velocity can be reduced by upstream installation of a bluff body, enhancing the instability in a wider range of flow velocity (Allen & Smits Reference Allen and Smits2001; Taylor et al. Reference Taylor, Burns, Kammann, Powers and Welsh2001; Manela & Howe Reference Manela and Howe2009; Gilmanov, Le & Sotiropoulos Reference Gilmanov, Le and Sotiropoulos2015; Hu et al. Reference Hu, Yang, Chen, Wang and Liu2018; Furquan & Mittal Reference Furquan and Mittal2021). Vortices shed from the bluff body give rise to a forced vibration with a higher vibration frequency and a lower vibration amplitude than those of the self-excited vibration. To avoid the additional bluff body, Kim et al. (Reference Kim, Cossé, Cerdeira and Gharib2013) proposed an inverted flag to reduce the critical flow velocity. The inverted flag is more unstable because of the leading- and trailing-edge vortices shed from the flag, which results in a vortex-induced vibration with high vibration amplitude and high mean strain energy. Some studies have also considered the flapping of heavy inverted flags as a form of self-excited vibration (Tavallaeinejad et al. Reference Tavallaeinejad, Païdoussis, Salinas, Legrand, Kheiri and Botez2020, Reference Tavallaeinejad, Salinas, Païdoussis, Legrand, Kheiri and Botez2021). Due to its strong vibration, the inverted flag has been found to be a promising candidate for energy harvesting applications but in a limited range (Gurugubelli & Jaiman Reference Gurugubelli and Jaiman2015; Ryu et al. Reference Ryu, Park, Kim and Sung2015; Tang, Liu & Lu Reference Tang, Liu and Lu2015; Sader et al. Reference Sader, Cossé, Kim, Fan and Gharib2016a,Reference Sader, Huertas-Cerdeira and Gharibb; Orrego et al. Reference Orrego, Shoele, Ruas, Doran, Caggiano, Mittal and Kang2017; Yu, Liu & Chen Reference Yu, Liu and Chen2017). On the other hand, the initial inclination angle (Shoele & Mittal Reference Shoele and Mittal2016; Lim & Park Reference Lim and Park2022) and oscillating incoming flow (Mazharmanesh et al. Reference Mazharmanesh, Young, Tian, Ravi and Lai2022) enhance the energy harvesting performance more effectively. Note that the strain energy of the inverted flag is very low when the flag returns to its initial state.

The snap-through oscillation of a buckled elastic sheet with two clamped edges provides a solution that increases the low strain energy. Considerable strain energy is stored in the sheet because of the large deflection of the initial shape. The buckled sheet has been used for energy harvesting, where it demonstrated a much higher output voltage than the unbuckled one (Jung & Yun Reference Jung and Yun2010; Cottone et al. Reference Cottone, Gammaitoni, Vocca, Ferrari and Ferrari2012; Boisseau et al. Reference Boisseau, Despesse, Monfray, Puscasu and Skotnicki2013; Zhu & Zu Reference Zhu and Zu2013; Bai et al. Reference Bai, Liao, Chen, Gan, Zou, Wei, Gu and Zheng2022). In these studies, an external input was required to activate the snap-through oscillation. Recently, Kim et al. (Reference Kim, Zhou, Kim and Oh2020) investigated an energy harvester based on flow-induced snap-through oscillation. They performed experiments to examine the critical conditions and snap-through dynamics (Kim et al. Reference Kim, Lahooti, Kim and Kim2021a; Kim, Kim & Kim Reference Kim, Kim and Kim2021b). According to these studies, the fluid force increases with increasing flow velocity, inducing the snap-through oscillation. The critical flow velocity is length dependent but insensitive to the mass ratio; a mode transition from equilibrium to snap-through oscillation is caused by the divergence instability. The vibration mode remains unchanged irrespective of the flow velocity. In addition, the snap-through oscillation of the sheet leads to flow separation and consequent vortex shedding. However, few numerical studies of the transition to snap-through oscillation of a buckled flexible filament have been reported. Numerical simulation is advantageous to parametric and quantitative analyses in fluid–flexible structure interaction. In particular, the immersed boundary (IB) method has been widely adopted to handle the interaction (Huang, Shin & Sung Reference Huang, Shin and Sung2007; Huang & Sung Reference Huang and Sung2010; Ryu et al. Reference Ryu, Park, Kim and Sung2015; Park, Ryu & Sung Reference Park, Ryu and Sung2019). More importantly, the influence of the bending rigidity and the relation between the mode transition and vortex shedding of a buckled filament have not yet been fully elucidated and warrant a more detailed investigation.

The objective of the present study is to explore the snap-through dynamics of a buckled flexible filament using the penalty IB method. The effects of the bending rigidity (${\gamma _{{L_0}}}$), length ($L$) and Reynolds number ($Re$) on the mode transition are examined. Three different modes are observed: an equilibrium mode, a streamwise oscillation mode and a snap-through oscillation mode. The transverse displacement of the intersection between the filament and the line $x = 0$ (${y_{x = 0}}$), oscillation amplitude ($A$) and frequency ( ${f_{{y_\textrm{m}}}}$) are used to identify different oscillation modes. A scaling is performed on ${y_{x = 0}}$, A, ${f_{{y_\textrm{m}}}}$ and ${\gamma _{{L_0}}}$. The instability mechanism is characterized in terms of the fluid force, elastic force and wake pattern. The relation between the filament's oscillation and vortex shedding is explored. A hysteresis near the critical Reynolds number is analysed. In addition, the energy harvesting performance is estimated via measurements of the deflection and strain energy of the filament.

2. Computational model

2.1. Problem formulation

A schematic of the buckled flexible filament with two clamped edges in a uniform flow is shown in figure 1. The computational domain is $- 10{L_0} \le x \le 22{L_0}$ and $- 8{L_0} \le y \le 8{L_0}$, where x and y represent the streamwise and transverse directions, respectively. The initial buckled shape is symmetric around $x = 0$. Here, ${U_0}$ is the free-stream velocity, ${L_0}$ and L are the distance between two clamped edges and the length of the filament, respectively, where ${L_0}$ is set to be shorter than L to achieve an initial buckled shape and ${w_0}$ is the initial height of the filament without flow, which is close to one-half of the maximum transverse displacement of the filament during snap-through oscillation. The motion of the fluid is defined on a fixed Cartesian grid. Dirichlet boundary conditions ($u = {U_0}$, $v = 0$) are imposed at the inlet, top and bottom boundaries. A Neumann-type boundary condition ($\partial \boldsymbol{u}/\partial x = 0$) is specified at the outlet. The initial conditions are $u = {U_0}$, $v = 0$ and $p = 0$. The motion of the filament is defined on a moving Lagrangian grid under a curvilinear coordinate system ($s$).

Figure 1. Schematic of the buckled flexible filament in a uniform flow.

The incompressible viscous fluid flow is governed by the Navier–Stokes (N–S) equations and the continuity equation, which are dimensionless:

(2.1)\begin{gather}\frac{{\partial \boldsymbol{u}}}{{\partial t}} + \boldsymbol{u}\boldsymbol{\cdot }\boldsymbol{\nabla u} ={-} \boldsymbol{\nabla }p + \frac{1}{{Re}}{\nabla ^2}\boldsymbol{u} + \sum \boldsymbol{f} ,\end{gather}
(2.2)\begin{gather}\boldsymbol{\nabla }\boldsymbol{\cdot }\boldsymbol{u} = 0,\end{gather}

where $\boldsymbol{u} = (u,v)$ is the velocity vector, p is the pressure and $\boldsymbol{f} = (\,{f_x},{f_y})$ is the momentum forcing to enforce the no-slip condition along the IB. The value of $Re$ is expressed as $Re = {\rho _0}{U_0}{L_0}/\mu $, where ${\rho _0}$ and $\mu $ are the fluid density and the dynamic viscosity, respectively. Equations (2.1) and (2.2) are non-dimensionalized using the following characteristic scales: ${L_0}$ for the length, ${U_0}$ for the velocity, ${L_0}/{U_0}$ for the time, ${\rho _0}U_0^2$ for the pressure and ${\rho _0}U_0^2/{L_0}$ for the feedback momentum forcing $\boldsymbol{f}$. The dimensionless quantities are written in the same form as their dimensional counterparts for convenience.

The movement of the filament is governed by the motion equation and the inextensibility condition, which are dimensionless

(2.3)\begin{gather}\frac{{{\partial ^2}\boldsymbol{X}}}{{\partial {t^2}}} = \frac{\partial }{{\partial s}}\left( {T\frac{{\partial \boldsymbol{X}}}{{\partial s}}} \right) - \frac{{{\partial ^2}}}{{\partial {s^2}}}\left( {{\gamma_{{L_0}}}\frac{{{\partial^2}\boldsymbol{X}}}{{\partial {s^2}}}} \right) - {\boldsymbol{F}_f},\end{gather}
(2.4)\begin{gather}\frac{{\partial \boldsymbol{X}}}{{\partial s}} \boldsymbol{\cdot} \frac{{\partial \boldsymbol{X}}}{{\partial s}} = 1,\end{gather}

where s ranges from 0 to L, $\boldsymbol{X} = (X(s,t),Y(s,t))$ is the displacement, T is the tension coefficient along the filament axis and ${\gamma _{{L_0}}}$ is the bending rigidity. Here, ${\boldsymbol{F}_s} = (\partial /\partial s)(T(\partial \boldsymbol{X}/\partial s)) - ({\partial ^2}/\partial {s^2})({\gamma _{{L_0}}}({\partial ^2}\boldsymbol{X}/\partial {s^2}))$ is the elastic force of the filament, and ${\boldsymbol{F}_f} = ({F_{fx}}(s),{F_{fy}}(s))$ denotes the Lagrangian forcing exerted on the filament by the surrounding fluid. Equations (2.3) and (2.4) were non-dimensionalized using the following characteristic scales: ${L_0}$ for the length, ${L_0}/{U_0}$ for the time, ${\rho _1}U_0^2/{L_0}$ for the Lagrangian forcing ${\boldsymbol{F}_f}$, ${\rho _1}U_0^2$ for the tension coefficient $T$ and ${\rho _1}U_0^2L_0^2$ for the bending rigidity ${\gamma _{{L_0}}}$. Parameter ${\rho _1}$ denotes the density difference between the filament and the surrounding fluid. The actual filament line density is ${\rho _s} = {\rho _1} + {\rho _0}A$, where ${\rho _0}$ is the density of fluid and A denotes the sectional area of the filament. The dimensionless quantities are written in the same form as their dimensional counterparts for convenience. In the present study, the bending rigidity ${\gamma _{{L_0}}}$ is assumed to be constant, whereas the tension coefficient T is determined by the constraint of inextensibility, is a function of s and $t$ and is solved by the Poisson equation for T (Huang et al. Reference Huang, Shin and Sung2007).

At two fixed edges ($\boldsymbol{X} = ( - {L_0}/2,0)$ and $({L_0}/2,0)$ at $s = 0$ and L, respectively), clamped boundary conditions are applied

(2.5a,b)\begin{equation}\frac{{\partial \boldsymbol{X}}}{{\partial s}} = (1,0)\quad \textrm{at}\ s = 0,\quad \frac{{\partial \boldsymbol{X}}}{{\partial s}} = ( - 1,0)\quad \textrm{at}\ s = L.\end{equation}

The boundary of the filament and the massless boundary (IB) are strongly connected by a virtual stiff spring. The Lagrangian forcing ${\boldsymbol{F}_\textrm{f}}$ can be calculated by the feedback law (Goldstein, Handler & Sirovich Reference Goldstein, Handler and Sirovich1993)

(2.6)\begin{equation}{\boldsymbol{F}_f} = \alpha \int_0^t {({\boldsymbol{U}_{ib}} - \boldsymbol{U})\,\textrm{d}t^{\prime}} + \beta ({\boldsymbol{U}_{ib}} - \boldsymbol{U}),\end{equation}

where $\alpha $ and $\beta $ are large negative free constants (Shin, Huang & Sung Reference Shin, Huang and Sung2008), ${\boldsymbol{U}_{ib}}$ is the fluid velocity obtained by interpolation at the IB and $\boldsymbol{U}$ is the velocity of the filament expressed by $\boldsymbol{U} = \textrm{d}\kern0.7pt \boldsymbol{X}/\textrm{d}t$.

The Dirac delta function is used to carry out the transformation between the Eulerian and Lagrangian variables (Peskin Reference Peskin2002). The velocity ${\boldsymbol{U}_{ib}}$ obtained by interpolation is expressed as

(2.7)\begin{equation}{\boldsymbol{U}_{ib}}(s,\ t) = \int_\varOmega {\boldsymbol{u}(\boldsymbol{x},\ t)\,\delta (\boldsymbol{X}(s,\ t) - \boldsymbol{x})\,\textrm{d}\kern0.7pt \boldsymbol{x}} .\end{equation}

The Eulerian momentum forcing $\boldsymbol{f}$ obtained by spreading the Lagrangian forcing ${\boldsymbol{F}_f}$ to the nearby Eulerian grids is expressed as

(2.8)\begin{equation}\boldsymbol{f}(\boldsymbol{x,}\ t) = \rho \int_\varGamma {{\boldsymbol{F}_{f}}(s,\ t)\, \delta (\boldsymbol{x} - \boldsymbol{X}(s,\ t))\,\textrm{d}s} ,\end{equation}

where $\rho = {\rho _1}/({\rho _0}{L_0}) = 1$ arises from non-dimensionalization. The elastic strain energy ${E_s}(t)$ is defined by

(2.9)\begin{equation}{E_s}(t) = \int_\varGamma {0.5\gamma K\,\textrm{d}s} ,\end{equation}

where $K(s,t) = {({\partial ^2}\boldsymbol{X}/\partial {s^2})^2}$ is the square of the curvature.

The fractional step method on a staggered Cartesian grid is used to solve the N–S equations (Kim, Baek & Sung Reference Kim, Baek and Sung2002). A direct numerical method developed by Huang et al. (Reference Huang, Shin and Sung2007) is used to calculate the filament motion. Details regarding the discretization of the governing equations and numerical method can be found in the works of Kim et al. (Reference Kim, Baek and Sung2002) and Huang et al. (Reference Huang, Shin and Sung2007).

2.2. Validation

Table 1 shows the results of the domain test for ${L_0}/L = 0.589$, ${\gamma _{{L_0}}} = 0.005$ and $Re = 200$ (snap-through oscillation mode), including the averaged drag coefficient ${\bar{C}_D}$, the root mean square of the lift coefficient ${C_{L\ rms}}$, the Strouhal number $St$${f_{{y_m}}}{L_0}/{U_0}$) and the relative error $\varepsilon $; ${f_{{y_m}}}$ is the oscillation frequency of the filament undergoing snap-through oscillation, and ${y_m}$ is the transverse displacement of the midpoint of the filament. The result for the $32 \times 16$ domain agrees well with those for the $32 \times 24$ and $64 \times 16$ domains. The domain size $32 \times 16$ was selected to improve the accuracy of the present simulation. In addition, the sensitivity of the results to the grid resolution and time step is examined in figure 2. The results for $\Delta x = 1/128$ and $\Delta t = 2 \times {10^{ - 4}}$ agree well with those for $\Delta x = 1/256$ and $\Delta t = 0.5 \times {10^{ - 4}}$, respectively. The result does not converge for $\Delta t > 2 \times {10^{ - 4}}$. The grid resolution of 1/128 and a time step of $2 \times {10^{ - 4}}$ were chosen to ensure sufficiently high accuracy of the simulation. The maximum Courant number was ~0.04. The grid resolution of the filament was the same as that of the domain. The domain grid was uniformly distributed along the x-axis but was stretched along the y-axis. The grid size of the domain in $- Y/4 \le y \le Y/4$ was $\Delta y = \Delta x$, where Y is the domain height.

Table 1. Domain test, including the averaged drag coefficient ${\bar{C}_D}$, the root mean square of the lift coefficient ${C_{L\ rms}}$, the Strouhal number $St$ and the relative errors $\varepsilon $ with respect to the domain $32 \times 24$ in I and $64 \times 16$ in II for ${L_0}/L = 0.589$, ${\gamma _{{L_0}}} = 0.005$ and $Re = 200$.

Figure 2. Time histories of the transverse displacement of the midpoint of the filament (${y_m}$) for different (a) grid resolutions and (b) time steps (${L_0}/L = 0.589$, ${\gamma _{{L_0}}} = 0.005$, $Re = 200$).

3. Results and discussion

The buckled flexible filament initially exhibits fore–aft symmetry in the absence of fluid flow. Equation (2.3) was initially solved without the Lagrangian forcing. The initial shape is obtained from the average due to the small fluctuations of the filament. Figure 3 shows the initial height (${w_0}/L$) as ${L_0}/L$ is varied and the initial shape for ${L_0}/L = 0.5$, 0.6 and 0.75 (${\gamma _{{L_0}}} = 0.01$). The value of ${w_0}/L$ decreases with increasing ${L_0}/L$. The experimental data of Kim et al. (Reference Kim, Lahooti, Kim and Kim2021a) are included for comparison $(0.0016 \le {\gamma _{{L_0}}} \le 0.0108)$. The present results show good agreement with the experimental data, validating the results of the present simulation.

Figure 3. (a) Initial height (${w_0}/L$) of the buckled flexible filament as a function of ${L_0}/L$. (b) Initial buckled shapes for different ${L_0}/L$; the red and grey lines represent the results of the present study and the experimental results of Kim et al. (Reference Kim, Lahooti, Kim and Kim2021a), respectively.

3.1. Effects of the length and bending rigidity

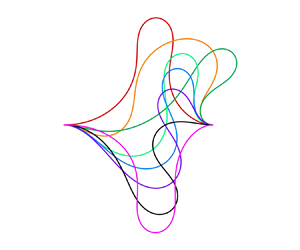
In the present study, three different modes are observed: an equilibrium (E) mode, a streamwise oscillation (SO) mode and a snap-through oscillation (STO) mode. The superposition of instantaneous shapes in these three modes is shown in figure 4 ($Re = 100$). In figure 4(a), three short filaments (${L_0}/L = 0.8$) with different bending rigidities (${\gamma _{{L_0}}}$) exhibit the E mode; the shape of the filaments is constant in time. The filament shape with relatively high bending rigidity (${\gamma _{{L_0}}} = 0.03$) is similar to the filament's initial symmetric shape. The filament moves downstream as ${\gamma _{{L_0}}}$ decreases; the front part gradually approaches $y = 0$. In figure 4(b), a longer filament (${L_0}/L = 0.5$, ${\gamma _{{L_0}}} = 0.02$) exhibits the SO mode, deviating from its initial shape and undergoing a periodic streamwise oscillation without crossing $y = 0$. Time histories of ${x_m}$ and ${y_m}$ for ${\gamma _{{L_0}}} = 0.02$ are shown in figure 5(a). In figure 4(c), a soft filament (${L_0}/L = 0.5$, ${\gamma _{{L_0}}} = 0.01$) displays the STO mode, periodically crossing $y = 0$ with high oscillation amplitude. The STO mode encompasses both a snapping motion from upside/downside to downside/upside and a streamwise shift between two snapping motions, generated by decreasing ${\gamma _{{L_0}}}$ and ${L_0}/L$. Figure 5(b,c) shows the time histories of ${x_m}$ and ${y_m}$ and a sequential process of STO for ${L_0}/L = 0.5$ and ${\gamma _{{L_0}}} = 0.01$ ($\delta = 4000\Delta t$). The filament shifts downstream from moment A to moment B, with a decrease of ${y_m}$ and an increase of ${x_m}$. A local minimum of ${y_m}$ is obtained at B. The front part gradually crosses $y = 0$, inducing a snapping motion from the upside to the downside from B to C (${y_m}$ first slowly increases and then rapidly decreases). A local maximum of ${y_m}$ is obtained between B and C. Accordingly, the streamwise shift produces two peaks of ${y_m}$ in a half-period. Beyond C, the filament shifts downstream again. An ‘S’ shape with large deflection is shown in the snapping motion. The oscillation process is not changed irrespective of ${\gamma _{{L_0}}}$, ${L_0}/L$ and $Re$.

Figure 4. Superposition of the instantaneous shapes of the filament in (a) equilibrium mode (${L_0}/L = 0.8$, ${\gamma _{{L_0}}} = 0.0058$, 0.008, 0.03), (b) streamwise oscillation mode (${L_0}/L = 0.5$, ${\gamma _{{L_0}}} = 0.02$) and (c) snap-through oscillation mode (${L_0}/L = 0.5$, ${\gamma _{{L_0}}} = 0.01$).

Figure 5. Time histories of ${x_m}$ and ${y_m}$ in (a) streamwise oscillation mode (${L_0}/L = 0.5$, ${\gamma _{{L_0}}} = 0.02$) and (b) snap-through oscillation mode (${L_0}/L = 0.5$, ${\gamma _{{L_0}}} = 0.01$). (c) The sequential process of snap-through oscillation (${L_0}/L = 0.5$, ${\gamma _{{L_0}}} = 0.01$).

We first examine the effects of the bending rigidity (${\gamma _{{L_0}}}$) and length (${L_0}/L$) on the mode transition. Figure 6 shows a mode diagram in the ranges $0.002 \le {\gamma _{{L_0}}} \le 0.04$ and $0.5 \le {L_0}/L \le 0.8$. Regions I, II and III represent the regimes of the E, SO and STO modes, respectively. The SO mode is observed only in a relatively long filament (${L_0}/L = 0.5$, 0.6). For ${L_0}/L = 0.5$, the SO mode is distributed in a wide range of ${\gamma _{{L_0}}}$. The three modes appear in succession with decreasing ${\gamma _{{L_0}}}$ for ${L_0}/L = 0.5$ and 0.6, whereas a direct transition from the E to the STO mode is observed for ${L_0}/L = 0.7$ and 0.8. The critical ${\gamma _{{L_0}}}$ for the transition to the SO or STO mode decreases with increasing ${L_0}/L$. Cases with and without vortex shedding are highlighted by red and blue in figure 6. Details of the wake pattern are discussed later. Note that vortex shedding is absent only in the E mode for ${L_0}/L = 0.7$ and 0.8. For these two lengths, vortex shedding occurs in the STO mode, suggesting that vortex shedding is caused by the snapping motion. For ${L_0}/L = 0.5$ and 0.6, vortex shedding precedes the onset of the SO mode. A transition from the STO to the E mode arises in a special case at ${\gamma _{{L_0}}} = 0.0002$ for the longest filament (${L_0}/L = 0.5$). The long filament undergoing a high streamwise fluid force is too soft to complete the snapping motion from B to C (figure 5c). Kim et al. (Reference Kim, Lahooti, Kim and Kim2021a) also found that a long filament does not exhibit the STO mode. Note that the longest filament only exhibits the transition when the bending rigidity is extremely small (${\gamma _{{L_0}}} = 0.0002$). The present STO mode is sustained in a wide range of ${\gamma _{{L_0}}}$ beyond the critical value.

Figure 6. Mode diagram depending on ${\gamma _{{L_0}}}$ and ${L_0}/L$; regions I, II and III correspond to the equilibrium mode, the streamwise oscillation mode and the snap-through oscillation mode, respectively. Blue and red markers represent the absence and the presence of vortex shedding in the wake, respectively.

The deflections in the E and SO modes (figures 4a,b) can be characterized by the transverse displacement of the intersection between the filament and the line $x = 0$ (${y_{x = 0}}$). Note that ${y_{x = 0}}$ in the E mode is constant, whereas ${y_{x = 0}}$ in the SO mode is obtained from the average. The decrease of ${y_{x = 0}}$ represents the streamwise and downward motions of the front part in figure 4(a). In figure 7(a), ${y_{x = 0}}$ first slowly and then rapidly decreases with decreasing ${\gamma _{{L_0}}}$ for each ${L_0}/L$, showing a behaviour similar to that observed by Kim et al. (Reference Kim, Lahooti, Kim and Kim2021a) with increasing flow velocity. A non-dimensionalized bending rigidity ${\gamma _{{L_0}}} = \gamma /({\rho _1}U_0^2L_0^2)$ is defined by the ratio of the bending force to the fluid force. Either a decrease of $\gamma $ or an increase of ${U_0}$ gives rise to a decrease of ${\gamma _{{L_0}}}$. The STO mode appears beyond the end of the curves in figure 7(a). The oscillation amplitude ($A$) defined by the maximum transverse displacement is another length parameter that can be used to identify the oscillation mode. As shown in figure 7(b), A is ignored when $A/{L_0} < 0.01$. In the E mode, $A = 0$. In the SO mode, A increases and then decreases with decreasing ${\gamma _{{L_0}}}$. A sudden increase in A is observed when the change to the STO mode occurs, at which A is close to $2{w_0}$. Afterward, A slowly decreases with decreasing ${\gamma _{{L_0}}}$.

Figure 7. (a) The transverse displacement of the filament at $x = 0$ (${y_{x = 0}}$) as a function of ${\gamma _{{L_0}}}$ in the equilibrium mode and streamwise oscillation mode. (b) Oscillation amplitude ($A$) of the filament as a function of ${\gamma _{{L_0}}}$.

Figure 8(a) shows the power spectral density (PSD) of ${y_m}$ and ${x_m}$ for ${\gamma _{{L_0}}} = 0.02$ (SO, ${L_0}/L = 0.5$) and 0.01 (STO, ${L_0}/L = 0.5$). For ${\gamma _{{L_0}}} = 0.02$, a peak is observed at ${f_{{y_m}}} = {f_{{x_m}}} = 0.208$, representing the streamwise oscillation frequency. For ${\gamma _{{L_0}}} = 0.01$, the PSD of ${y_m}$ shows two peaks at ${f_{{y_m}}} = 0.067$ and $3{f_{{y_m}}}$. Note that ${f_{{y_m}}}$ is the snapping frequency. Recall in figure 5(b) that the streamwise shift produces two peaks of ${y_m}$ in a half-period, even though the peaks are very small. The peak at $3{f_{{y_m}}}$ is caused by both the streamwise shift and the snapping motion. The PSD of ${x_m}$ shows a peak at ${f_{{x_m}}} = 2{f_{{y_m}}}$ with two harmonic frequencies ($2{f_{{x_m}}}$ and $3{f_{{x_m}}}$). The streamwise shift appears twice in one period of the snap-through oscillation (i.e. ${f_{{x_m}}}$ is the streamwise shift frequency). The snapping motion produces a local maximum of ${x_m}$ in a half-period in figure 5(b) (i.e. $2{f_{{x_m}}}$ is caused by the combination of the streamwise shift and the snapping motion). The value of ${f_{{y_m}}}$ in the SO mode is much greater than that in the STO mode, which is attributable to the much smaller oscillation amplitude in the SO mode. Accordingly, ${f_{{y_m}}}$ is a suitable parameter for mode identification. Figure 8(b) shows the variations of ${f_{{y_m}}}$ when ${\gamma _{{L_0}}}$ is varied for different ${L_0}/L$ (the E mode is not included). A sudden decrease is observed when the STO mode appears. In the SO mode, ${f_{{y_m}}}$ remains almost constant irrespective of ${\gamma _{{L_0}}}$. In the STO mode, ${f_{{y_m}}}$ slowly increases and then decreases with decreasing ${\gamma _{{L_0}}}$.

Figure 8. (a) Power spectral density (PSD) of ${y_m}$ and ${x_m}$ for ${L_0}/L = 0.5$, ${\gamma _{{L_0}}} = 0.02$ (streamwise oscillation mode) and 0.01 (snap-through oscillation mode). (b) Value of ${f_{{y_m}}}$ as a function of ${\gamma _{{L_0}}}$.

A new bending rigidity ${\gamma _L}$ is defined by $\gamma /{\rho _1}U_0^2{L^2}$ to incorporate the effects of $\gamma $ and L. The filament is easier to deform in the surrounding flow when $\gamma $ decreases and L increases. The value of ${\rho _1}U_0^2{L^2}$ is more suitable to represent the fluid force acting on the filament than ${\rho _1}U_0^2L_0^2$. For a flexible flag, L is generally selected as a reference length (Yu et al. Reference Yu, Liu and Amandolese2019). Figure 9 shows the variations of ${y_{x = 0}}/{w_0}$, $A/(2{w_0})$, and ${f_{{y_m}}}A/{U_0}$ as functions of ${\gamma _L}$. The E mode is not included in figure 9(c). The curves collapse onto a single curve as a whole. A critical bending rigidity for the transition to the STO mode is obtained near ${\gamma _{{L_c}}} = 0.0037$ irrespective of L. The initial height ${w_0}$ is close to one-half of the maximum A in the STO mode, which is ${y_{x = 0}}$ in the initial shape. In figure 9(a), most of the curves ${y_{x = 0}}/{w_0}$ end at the vertical fold points; that is, the instability follows a saddle-node bifurcation (Gomez, Moulton & Vella Reference Gomez, Moulton and Vella2017b; Kim et al. Reference Kim, Lahooti, Kim and Kim2021a). Here, ${L_0}/L = 0.5$ deviates substantially from the collapsed curve. This result is attributed to the large deformation of a long filament near the critical point, where the deformation is not linearly proportional to ${w_0}$. Such a deviation is also observed in figure 9(b) for the STO mode. In figure 9(c), ${L_0}/L = 0.8$ in the STO mode deviates from the collapsed curve. We found the snap-through oscillation near the critical point is relatively unstable in the shortest filament (${L_0}/L = 0.8$). This instability disappears with decreasing ${\gamma _L}$, accompanied by a small deviation from the collapse.

Figure 9. (a) Value of ${y_{x = 0}}/{w_0}$ as a function of ${\gamma _L}$ (bending rigidity non-dimensionalized by $0.5{\rho _1}U_0^2{L^2}$) in the equilibrium state and streamwise oscillation mode. (b) Value of $A/(2{w_0})$ as a function of ${\gamma _L}$. (c) Value of ${f_{{y_m}}}A/{U_0}$ as a function of ${\gamma _L}$.

We here further examine the wake pattern and pressure to characterize the instability mechanism. Figure 10 shows the instantaneous contours of vorticity (${\omega _z}$) and pressure ($p$) for ${L_0}/L = 0.8$ and ${\gamma _{{L_0}}} = 0.03$; ${L_0}/L = 0.8$ and ${\gamma _{{L_0}}} = 0.0058$; and ${L_0}/L = 0.6$ and ${\gamma _{{L_0}}} = 0.03$ in the E mode. For the short filament (${L_0}/L = 0.8$, ${\gamma _{{L_0}}} = 0.03$ and 0.0058), no vortex shedding appears. The positive/negative pressure at the front/back of the filament are caused by the squeezing/flow separation, respectively. For ${L_0}/L = 0.8$ and ${\gamma _{{L_0}}} = 0.03$, the averaged streamwise (${\bar{F}_{ftx}} = 0.302$) and transverse (${\bar{F}_{fty}} ={-} 0.182$) fluid forces induce the streamwise and downward motions, respectively. The averaged fluid force ${\bar{\boldsymbol{F}}_{ft}}$ is balanced by the averaged elastic force ${\bar{\boldsymbol{F}}_{st}}$ (${\boldsymbol{F}_{ft}} = \sum\nolimits_{s = 0}^L {\boldsymbol{F}(s)}$ and ${\boldsymbol{F}_{st}} = \sum\nolimits_{s = 0}^L {{\boldsymbol{F}_s}(s)} $ are the instantaneous fluid force (Lagrangian forcing) and elastic force, respectively). For ${L_0}/L = 0.8$ and ${\gamma _{{L_0}}} = 0.0058$, the larger deflection is observed because of the lower ${\gamma _{{L_0}}}$, resulting in a lower ${\bar{F}_{fx}}$ and higher $|{{{\bar{F}}_{fy}}} |$. The filament reaches a new equilibrium. Both $|{{{\bar{F}}_{fy}}} |$ and ${\bar{F}_{sy}}$ increase with decreasing ${\gamma _{{L_0}}}$ (table 2), showing a maximum at ${\gamma _{{L_0}}} = 0.0058$. A further decrease of ${\gamma _{{L_0}}}$ leads to a snapping motion due to the great deflection of the front part; no higher ${\bar{F}_{sy}}$ is available to balance ${\bar{F}_{fy}}$. For ${L_0}/L = 0.6$ and ${\gamma _{{L_0}}} = 0.03$, a Kármán vortex configuration appears, producing an enhanced negative pressure behind the filament. The unsteady fluid force acting on the filament is also enhanced, whereas the stiff filament suppresses the oscillation. For the flow behind a bluff body, vortex shedding appears when the Reynolds number exceeds a critical value (Berger & Wille Reference Berger and Wille1972; Monkewitz, Williamson & Miller Reference Monkewitz, Williamson and Miller1996). The present filament also shows the vortex shedding because of its ‘bluff’ shape. A new Reynolds number can be defined as $R{e_{{w_0}}} = {\rho _0}{U_0}{w_0}/\mu $ based on the filament's initial height (${w_0}$). The values of $R{e_{{w_0}}}$ for ${L_0}/L = 0.5$, 0.6, 0.7 and 0.8 are 72, 57, 44 and 33, respectively. A critical $R{e_{{w_0}}}$ for the appearance of vortex shedding before the onset of the STO mode lies between 57 and 44. The value of $R{e_{{w_0}c}}$ is obtained in the next section.

Figure 10. Instantaneous contours of (a) vorticity (${\omega _z}$) and (b) pressure ($p$) for ${L_0}/L = 0.8$ and ${\gamma _{{L_0}}} = 0.03$; ${L_0}/L = 0.8$ and ${\gamma _{{L_0}}} = 0.0058$; and ${L_0}/L = 0.6$ and ${\gamma _{{L_0}}} = 0.03$ in the equilibrium mode.

Table 2. Fluid force ${\bar{\boldsymbol{F}}_{ft}}$ and elastic force ${\bar{\boldsymbol{F}}_{st}}$ of the filament for different ${\gamma _{{L_0}}}$ (${L_0}/L = 0.8$).

A relatively long filament with moderate ${\gamma _{{L_0}}}$ displays a streamwise oscillation because of the vortex shedding. Figure 11 shows the time histories of ${x_m}$, streamwise fluid force ${F_{ftx}}$, streamwise elastic force ${F_{stx}}$, total streamwise force ${F_{tx}}$ (${F_{ftx}} + {F_{stx}}$) and instantaneous contours of ${\omega _z}$ and p in the SO mode for ${L_0}/L = 0.5$, ${\gamma _{{L_0}}} = 0.02$. The SO mode is dominated by the combined ${F_{ftx}}$ and ${F_{stx}}$. At moment A, ${F_{stx}}$ dominates ${F_{ftx}}$ (${F_{tx}} < 0$) because of the large deflection of the rear part, yielding an upstream motion; ${F_{stx}}$ decreases during the upstream motion, whereas the formation of a negative vortex leads to an increase in ${F_{ftx}}$, resulting in an increase in ${F_{tx}}$. The filament undergoes acceleration and deceleration before reaching its upstream stroke extreme at B. Beyond B, the filament moves downstream because of the positive ${F_{tx}}$. Recall that vortex shedding precedes the onset of the SO mode. The SO frequency ( ${f_{{x_m}}}$ or ${f_{{y_m}}}$) is the same as the vortex shedding frequency ${f_v}$ calculated from the transverse velocity v at (x, y) = (5, 0). The SO mode therefore represents a vortex-induced vibration.

Figure 11. (a) Time histories of ${x_m}$, streamwise fluid force ${F_{ftx}}$, streamwise elastic force ${F_{stx}}$ and total streamwise force ${F_{tx}}$ (${F_{ftx}} + {F_{stx}}$). Instantaneous contours of (b) ${\omega _z}$ and (c) p at A and B for ${L_0}/L = 0.5$ and ${\gamma _{{L_0}}} = 0.02$ in the streamwise oscillation mode.

A further decrease in ${\gamma _{{L_0}}}$ causes a greater deflection of the front part, inducing the STO mode. Figure 12 shows the instantaneous contours of ${\omega _z}$ and the PSD of v for ${L_0}/L = 0.7$ and ${\gamma _{{L_0}}} = 0.004$; ${L_0}/L = 0.6$ and ${\gamma _{{L_0}}} = 0.01$; and ${L_0}/L = 0.5$ and ${\gamma _{{L_0}}} = 0.01$. For ${L_0}/L = 0.7$ and ${\gamma _{{L_0}}} = 0.004$ in figure 12(a), a single vortex induced by the snapping motion (${V_{snap}}$) and the consequent pair of vortices (${V_P}$) appear in a half-period of the oscillation. This pattern is termed the ‘2S + 2P’ mode in the present study. The ${V_P}$ are caused by the interaction between two shear layers, where the interaction is induced by ${V_{snap}}$. A similar wake pattern is observed in three cases even though ${V_{snap}}$ is divided into two parts with increasing ${L_0}/L$, which might be caused by the increase of $R{e_{{w_0}}}$. In figure 12(b), the vortex shedding frequency ( ${f_v}$) for the 2S + 2P mode locks in with the STO frequency ( ${f_{{y_m}}}$). The harmonic frequency ($3{f_v}$) is formed by six vortices shed in one oscillation period, which is equal to the STO harmonic frequency ($3{f_{{y_m}}}$) in figure 8(a). The values of ${f_v}$ and ${f_{{y_m}}}$ decrease with increasing ${L_0}/L$ because of the higher oscillation amplitude.

Figure 12. (a) Instantaneous contours of ${\omega _z}$ when ${y_m} = 0$. (b) The PSD of v ($x = 5$, $y = 0$) for ${L_0}/L = 0.7$ and ${\gamma _{{L_0}}} = 0.004$; ${L_0}/L = 0.6$ and ${\gamma _{{L_0}}} = 0.01$ and ${L_0}/L = 0.5$ and ${\gamma _{{L_0}}} = 0.01$ in the STO mode.

To explore the snap-through dynamics and vortex dynamics in the STO mode, we further examine the time histories of ${x_m}$, ${y_m}$, $\boldsymbol{F}$ and ${E_s}$ in concert with the contours of ${\omega _z}$ and p for ${L_0}/L = 0.6$ and ${\gamma _{{L_0}}} = 0.01$. In figure 13(a), local maxima and minima of ${x_m}$ are obtained at moments A and D and at moments B and C, respectively. At moment A, the filament is close to its initial shape after completing a snapping motion, showing a local minimum of ${E_s}$ (${E_{s\ min}}$). The ${E_{s\ min}}$ value is substantially greater than that of an inverted flag. A negative ${V_{snap}}$ shed from the filament leads to an increase in pressure near the rear part, resulting in a local minimum of ${F_{ftx}}$. Notably, ${F_{ftx}}$ is always greater than zero. The front part is deflected from its initial shape, yielding a positive ${F_{stx}}$. Both ${F_{ftx}}$ and ${F_{stx}}$ drive a streamwise shift from A to B. Here, ${E_s}$ increases because of the deflection of the rear part. At moment B, ${E_s}$ and negative ${F_{stx}}$ reach their local maximum and minimum, respectively. A positive vortex is formed behind the filament, leading to a local maximum of ${F_{ftx}}$ at $B$; ${F_{stx}}$ dominates ${F_{ftx}}$, resulting in an upstream motion and an increase of the positive pressure at the front of the filament. This increased pressure leads to a downward motion of the front part, inducing a snapping motion from the upside to the downside. At moment C, the ‘S’ shape is observed, having a local maximum of ${E_s}$. A positive ${V_{snap}}$ is formed at the downside of the filament, following the ${V_P}$ shed from the filament. The positive ${V_{snap}}$ with a negative ${F_{fty}}$ is beneficial to the snapping motion. At moment D, the snapping motion is completed, resulting in a shape symmetric to that at A. The streamwise shift and ‘S’ shape play important roles in increasing the strain energy. Note that if the filament snaps and experiences a large deflection, it can lead to a shortened lifespan of the device.

Figure 13. (a) Time histories of ${x_m}$, ${y_m}$, $F$ and ${E_s}$. Instantaneous contours of (b) ${\omega _z}$ and (c) p at A, B, $C$ and D for ${L_0}/L = 0.6$ and ${\gamma _{{L_0}}} = 0.01$ in the STO mode.

Recall that no vortex shedding appears before the onset of the STO mode for ${L_0}/L = 0.7$ and 0.8. A one-off snap through can be realized at $Re = O({10^{ - 2}})$ in a small flow channel without vortex shedding (Gomez et al. Reference Gomez, Moulton and Vella2017b). Thus, the initial snapping motion is obtained without unsteady fluid force; ${\boldsymbol{F}_{st}}$ cannot balance ${\boldsymbol{F}_{ft}}$ under the critical conditions, yielding a snapping motion. The STO is a self-excited vibration caused by a fluid-elastic instability. The snapping motion supports the formation of ${V_{snap}}$ by the interaction with shear layers, thereby inducing the formation of ${V_P}$ in figures 12 and 13. On the other hand, ${f_v}$${f_{{y_m}}}$) in the STO mode obviously differs from that in the SO mode for ${L_0}/L = 0.5$ and 0.6. This difference suggests that vortex shedding is caused by the STO, not vice versa. The unsteady fluid force caused by vortex shedding supports the snapping motion, but it is not an excitation source of the STO mode.

3.2. The Reynolds number effect and hysteresis characteristics

We here further examine the effect of $Re$ on the mode transition. In this section, the length is fixed at ${L_0}/L = 0.6$. Figure 14 shows a mode diagram in the range $20 \le Re \le 220$ and $0.009 \le {\gamma _{{L_0}}} \le 0.012$. A transition to the STO mode is observed with increasing $Re$ for each ${\gamma _{{L_0}}}$ because of the increase in the fluid force. The SO mode is observed only in a relatively stiff filament (${\gamma _{{L_0}}} = 0.011$ and 0.012). A critical $Re$ is obtained at $R{e_c} = 85$ for the transition from the E mode to the SO mode, thereby $R{e_{{w_0}c}} = 49$. This result is consistent with the finding in figure 10; the appearance of vortex shedding in the E and SO modes is caused by the increase of $R{e_{{w_0}}}$. Note that $R{e_{{w_0}}}$ for ${L_0}/L = 0.5$, 0.6, 0.7 and 0.8 is 72, 57, 44 and 33, respectively. With increasing ${\gamma _{{L_0}}}$, the SO mode is distributed in a wide range of $Re$. The critical $Re$ for the transition to the STO mode increases with increasing ${\gamma _{{L_0}}}$; a stiffer filament suppresses the snapping motion. Both the increase of $Re$ (or $R{e_{{w_0}}}$) and the decrease of ${\gamma _{{L_0}}}$ (or ${\gamma _L}$) enhance the fluid force, inducing instability of the filament. A similar wake pattern (2S + 2P) is observed in the STO mode for different $R{e_{{w_0}}}$. Here, ${V_{snap}}$ is divided into two parts with increasing $R{e_{{w_0}}}$, consistent with the finding in figure 12. The increase of $R{e_{{w_0}}}$ leads to stronger vortices; increasing viscosity disfavours vortex formation because of the thick boundary layer along the filament at low Reynolds numbers (Mackowski & Williamson Reference Mackowski and Williamson2015). The division of ${V_{snap}}$ results from its interaction with strong ${V_P}$.

Figure 14. Mode diagram depending on ${\gamma _{{L_0}}}$ and $Re$; regions I, II and III correspond to the E mode, the SO mode and the STO mode, respectively. The blue and red markers represent the absence and presence of vortex shedding in the wake, respectively (${L_0}/L = 0.6$).

Figure 15 shows the variations of $A/(2{w_0})$ and ${f_{{y_\textrm{m}}}}A/{U_0}$ with increasing $Re$, where the tendency is similar to that observed for decreasing ${\gamma _L}$ in figure 9. The E mode is not included in figure 15(b). In the E and SO modes, $A/(2{w_0})$ and ${f_{{y_m}}}A/{U_0}$ are almost zero. In figure 15(a), $A/2{w_0}$ is close to one in the STO mode; the oscillation amplitude is insensitive to $Re$ in the range of parameters studied. In figure 15(b), the points within the STO mode converge to a straight line. The STO frequency increases with increasing $Re$.

Figure 15. (a) Values of $A/(2{w_0})$ and (b) ${f_{{y_\textrm{m}}}}A/{U_0}$ as functions of $Re$ (${L_0}/L = 0.6$).

A hysteresis is observed when $Re$ and ${\gamma _{{L_0}}}$ are varied near the critical $Re$. Figure 16(a) shows the variation of $A/(2{w_0})$ as a function of $Re$ for ${\gamma _{{L_0}}} = 0.009$. Simulations with increasing and decreasing $Re$ lead to different responses. For increasing $Re$, simulations are first carried out for $Re = 45$. The fully developed flow for $Re = 45$ is used as an initial condition for the case with an incremented $Re$. The fully developed solution for this $Re$ is used as an initial condition for the next case with an incremented $Re$ and so on. Similarly, for decreasing $Re$, the simulations begin with the fully developed solution for $Re = 65$ as an initial condition for the case with a decremented $Re$ (Sahu, Furquan & Mittal Reference Sahu, Furquan and Mittal2019). For increasing $Re$, the critical $Re$ for the transition to the STO mode is $R{e_{c2}}$. For decreasing $Re$, the critical $Re$ for the transition to the E/SO mode ($R{e_{c1}}$) is smaller than $R{e_{c2}}$. This result might be attributable to the unsteady fluid force in the STO mode, which maintains a periodic oscillation at lower $Re$. A hysteresis loop defined by $\Delta R{e_c}/R{e_{c2}} = (R{e_{c2}} - R{e_{c1}})/R{e_{c2}}$ can be used to quantify the importance of hysteresis (Eloy, Kofman & Schouveiler Reference Eloy, Kofman and Schouveiler2012). The variation of $\Delta R{e_c}/R{e_{c2}}$ as a function of ${\gamma _{{L_0}}}$ is shown in figure 16(b). $\Delta R{e_c}/R{e_{c2}}$ increases with increasing ${\gamma _{{L_0}}}$; that is, the elastic force increases. This result indicates that the elastic force is responsible for the hysteresis. Note that the elastic force is substantially greater than the unsteady fluid force in figure 13(a); the high elastic force might play an important role in the hysteresis.

Figure 16. (a) Value of $A/(2{w_0})$ as a function of $Re$ (${\gamma _{{L_0}}} = 0.009$). (b) Hysteresis loop $\Delta R{e_c}/R{e_c}$ as a function of ${\gamma _{{L_0}}}$ (${L_0}/L = 0.6$).

3.3. Energy harvesting performance

Fluid kinetic energy is converted to strain energy during oscillation. The strain energy is then converted to electrical energy via piezoelectric materials attached to the filament. The output voltage is proportional to the variation of the strain energy and the deflection of the filament. Accordingly, ${\bar{E}_s} - {\bar{E}_{s\ min}}$ and the square of the curvature $\bar{K} = {\bar{E}_s}/({\gamma _{{L_0}}}L)$ are used to estimate the energy harvesting performance. Here, ${E_s}$ and K are defined as in § 2. Figure 17(a) shows the variations of ${\bar{E}_s} - {\bar{E}_{s\ min}}$ as a function of ${\gamma _{{L_0}}}$. The value of ${\bar{E}_s} - {\bar{E}_{s\ min}}$ is very low in the E and SO modes. A sudden increase in ${\bar{E}_s} - {\bar{E}_{s\ min}}$ is observed at the critical points for the transition to the STO mode. Here, ${E_s}$ is no longer useful to identify the deflection because it is directly proportional to ${\gamma _{{L_0}}}$ and L. Figure 17(b) shows the variations of $\bar{K}$ as a function of ${\gamma _L}$, which collapse onto a single curve irrespective of L. The value of $\bar{K}$ slowly increases with decreasing ${\gamma _L}$ until the critical ${\gamma _L}$ is reached. The transition to the STO mode leads to a rapid increase in $\bar{K}$, which is mainly attributed to the streamwise shift and ‘S’ shape.

Figure 17. (a) Value of ${\bar{E}_s} - {\bar{E}_{s\ min}}$ as a function of ${\gamma _{{L_0}}}$. (b) Averaged K ($\bar{K} = {\bar{E}_s}/({\gamma _{{L_0}}}L)$) as a function of ${\gamma _L}$ ($Re = 100$), where K is the square of the curvature.

Figure 18(a) shows the averaged local strain energy ${\bar{E}^{\prime}_s}(s) = (1/T)\int_0^T {0.5\gamma K\,\textrm{d}t}$ along the filament in the STO mode for ${\gamma _{{L_0}}} = 0.01$ and 0.002. The ${\bar{E}^{\prime}_s}(s)$ in the initial state for ${\gamma _{{L_0}}} = 0.01$ is included for comparison; $s/L = 0$ and 1 represent two edges of the filament. For the initial state, a maximum of ${\bar{E}^{\prime}_s}$ (${\bar{E}^{\prime}_{s\ max}}$) excluding two edges is observed at $s/L = 0.5$ because of the local maximum deflection. For the STO mode, ${\bar{E}^{\prime}_{s\ max}}$ is at $s/L = 0.69$ for ${\gamma _{{L_0}}} = 0.01$. The offset between $s/L = 0.5$ and 0.69 is caused by the streamwise shift in figure 13(b), where the shift enforces the deflection substantially near $s/L = 0.69$. The offset increases with decreasing ${\gamma _{{L_0}}}$ because of the large streamwise shift. Figure 18(b) shows the cumulative sum of ${\bar{E}^{\prime}_s}$ ($\int_0^s {{{\bar{E}^{\prime}}_s}\,\textrm{d}s} /\int_0^L {{{\bar{E}^{\prime}}_s}\,\textrm{d}s} $) as a function of $s/L$. The first half of the filament in the initial state accumulates 50 % of the total strain energy because of its symmetrical shape. This proportion in the STO mode decreases with decreasing ${\gamma _{{L_0}}}$ (e.g. 29.5 % and 10.1 % for ${\gamma _{{L_0}}} = 0.01$ and 0.002, respectively). Piezoelectric materials should be attached to the last half of the filament to enhance the efficiency.

Figure 18. (a) Averaged local elastic strain energy (${\bar{E}^{\prime}_s}$) and (b) cumulative sum of ${\bar{E}^{\prime}_s}$ along the filament as functions of $s/L$ for ${L_0}/L = 0.6$ ($Re = 100$).

To demonstrate the effect of $Re$, the variation of ${\bar{E}_s} - {\bar{E}_{s\ min}}$ with increasing $Re$ is shown in figure 19(a) for different ${\gamma _{{L_0}}}$. A sudden increase of ${\bar{E}_s} - {\bar{E}_{s\ min}}$ is observed at the critical point, and then ${\bar{E}_s} - {\bar{E}_{s\ min}}$ slowly increases with increasing $Re$ in the STO mode. The STO featured by the ‘S’ shape is consistent irrespective of $Re$, $\gamma $ and L. Other shapes with high deflection are not observed (e.g. a ‘W’ shape). A sudden increase of ${\bar{E}_s} - {\bar{E}_{s\ min}}$ is no longer available beyond the critical condition. A conversion ratio $R = ({\bar{E}_s} - {\bar{E}_{s\ min}})/{\bar{E}_{kf}}$ was used to estimate the energy harvesting performance (Ryu et al. Reference Ryu, Park, Kim and Sung2015). Here, ${\bar{E}_{kf}} = 0.5{\rho _1}U_0^3|{\tilde{y}} |$ is the averaged kinetic energy of the surrounding flow and $|{\tilde{y}} |$ is the maximum windward area of the filament during oscillation. In the present study, $|{\tilde{y}} |= A/2$. The variation of R is shown in figure 19(b). The E and SO modes are not included because they are incompatible with energy harvesting. The value of R increases with increasing $Re$ and ${\gamma _{{L_0}}}$ because of the higher ${\bar{E}_s}$. In the present study, the strain energy distribution along the filament is insensitive to $Re$. The curves of ${\bar{E}^{\prime}_s}$ and the cumulative sum of ${\bar{E}^{\prime}_s}$ for different $Re$ collapse into two single curves (results not shown here).

Figure 19. (a) Values of ${\bar{E}_s} - {\bar{E}_{s\ min}}$ and (b) conversion ratio ($R$) as functions of $Re$ (${L_0}/L = 0.6$).

4. Conclusions

In the present study, numerical simulations were conducted to explore the flow-induced snap-through dynamics of a buckled flexible filament. The distance ${L_0}$ between two clamped edges was set to be shorter than the length L of the filament to achieve an initial buckled shape. The initial height ${w_0}$ increases with increasing L. The instability mechanism, snap-through dynamics, vortex dynamics, hysteresis and energy harvesting performance were examined in terms of $\gamma $, $L$ and $Re$. Three different modes were observed when the aforementioned parameters were varied: an E mode, an SO mode and an STO mode. Parameter ${\gamma _L}$ (defined by $\gamma /{\rho _1}U_0^2{L^2}$) was used to incorporate the effects of $\gamma $ and L. The transition to the STO mode occurred with decreasing ${\gamma _L}$ and increasing $Re$, accompanied by rapid increases of the oscillation amplitude $A/(2{w_0})$ and frequency ${f_{{y_m}}}A/{U_0}$. The critical ${\gamma _L}$ is insensitive to L. The present STO mode is sustained in a wide range of ${\gamma _L}$ beyond the critical value. In the E mode, the fluid force is balanced by the elastic force. The decrease in ${\gamma _L}$ and increase in $Re$ enhance the deflection of the front part of the filament because of the increase in the fluid force. The transition to the STO mode occurs when the elastic force reaches its maximum; no higher elastic force is available to balance the fluid force. The SO mode with a relatively small $A/(2{w_0})$ represents a vortex-induced vibration, which is dominated by vortex shedding because of a filament's ‘bluff’ shape. Accordingly, a direct transition from the E mode to the STO mode is observed when $R{e_{{w_0}}} < 49$, whereas the three modes appear in succession when $R{e_{{w_0}}} \ge 49$. The STO is a self-excited vibration caused by a fluid-elastic instability; vortex shedding in the STO mode is caused by the filament's snapping motion. The snapping motion leads to the formation of a single vortex and consequent pair of vortices in a half-period, yielding a wake pattern of 2S + 2P irrespective of ${\gamma _L}$ and $Re$. The vortex shedding frequency locks in with the oscillation frequency for both the SO and STO modes. Moreover, a hysteresis of the snapping filament is observed with an increasing or decrease of $Re$ near the critical Reynolds number. The hysteresis loop increases with increasing ${\gamma _L}$, which is mainly attributed to the high elastic force in the STO mode. Finally, we estimated the energy harvesting performance by measuring the deflection and strain energy of the filament. The filament in the STO mode with high strain energy is beneficial to energy harvesting. Most of strain energy is concentrated in the last half of the filament, indicating a suitable position for piezoelectric materials. The strain energy distribution along the filament is insensitive to $Re$. Our investigation of the basic configurations of a buckled flexible filament in a uniform flow provides important insights into advanced flow-induced snap-through applications in energy harvesting.

Funding

This study was supported by a grant from the National Research Foundation of Korea (No. 2019M3C1B7025091) and by a fund from the China Scholarship Council (No. 202006230245).

Declaration of interests

The authors report no conflict of interest.

References

Allen, J.J. & Smits, A.J. 2001 Energy harvesting eel. J. Fluid Struct. 15, 629640.CrossRefGoogle Scholar
Bai, Q., Liao, X.W., Chen, Z.W., Gan, C.Z., Zou, H.X., Wei, K.X., Gu, Z. & Zheng, X.J. 2022 Snap-through triboelectric nanogenerator with magnetic coupling buckled bistable mechanism for harvesting rotational energy. Nano Energy 96, 107118.CrossRefGoogle Scholar
Banerjee, S., Connell, B.S. & Yue, D.K. 2015 Three-dimensional effects on flag flapping dynamics. J. Fluid Mech. 783, 103136.CrossRefGoogle Scholar
Berger, E. & Wille, R. 1972 Periodic flow phenomena. Annu. Rev. Fluid Mech. 4, 313340.CrossRefGoogle Scholar
Boisseau, S., Despesse, G., Monfray, S., Puscasu, O. & Skotnicki, T. 2013 Semi-flexible bimetal-based thermal energy harvesters. Smart Mater. Struct. 22, 025021.CrossRefGoogle Scholar
Cisonni, J., Lucey, A.D., Elliott, N.S. & Heil, M. 2017 The stability of a flexible cantilever in viscous channel flow. J. Sound Vib. 396, 186202.CrossRefGoogle Scholar
Cottone, F., Gammaitoni, L., Vocca, H., Ferrari, M. & Ferrari, V. 2012 Piezoelectric buckled beams for random vibration energy harvesting. Smart Mater. Struct. 21, 035021.CrossRefGoogle Scholar
Eloy, C., Kofman, N. & Schouveiler, L. 2012 The origin of hysteresis in the flag instability. J. Fluid Mech. 691, 583593.CrossRefGoogle Scholar
Forterre, Y., Skotheim, J.M., Dumais, J. & Mahadevan, L. 2005 How the Venus flytrap snaps. Nature 433, 421425.CrossRefGoogle ScholarPubMed
Furquan, M. & Mittal, S. 2021 Multiple lock-ins in vortex-induced vibration of a filament. J. Fluid Mech. 916, R1.CrossRefGoogle Scholar
Gilmanov, A., Le, T.B. & Sotiropoulos, F. 2015 A numerical approach for simulating fluid structure interaction of flexible thin shells undergoing arbitrarily large deformations in complex domains. J. Comput. Phys. 300, 814843.CrossRefGoogle Scholar
Goldstein, D., Handler, R. & Sirovich, L. 1993 Modeling a no-slip flow boundary with an external force field. J. Comput. Phys. 105, 354366.CrossRefGoogle Scholar
Gomez, M., Moulton, D.E. & Vella, D. 2017 a Critical slowing down in purely elastic ‘snap-through'instabilities. Nat. Phys. 13, 142145.CrossRefGoogle Scholar
Gomez, M., Moulton, D.E. & Vella, D. 2017 b Passive control of viscous flow via elastic snap-through. Phys. Rev. Lett. 119, 144502.CrossRefGoogle ScholarPubMed
Gurugubelli, P.S. & Jaiman, R.K. 2015 Self-induced flapping dynamics of a flexible inverted foil in a uniform flow. J. Fluid Mech. 781, 657694.CrossRefGoogle Scholar
Hu, Y., Yang, B., Chen, X., Wang, X. & Liu, J. 2018 Modeling and experimental study of a piezoelectric energy harvester from vortex shedding-induced vibration. Energy Convers. Manage. 162, 145158.CrossRefGoogle Scholar
Huang, W.X., Shin, S.J. & Sung, H.J. 2007 Simulation of flexible filaments in a uniform flow by the immersed boundary method. J. Comput. Phys. 226, 22062228.CrossRefGoogle Scholar
Huang, W.X. & Sung, H.J. 2010 Three-dimensional simulation of a flapping flag in a uniform flow. J. Fluid Mech. 653, 301336.CrossRefGoogle Scholar
Jung, S.M. & Yun, K.S. 2010 Energy-harvesting device with mechanical frequency-up conversion mechanism for increased power efficiency and wideband operation. Appl. Phys. Lett. 96, 111906.CrossRefGoogle Scholar
Kim, D., Cossé, J., Cerdeira, C.H. & Gharib, M. 2013 Flapping dynamics of an inverted flag. J. Fluid Mech. 736, R1.CrossRefGoogle Scholar
Kim, H., Lahooti, M., Kim, J. & Kim, D. 2021 a Flow-induced periodic snap-through dynamics. J. Fluid Mech. 913, A52.CrossRefGoogle Scholar
Kim, H., Zhou, Q., Kim, D. & Oh, I.K. 2020 Flow-induced snap-through triboelectric nanogenerator. Nano Energy 68, 104379.CrossRefGoogle Scholar
Kim, J., Kim, H. & Kim, D. 2021 b Snap-through oscillations of tandem elastic sheets in uniform flow. J. Fluid Struct. 103, 103283.CrossRefGoogle Scholar
Kim, K., Baek, S.J. & Sung, H.J. 2002 An implicit velocity decoupling procedure for the incompressible Navier–Stokes equations. Intl J. Numer. Meth. Fluids 38, 125138.CrossRefGoogle Scholar
Lim, S.H. & Park, S.G. 2022 Numerical analysis of energy harvesting system including an inclined inverted flag. Phys. Fluids 34, 013601.CrossRefGoogle Scholar
Mackowski, A.W. & Williamson, C.H.K. 2015 Direct measurement of thrust and efficiency of an airfoil undergoing pure pitching. J. Fluid Mech. 765, 524543.CrossRefGoogle Scholar
Manela, A. & Howe, M.S. 2009 The forced motion of a flag. J. Fluid Mech. 635, 439454.CrossRefGoogle Scholar
Mazharmanesh, S., Young, J., Tian, F.B., Ravi, S. & Lai, J.C. 2022 Energy harvesting of inverted piezoelectric flags in an oscillating flow. J. Fluid Struct. 115, 103762.CrossRefGoogle Scholar
Michelin, S. & Doaré, O. 2013 Energy harvesting efficiency of piezoelectric flags in axial flows. J. Fluid Mech. 714, 489504.CrossRefGoogle Scholar
Michelin, S., Smith, S.G.L. & Glover, B.J. 2008 Vortex shedding model of a flapping flag. J. Fluid Mech. 617, 110.CrossRefGoogle Scholar
Monkewitz, P.A., Williamson, C.H.K. & Miller, G.D. 1996 Phase dynamics of Kármán vortices in cylinder wakes. Phys. Fluids 8, 9196.CrossRefGoogle Scholar
Orrego, S., Shoele, K., Ruas, A., Doran, K., Caggiano, B., Mittal, R. & Kang, S.H. 2017 Harvesting ambient wind energy with an inverted piezoelectric flag. Appl. Energy 194, 212222.CrossRefGoogle Scholar
Park, J.W., Ryu, J. & Sung, H.J. 2019 Effects of the shape of an inverted flag on its flapping dynamics. Phys. Fluids 31, 021904.CrossRefGoogle Scholar
Peskin, C.S. 2002 The immersed boundary method. Acta Numerica 11, 479517.CrossRefGoogle Scholar
Ryu, J., Park, S.G., Kim, B. & Sung, H.J. 2015 Flapping dynamics of an inverted flag in a uniform flow. J. Fluid Struct. 57, 159169.CrossRefGoogle Scholar
Sader, J.E., Cossé, J., Kim, D., Fan, B. & Gharib, M. 2016 a Large-amplitude flapping of an inverted flag in a uniform steady flow–a vortex-induced vibration. J. Fluid Mech. 793, 524555.CrossRefGoogle Scholar
Sader, J.E., Huertas-Cerdeira, C. & Gharib, M. 2016 b Stability of slender inverted flags and rods in uniform steady flow. J. Fluid Mech. 809, 873894.CrossRefGoogle Scholar
Sahu, T.R., Furquan, M. & Mittal, S. 2019 Numerical study of flow-induced vibration of a circular cylinder with attached flexible splitter plate at low Re. J. Fluid Mech. 880, 551593.CrossRefGoogle Scholar
Shelley, M., Vandenberghe, N. & Zhang, J. 2005 Heavy flags undergo spontaneous oscillations in flowing water. Phys. Rev. Lett. 94, 094302.CrossRefGoogle ScholarPubMed
Shin, S.J., Huang, W.X. & Sung, H.J. 2008 Assessment of regularized delta functions and feedback forcing schemes for an immersed boundary method. Intl J. Numer. Meth. Fluids 58, 263286.CrossRefGoogle Scholar
Shoele, K. & Mittal, R. 2016 Energy harvesting by flow-induced self-excited vibration in a simple model of an inverted piezoelectric flag. J. Fluid Mech. 790, 582606.CrossRefGoogle Scholar
Taneda, S. 1968 Waving motions of flags. J. Phys. Soc. Japan 24, 392401.CrossRefGoogle Scholar
Tang, C., Liu, N.S. & Lu, X.Y. 2015 Dynamics of an inverted flexible plate in a uniform flow. Phys. Fluids 27, 073601.CrossRefGoogle Scholar
Tang, L., Païdoussis, M.P. & Jiang, J. 2009 Cantilevered flexible plates in axial flow: energy transfer and the concept of self-excited vibration-mill. J. Sound Vib. 326, 263276.CrossRefGoogle Scholar
Tavallaeinejad, M., Païdoussis, M.P., Salinas, M.F., Legrand, M., Kheiri, M. & Botez, R.M. 2020 Flapping of heavy inverted flags: a fluid-elastic instability. J. Fluid Mech. 904, R5.CrossRefGoogle Scholar
Tavallaeinejad, M., Salinas, M.F., Païdoussis, M.P., Legrand, M., Kheiri, M. & Botez, R.M. 2021 Dynamics of inverted flags: experiments and comparison with theory. J. Fluid Struct. 101, 103199.CrossRefGoogle Scholar
Taylor, G.W., Burns, J.R., Kammann, S.A., Powers, W.B. & Welsh, T.R. 2001 The energy harvesting eel: a small subsurface ocean/river power generator. IEEE J. Ocean. Engng 26, 539547.CrossRefGoogle Scholar
Xia, Y., Michelin, S. & Doaré, O. 2015 Fluid-solid-electric lock-in of energy-harvesting piezoelectric flags. Phys. Rev. Appl. 3, 014009.CrossRefGoogle Scholar
Yu, Y. & Liu, Y. 2016 Energy harvesting with two parallel pinned piezoelectric membranes in fluid flow. J. Fluid Struct. 65, 381397.CrossRefGoogle Scholar
Yu, Y., Liu, Y. & Amandolese, X. 2019 A review on fluid-induced flag vibrations. Appl. Mech. Rev. 71, 010801.CrossRefGoogle Scholar
Yu, Y., Liu, Y. & Chen, Y. 2017 Vortex dynamics behind a self-oscillating inverted flag placed in a channel flow: time-resolved particle image velocimetry measurements. Phys. Fluids 29, 125104.CrossRefGoogle Scholar
Zhang, J., Childress, S., Libchaber, A. & Shelley, M. 2000 Flexible filaments in a flowing soap film as a model for one-dimensional flags in a two-dimensional wind. Nature 408, 835839.CrossRefGoogle Scholar
Zhu, Y. & Zu, J.W. 2013 Enhanced buckled-beam piezoelectric energy harvesting using midpoint magnetic force. Appl. Phys. Lett. 103, 041905.CrossRefGoogle Scholar
Figure 0

Figure 1. Schematic of the buckled flexible filament in a uniform flow.

Figure 1

Table 1. Domain test, including the averaged drag coefficient ${\bar{C}_D}$, the root mean square of the lift coefficient ${C_{L\ rms}}$, the Strouhal number $St$ and the relative errors $\varepsilon $ with respect to the domain $32 \times 24$ in I and $64 \times 16$ in II for ${L_0}/L = 0.589$, ${\gamma _{{L_0}}} = 0.005$ and $Re = 200$.

Figure 2

Figure 2. Time histories of the transverse displacement of the midpoint of the filament (${y_m}$) for different (a) grid resolutions and (b) time steps (${L_0}/L = 0.589$, ${\gamma _{{L_0}}} = 0.005$, $Re = 200$).

Figure 3

Figure 3. (a) Initial height (${w_0}/L$) of the buckled flexible filament as a function of ${L_0}/L$. (b) Initial buckled shapes for different ${L_0}/L$; the red and grey lines represent the results of the present study and the experimental results of Kim et al. (2021a), respectively.

Figure 4

Figure 4. Superposition of the instantaneous shapes of the filament in (a) equilibrium mode (${L_0}/L = 0.8$, ${\gamma _{{L_0}}} = 0.0058$, 0.008, 0.03), (b) streamwise oscillation mode (${L_0}/L = 0.5$, ${\gamma _{{L_0}}} = 0.02$) and (c) snap-through oscillation mode (${L_0}/L = 0.5$, ${\gamma _{{L_0}}} = 0.01$).

Figure 5

Figure 5. Time histories of ${x_m}$ and ${y_m}$ in (a) streamwise oscillation mode (${L_0}/L = 0.5$, ${\gamma _{{L_0}}} = 0.02$) and (b) snap-through oscillation mode (${L_0}/L = 0.5$, ${\gamma _{{L_0}}} = 0.01$). (c) The sequential process of snap-through oscillation (${L_0}/L = 0.5$, ${\gamma _{{L_0}}} = 0.01$).

Figure 6

Figure 6. Mode diagram depending on ${\gamma _{{L_0}}}$ and ${L_0}/L$; regions I, II and III correspond to the equilibrium mode, the streamwise oscillation mode and the snap-through oscillation mode, respectively. Blue and red markers represent the absence and the presence of vortex shedding in the wake, respectively.

Figure 7

Figure 7. (a) The transverse displacement of the filament at $x = 0$ (${y_{x = 0}}$) as a function of ${\gamma _{{L_0}}}$ in the equilibrium mode and streamwise oscillation mode. (b) Oscillation amplitude ($A$) of the filament as a function of ${\gamma _{{L_0}}}$.

Figure 8

Figure 8. (a) Power spectral density (PSD) of ${y_m}$ and ${x_m}$ for ${L_0}/L = 0.5$, ${\gamma _{{L_0}}} = 0.02$ (streamwise oscillation mode) and 0.01 (snap-through oscillation mode). (b) Value of ${f_{{y_m}}}$ as a function of ${\gamma _{{L_0}}}$.

Figure 9

Figure 9. (a) Value of ${y_{x = 0}}/{w_0}$ as a function of ${\gamma _L}$ (bending rigidity non-dimensionalized by $0.5{\rho _1}U_0^2{L^2}$) in the equilibrium state and streamwise oscillation mode. (b) Value of $A/(2{w_0})$ as a function of ${\gamma _L}$. (c) Value of ${f_{{y_m}}}A/{U_0}$ as a function of ${\gamma _L}$.

Figure 10

Figure 10. Instantaneous contours of (a) vorticity (${\omega _z}$) and (b) pressure ($p$) for ${L_0}/L = 0.8$ and ${\gamma _{{L_0}}} = 0.03$; ${L_0}/L = 0.8$ and ${\gamma _{{L_0}}} = 0.0058$; and ${L_0}/L = 0.6$ and ${\gamma _{{L_0}}} = 0.03$ in the equilibrium mode.

Figure 11

Table 2. Fluid force ${\bar{\boldsymbol{F}}_{ft}}$ and elastic force ${\bar{\boldsymbol{F}}_{st}}$ of the filament for different ${\gamma _{{L_0}}}$ (${L_0}/L = 0.8$).

Figure 12

Figure 11. (a) Time histories of ${x_m}$, streamwise fluid force ${F_{ftx}}$, streamwise elastic force ${F_{stx}}$ and total streamwise force ${F_{tx}}$ (${F_{ftx}} + {F_{stx}}$). Instantaneous contours of (b) ${\omega _z}$ and (c) p at A and B for ${L_0}/L = 0.5$ and ${\gamma _{{L_0}}} = 0.02$ in the streamwise oscillation mode.

Figure 13

Figure 12. (a) Instantaneous contours of ${\omega _z}$ when ${y_m} = 0$. (b) The PSD of v ($x = 5$, $y = 0$) for ${L_0}/L = 0.7$ and ${\gamma _{{L_0}}} = 0.004$; ${L_0}/L = 0.6$ and ${\gamma _{{L_0}}} = 0.01$ and ${L_0}/L = 0.5$ and ${\gamma _{{L_0}}} = 0.01$ in the STO mode.

Figure 14

Figure 13. (a) Time histories of ${x_m}$, ${y_m}$, $F$ and ${E_s}$. Instantaneous contours of (b) ${\omega _z}$ and (c) p at A, B, $C$ and D for ${L_0}/L = 0.6$ and ${\gamma _{{L_0}}} = 0.01$ in the STO mode.

Figure 15

Figure 14. Mode diagram depending on ${\gamma _{{L_0}}}$ and $Re$; regions I, II and III correspond to the E mode, the SO mode and the STO mode, respectively. The blue and red markers represent the absence and presence of vortex shedding in the wake, respectively (${L_0}/L = 0.6$).

Figure 16

Figure 15. (a) Values of $A/(2{w_0})$ and (b) ${f_{{y_\textrm{m}}}}A/{U_0}$ as functions of $Re$ (${L_0}/L = 0.6$).

Figure 17

Figure 16. (a) Value of $A/(2{w_0})$ as a function of $Re$ (${\gamma _{{L_0}}} = 0.009$). (b) Hysteresis loop $\Delta R{e_c}/R{e_c}$ as a function of ${\gamma _{{L_0}}}$ (${L_0}/L = 0.6$).

Figure 18

Figure 17. (a) Value of ${\bar{E}_s} - {\bar{E}_{s\ min}}$ as a function of ${\gamma _{{L_0}}}$. (b) Averaged K ($\bar{K} = {\bar{E}_s}/({\gamma _{{L_0}}}L)$) as a function of ${\gamma _L}$ ($Re = 100$), where K is the square of the curvature.

Figure 19

Figure 18. (a) Averaged local elastic strain energy (${\bar{E}^{\prime}_s}$) and (b) cumulative sum of ${\bar{E}^{\prime}_s}$ along the filament as functions of $s/L$ for ${L_0}/L = 0.6$ ($Re = 100$).

Figure 20

Figure 19. (a) Values of ${\bar{E}_s} - {\bar{E}_{s\ min}}$ and (b) conversion ratio ($R$) as functions of $Re$ (${L_0}/L = 0.6$).