Hostname: page-component-cd9895bd7-q99xh Total loading time: 0 Render date: 2024-12-28T02:16:25.794Z Has data issue: false hasContentIssue false

Heat transport and flow structure in thermal convection with two liquid layers

Published online by Cambridge University Press:  27 December 2023

Mu Wang
Affiliation:
School of Aerospace Engineering and Applied Mechanics, Tongji University, Shanghai 200092, PR China
Xin-Yu Chen
Affiliation:
School of Aerospace Engineering and Applied Mechanics, Tongji University, Shanghai 200092, PR China
Wei Wang
Affiliation:
School of Aerospace Engineering and Applied Mechanics, Tongji University, Shanghai 200092, PR China
Ping Wei*
Affiliation:
School of Aerospace Engineering and Applied Mechanics, Tongji University, Shanghai 200092, PR China Shanghai Key Lab of Vehicle Aerodynamics and Vehicle Thermal Management Systems, Shanghai 201804, PR China
*
Email address for correspondence: [email protected]

Abstract

We report an experimental investigation of the heat transport and flow field in a rectangular Rayleigh–Bénard convection (RBC) cell with two immiscible fluids: silicone oil and glycerol. The global heat transport of the system is divided into three ranges corresponding to the different flow structures formed in the glycerol layer. In range I, the glycerol layer is dominated by conduction, and no plume is formed over the interface. In range II, cellular rolls are formed in the glycerol layer and the horizontal motion of rolls causes an oscillation of temperature in the interface. In range III, the cellular pattern is time-independent, and the interface forms a group of wavelets with wave numbers consistent with the mode of the cellular pattern. In lower-thin glycerol, the Nusselt (Nu) grows from conduction to convection through an oscillating subcritical bifurcation at critical Rayleigh number $Ra_c$. The value of $Ra_c$ in the present work is smaller than the theoretical prediction of both-rigid boundaries and greater than the prediction of one-rigid and one-free boundaries. In the upper-thick silicone oil layer, $Nu$ increases with increasing $Ra$, but it is smaller than that of traditional RBC. For the silicone oil layer in two-layer RBC, the hot plumes emitting over the liquid–liquid interface showed different shape and different velocity from cold plumes emitting from the top rigid plate. This implies that the velocity boundary condition strongly influences the flow structure in turbulent convection.

Type
JFM Papers
Copyright
© The Author(s), 2023. Published by Cambridge University Press

1. Introduction

Convection between two superimposed horizontal immiscible fluid layers has received considerable attention since this process resembles multilayer turbulent convection, which occurs widely in nature (Olson, Silver & Carlson Reference Olson, Silver and Carlson1990; Neelin, Latif & Jin Reference Neelin, Latif and Jin1994; Tackley Reference Tackley2000). Previous works have suggested that convection in the Earth's mantle may occur in two layers separated by an interface at a depth of 600 km (Richter & Johnson Reference Richter and Johnson1974; Busse Reference Busse1981). The planetary mantle and buoyant lithosphere interact strongly with each other. In industrial applications, multilayer thermal convection is associated with the liquid-encapsulated crystal growth technique (Prakash & Koster Reference Prakash and Koster1994). Therefore, the study of Rayleigh–Bénard convections (RBCs) with multilayer fluids is crucial.

RBC, in which a fluid layer confined between two horizontal parallel plates is cooled from above and heated from below, has been studied extensively as an idealised model of thermal convection. The flow exhibits different properties in various regimes for a wide range of finely tuned parameters. In the conduction, convection, chaos, transition and turbulence regimes, the heat transport and flow structure of RBC have been studied experimentally and theoretically (for reviews, see Bodenschatz, Pesch & Ahlers Reference Bodenschatz, Pesch and Ahlers2000; Ahlers, Grossmann & Lohse Reference Ahlers, Grossmann and Lohse2009; Lohse & Xia Reference Lohse and Xia2010; Chillà & Schumacher Reference Chillà and Schumacher2012). The multilayer RBC system is similar to a traditional single-layer RBC in which different immiscible fluids are used that due to their different densities form multiple layers on top of each other. Since the temperature derivative of the interfacial tension is negative, in the system heated from below the local gradient of temperature can drive convective motion if viscous and thermal dissipation are overcome. Thus, thermocapillary forces are destabilising in the lower layer and buoyancy forces are destabilising in both layers since the system is unstably stratified. But in the upper layer thermocapillary forces are stabilising. The two-layer convection is also called Rayleigh–Bénard–Marangoni convection. The term Marangoni implies that surface tension plays an important role if the buoyancies of the fluid in both layers are in the same order and both dominate the flow.

To date, most previous studies on two-layer RBC have been conducted in the non-turbulent regime (see Nataf, Moreno & Cardin Reference Nataf, Moreno and Cardin1988; Prakash & Koster Reference Prakash and Koster1994; Juel et al. Reference Juel, Burgess, McCormick, Swift and Swinney2000; Busse & Petry Reference Busse and Petry2009; Diwakar et al. Reference Diwakar, Tiwari, Das and Sundararajan2014). In the non-turbulent regime, the mechanism leading to instability and the cellular patterns near the onset of convection are the main subjects of the previous work (see also Johnson & Narayanan (Reference Johnson and Narayanan1997, Reference Johnson and Narayanan1999) and references therein). The rich variety of phenomena occurring in the two-layer RBC results in part from their huge parameter space. Note that in the non-turbulent regime, two layers of fluid were usually confined in a gap with a thickness in the order of 1 mm. Theoretically, the onset of convection is a function of the height ratio and Marangoni number, but independent of the Prandtl number. This is generally studied with linear instability theory. The secondary instability or further instability is involved in weakly nonlinear instability theory. In liquid–gas system, also called Bénard–Marangoni convection, theories predict a subcritical bifurcation from conduction to convection (Scanlon & Segel Reference Scanlon and Segel1967; Schatz et al. Reference Schatz, VanHook, McCormick, Swift and Swinney1995) and the further evolution to planform patterns (Schatz et al. Reference Schatz, VanHook, McCormick, Swift and Swinney1999). In a two-liquid-layer system, the variety of convective mechanisms is greatly enhanced in the liquid–liquid system due to the interaction between the flows in each of the superposed liquid layers. When the two-liquid-layer system is heated either from above or below, the convective motion at the onset can be oscillatory (Clever & Busse Reference Clever and Busse1974). When thermocapillarity is negligible, thermal and viscous couplings between the convection rolls in each layer can compete to generate time-dependent behaviour (Renardy & Renardy Reference Renardy and Renardy1985; Rasenat, Busse & Rehberg Reference Rasenat, Busse and Rehberg1989; Degen, Colovas & Andereck Reference Degen, Colovas and Andereck1998). When thermocapillarity is dominant, generally in the two-layer RBC heated from the top, the competition between stabilising and destabilising forces in each layer may also lead to oscillatory convection at onset (Johnson & Narayanan Reference Johnson and Narayanan1999; Juel et al. Reference Juel, Burgess, McCormick, Swift and Swinney2000). The non-Boussinesq effect (Lyubimov et al. Reference Lyubimov, Lyubimova, Alexander and Lobov1998), the influence of surface deformation (Regnier, Dauby & Lebon Reference Regnier, Dauby and Lebon2000; Lyubimov et al. Reference Lyubimov, Lyubimova, Lobov and Alexander2018) has been analysed theoretically. As a comparison, in single-layer Rayleigh–Bénard systems, the onset of convection occurs as the heat transport grows through a supercritical bifurcation with increasing Ra (Hébert et al. Reference Hébert, Hufschmid, Scheel and Ahlers2010). Oscillatory convection is only found as a secondary instability (Clever & Busse Reference Clever and Busse1974; Croquette Reference Croquette1989). For a long time, Marangoni convection in two-liquid-layer systems was an interesting theoretical problem but too difficult to handle experimentally. The experimental results of the planform pattern were mainly obtained by the shadowgraph method. The deformation of the interface is difficult to observe.

Recently two-layer RBC in the turbulent regime has drawn a lot of attention. The investigation on turbulent two-layer RBC has been made through simulations and experiments in the sample with different geometries. In the turbulent regime, the thermal boundary layer (BL) is another important structure. The plumes are emitted and detached from thermal BL, and then a group of plumes is self-organised to form a quasi-two-dimensional structure, so-called large-scale circulation (LSC). The coupling mechanism between the LSC in each layer is the topic of the experiment by Xie & Xia (Reference Xie and Xia2013) and simulation by Yoshida & Hamano (Reference Yoshida and Hamano2016). Yoshida & Hamano (Reference Yoshida and Hamano2016) also determined the effect of viscosity contrast between two layers of fluid on the two-layer RBC. The simulations by Liu et al. (Reference Liu, Chong, Wang, Ng, Verzicco and Lohse2021) explored a case with interface breakup. Liu et al. (Reference Liu, Chong, Yang, Verzicco and Lohse2022) revealed the enhancement of heat transport in multiphase RBC with two-dimensional simulation. Huang et al. (Reference Huang, Xu, Wang, Wang, He and Tong2022) experimentally measured the thermal BL on the liquid–liquid surface in a two-layer RBC, in which both layers of fluid are fully developed turbulence. They found that the time-averaged temperature and the variance follow the theoretical result of RBC over a solid surface with a slip length. In the turbulent regime, there are more aspects of flow structures that need to be explored by the experiment.

Here we fill the gap in the research of two-layer RBC with an experiment, in which the lower layer of fluid undergoes the transition from conduction to convection and the upper layer of fluid has reached a turbulent regime. In the present work, in addition to the heat transport measurement, we also adopted a shadowgraph method to visualise the two-layer RBC from the side. The flow structure in each layer of fluid and the interface can be measured. In such a configuration, one might consider the interfacial surface for the lower layer as a free surface with a random driving force. The theoretical value of the critical Rayleigh number in RBC with a rigid boundary and a free surface can be verified experimentally. When the fluid of the lower layer is dominated by conduction or the convection is negligible, one can assume that the interfacial surface provides a slip boundary condition (BC). Then the effect of the slip BC on the turbulent RBC can be studied in such a configuration. In the present work, we studied the flow structures of silicone oil with no-slip BC at the top and slip BC above the interface. The experimental result showed that these two BCs cause two different shapes of plumes.

In the remainder of the paper, we define the parameters relevant to the system in § 2. The experimental apparatus is described in § 3. The experimental results and discussion are presented in § 4. In particular, we report the first experimental observation of the temperature at the interface with an abnormal oscillation. The heat transport and the flow field in two-layer RBC are also presented. A brief summary of the work is given in § 5.

2. Relevant parameters

We investigate a system of two layers of immiscible and incompressible liquids of thickness $h_{i}$ with densities $\rho _{i}$, kinematic viscosities $\nu _{i}$, coefficients of volume expansion $\alpha _{i}$, heat diffusivities $\kappa _{i}$ and thermal conductivities $\lambda _{i}$, where the subscript $i=1(2)$ denotes the lower (upper) fluid (see figure 1). The system is bounded in the vertical direction by two solid walls. The conducting bottom plate is regulated at temperature $T_b$, while the top plate is controlled at temperature $T_t$. The temperature located at the centre of the initial interfacial surface is measured as $T_{int}$. The interfacial tension and the temperature coefficients are not known for liquid combinations. But they can be estimated using Antonow's rule (Casper Reference Casper1977), which states that the interfacial tension between two liquids is equal to the difference between their surface tensions in the air. Thus, we include the surface tension and its temperature coefficient for each liquid, when available. The interface between the two fluids is assumed to be flat and to lie in the $x\unicode{x2013}y$ plane of the coordinate system.

Figure 1. (a) A diagram of the RBC cell. The various parts of the cell are explained in the text. (b) Photograph of the apparatus. (c) Photograph of the lower part of the cell. The red boxes indicate the thermistors, which are located at the interface and 10 mm above the interface.

The interface for the experiments presented here does not break up, which is supported by the shadowgraph image taken in the experiment. In the time-averaged sense, the temperature of the interface is assumed to be constant in the horizontal direction. The temperature of the interface then is measured by thermistors located at the centre of the interfacial surface $T_{int}$. The dimensionless control parameters of individual layers are described as the Prandtl number

(2.1)\begin{equation} Pr_{i}=\frac{\nu_{i}}{\kappa_{i}},\end{equation}

the Rayleigh number

(2.2)\begin{equation} Ra_{i}=\frac{\alpha_{i}gh_{i}^{3}\varDelta_{i}}{\nu_{i}\kappa_{i}}, \end{equation}

where $\varDelta _{i}$ is the temperature drops across each layer of fluid. The temperature drop across the lower layer is $\varDelta _{1}=T_{b}-T_{int}$. The temperature drop across the upper layer is $\varDelta _{2}=T_{int}-T_{t}$.

The surface tension of the interface has a stronger influence on the lower layer of fluid than the upper layer. In contrast to the gas–liquid system, the surface tension $\gamma$ of the interface in liquid–liquid system is the competition of surface tension of two liquids $\gamma =\lvert \gamma _{1}-\gamma _{2}\rvert$. To characterise the influence of the surface tension on the instability, here only the Marangoni number for the lower layer of fluid is defined as

(2.3)\begin{equation} Ma_{1}=\frac{\mathrm{d}\gamma}{\mathrm{d}T}\frac{h_{1}}{\nu_{1}\rho_{1}\kappa_{1}}\varDelta_{1}. \end{equation}

The Marangoni number compares the rate of transport due to Marangoni flows, with the rate of transport of diffusion.

The two-layer RBC can be described by an alternative non-dimensional control parameter, the Weber number is adopted from Huang et al. (Reference Huang, Xu, Wang, Wang, He and Tong2022) and it is defined as follows:

(2.4)\begin{equation} We=\frac{\rho_{1}g\alpha_{1}\varDelta {(h_{1}+h_{2})}^2}{\lvert \gamma_{1} - \gamma_{2} \rvert}. \end{equation}

The $We$ is the ratio of inertial to surface tension. The work conducted by Liu et al. (Reference Liu, Chong, Wang, Ng, Verzicco and Lohse2021) has shown that the interface eventually breaks up when $We$ is larger than a critical value. In the present work, The We number is much smaller than the previous literature (Huang et al. Reference Huang, Xu, Wang, Wang, He and Tong2022) that claims the interface was not broken up.

The exact definition of the Nusselt number is

(2.5)\begin{equation} Nu_{exact}=\frac{\langle u_z T \rangle_A - \kappa \partial_3\langle T \rangle_A}{\kappa \varDelta (h_1 +h_2)^{{-}1}}. \end{equation}

Here $\langle {\cdot }\rangle _A$ denotes the average over (any) horizontal plane and over time, and $u_z$ denotes the vertical component of the fluid velocity.

In the experiment of two-layer RBC, it is hard to calculate the Nusselt number of each layer over the liquid–liquid surface from the exact definition. On the solid–liquid surface in traditional RBC, the convective term $\langle u_z T\rangle _A$ equals 0 due to the no-slip BC. The solid plates are generally set to be isothermal due to the great thermal conductivity of metal material. In the individual layer of fluid in two-layer RBC, the temperature of the interface is assumed to be constant and independent of spatial position. Although the convective term $\langle u_{z}T\rangle$ is not zero at the interface, the Nusselt number of individual layer is still calculated by the equation

(2.6)\begin{equation} Nu_{i}=\frac{Qh_{i}}{A\lambda_{i}\varDelta_{i}}. \end{equation}

In the present work, measurement on a traditional RBC with only a single layer of silicone oil was also conducted for comparison. The subscript ‘$i=0$’ is denoted to the quantities measured in traditional RBC with only silicone oil. The cell height is $h_0 \equiv (h_1 + h_2)$.

3. Apparatus and performance

3.1. Apparatus

The convection cell has a design similar to that used by Huang & Xia (Reference Huang and Xia2016) and is shown in figure 1. Briefly, the convection cell has a rectangular sidewall (C) with length $L_{x} = 130$ mm, width $L_{y} = 13$ mm, and height $h_0 = 258$ mm. The cooling (D) and heating plates (B) consist of $38$ mm thick copper and a nickel-coated surface. The cell is heated by a resistive heater attached to the back of the bottom plate, and the cell is cooled by a refrigerated circulator that passes temperature-controlled water through a chamber fitted to the top plate. Six thermistors (Honeywell, model 112-104KAJ-B01, with $\text {diameter} = 1.14$ mm) are embedded in the copper plates beneath the conducting surfaces, with three thermistors in each plate. The thermistors monitor the temperature across each plate and the temperature difference $\varDelta$ across the cell. The sidewall consists of 2.85-mm-thick Plexiglas plates that are glued together to form a rectangular box. A groove is machined on the surface of the conducting plates, and an O-ring is placed in the groove to ensure a water-tight seal between the plates and the sidewall box. The top and bottom plates and the sidewall are held together by stainless steel posts (not shown in figure 1a). The cell was levelled to within 0.001 rad. To reduce the influence of surrounding temperature fluctuations and minimise heat leakage, the cell was wrapped with nitrile rubber sheets for thermal insulation and placed above a Nylon base (A) in a thermostat (F). The temperature of the thermostat was regulated by a water bath, and the temperature variation was less than $0.1\,^{\circ }{\rm C}$. The temperature of the thermostat $T_s$ was equal to the mean temperature $T_{m}\equiv (T_{t}+T_{b})/2$.

3.2. Fluid

Two immiscible fluid layers, namely, glycerol (AR, Jiangsu Qiangsheng Functional Chemistry Co., Ltd) and silicone oil (KF96L-2CS, Shin-Etsu Inc.), were used as the working fluids. The height of the glycerol was $h_{1} = 12.5$ mm, and the height of the silicone oil was $h_{2}= 245.5$ mm. Therefore, the height ratio of glycerol and whole cell is $h_{1}/h_{0}={0.048}$. The aspect ratios of the glycerol layer were $\varGamma _{xz,1}\equiv L_{x}/h_{1}=10.4$ and $\varGamma _{xy,1}\equiv L_{x}/L_{y}=10.0$. The aspect ratios of the silicone oil layer were $\varGamma _{xz, 2}= L_{x}/h_{2}=0.53$ and $\varGamma _{xy,2}= L_{x}/L_{y}=10.0$. The physical properties of the two fluids are given in table 1. The temperature difference across the glycerol layer was $1.6 \sim 22\,^{\circ }{\rm C}$, and the mean temperature of the glycerol layer was in the range $25\sim 32\,^\circ {\rm C}$, resulting in the ranges of $260< Ra_{1}<6000$ and $3708< Pr_{1}<7000$. For the silicone oil layer, the temperature difference was $1.3<\varDelta _{2}<18\,^{\circ }{\rm C}$, and the mean temperature was $14.5\sim 25\,^{\circ }{\rm C}$, resulting in the ranges $1.5\times 10^{9}< Ra_{2}<2.0\times 10^{10}$ and $28< Pr_{2}<33$.

Table 1. Physical properties of the silicone oil and glycerol at $25\,^{\circ }{\rm C}$. The physical properties of glycerol are adopted from the reference physical and thermodynamic properties of pure chemicals, Data Compilation (Daubert & Danner Reference Daubert and Danner1989). The temperature coefficient $\gamma _T$ of Glycerol is adopted from http://www.surface-tension.de/. All the physical properties of 2cS silicone oil were provided by Shin-Etsu. The physical properties except the surface tension were verified by independent measurements from a commercial company (Netzsch Inc.) (Li et al. Reference Li, He, Tian, Hao and Huang2021). The surface tension of 2cS silicone oil was measured by a commercial company.

$^a$ $20\,^{\circ }{\rm C}$.

$^{b}$ $30\,^{\circ }{\rm C}$.

The surface tensions of the glycerol and silicone oil layers were $63.4\ {\rm mN}\ {\rm m}^{-1}$ at $20\,^\circ {\rm C}$ and $16\ {\rm mN}\ {\rm m}^{-1}$ at $20\,^{\circ }{\rm C}$, respectively. Because the glycerol has a considerably stronger surface tension than the silicone oil, the edge of the interface curves down, as shown in figure 1(c). The Weber number in the present work with the value at temperature $20\,^{\circ }{\rm C}$ is $We=(\rho _1g\alpha _1\Delta H^2)/\lvert \gamma _1 - \gamma _2\rvert \approx 82$ for $\varDelta =10\,^{\circ }{\rm C}$. The Marangoni number has a value of 42.6 for $\varDelta _1=10\,^{\circ }{\rm C}$. For the reader's reference, the $We$ in Huang et al. (Reference Huang, Xu, Wang, Wang, He and Tong2022) was about 300 with Water and FC770 in both turbulent regimes.

3.3. Temperature measurement

In the fluid, two high-sensitivity metal oxide NTC thermistors with diameters of 0.3 mm and accuracies of $\pm 0.01\,^{\circ }{\rm C}$ (AB6E3-B07, GE Measurement and Control Inc.) are used to measure the temperature of the convecting fluid. As shown in figure 1, the small thermistors were fixed on a stainless steel rod and separated by 10.0 mm. To measure the heat transport characteristics, the two thermistors were located at the interface and 10.0 mm above the interface. The temperatures of the interface and centre of the silicone oil layer were then determined. All the thermistors were calibrated in a separate calibration facility against a platinum probe (Hart Scientific, model 5626), which in turn had been calibrated against various fixed points on the ITS-90 temperature scale by the Hart Scientific Division of Fluke Corporation. Consistency between all these thermometers is excellent; at the same temperature corresponding to $\varDelta =0\,^{\circ }{\rm C}$, their readings all agree within $\pm 0.01\,^{\circ }{\rm C}$. For the heat transport measurement, the resistances of the thermistors in the fluid and plates were collected at a sampling rate of 0.27 Hz. For the temperature profile measurement, the resistances of the thermistors in the fluid were collected at a sampling rate of 1.28 Hz.

3.4. Visualisation method and image analysis

The shadowgraph technique was utilised in our measurements (Xi, Lam & Xia Reference Xi, Lam and Xia2004). As shown in figure 2, the shadowgraph technique consists of a light source and two cameras. A white light point source (WenCe S2700E) was placed in front of the thermostat. From the point light source, the light was guided by optical fibres to two collimators, and two beams of collimated light were projected to the thermostat. A piece of oil paper was placed behind the cell but in front of two digital cameras. At the top placed a digital camera (Canon, model EOS6D) with an $f=50$ mm lens, and the image was collected at a rate of 25 Hz and in the size of $1080\times 1920$ pixel. At the bottom placed another digital camera (Canon, model EOS6D) with a Canon 24–105 mm lens. The image at the bottom was collected at a rate of 30 Hz and in the size of $1080\times 1920$ pixels. The flow field below the top plate, the cellular patterns of the glycerol layer, and the flow above the interfacial surface were recorded simultaneously. The duration of image recording lasts more than 24 h for each run. Since the temperature of the heated fluid parcel is higher than the ambient fluid, the intensity of transmitted light reflects the second derivative of temperature qualitatively.

Figure 2. Schematic diagram of the shadowgraph method used in the present work: 1, light source; 2, optical fibre; 3, collimator; 4, thermostat; 5, motor; 6, stainless-steel rod with thermistors attached; 7, RBC cell; 8, oil paper; 9, cameras.

3.5. Procedure and performance

The measurements were made using glycerol and 2cS silicone oil. The glycerol was injected through a capillary tube into the sample first. Then silicone oil was siphoned through another capillary tube to the sample above the glycerol layer. After this procedure, a visual inspection of the sample showed a complete absence of any bubbles. The stainless-steel rod with thermistors fixed was placed inside the sample, and two thermistors were positioned at the interface and 10 mm above the interface.

The heat transport of two-layer RBC was measured from small temperature drops to large temperature drops. In the end, we measured the heat flux through the empty cell placed in the thermostat for each set of $T_b$, $T_t$ and $T_s$ to account for the heat lost into the apparatus. Although the air was kept in the empty cell, the air was considered to be acquiescent and no convection occurred in the empty cell. Then this heat flux through the empty cell was subtracted from the measured heat flux through the two-layer fluid. The heat current through the empty cell is 63 % to 85 % of the two-layer measured heat flux. For comparison, we also conducted a similar heat flux measurement for a one-layer RBC filled with silicone oil. The correction ranged from approximately 35 % to approximately 50 % of the one-layer measured heat flux. The temperature profile in the traditional one-layer RBC was later measured. The temperature of the bottom plate, top plate, and thermostat was set as the value of $T_{int}$ and $T_t$ and $T_s$ used in two-layer RBC.

Data points were obtained by holding constant both the top- and bottom-plate temperatures. For the bottom plate, this was done by adjusting the heat power in a digital feedback loop using the mean temperature of the bottom plate $T_b$. For the top plate, a constant temperature was achieved by circulating temperature-controlled water. The heat current applied to the bottom plate and all three thermistors in each plate were monitored for a minimum of 8 h and on occasion for 10 days for temperature profile measurement under nominally constant external conditions.

The currents and temperatures recorded after the first several hours were time-averaged. The three averaged temperatures for each plate were averaged to give our best estimate of the top- and bottom-plate temperatures. A correction to these temperatures was made for the temperature change across the copper layers between the fluid and the thermistor heads. This correction was estimated to be 0.5 % (0.2 %) of $\varDelta$ for $\varDelta = 3$ $(20)\,^{\circ }{\rm C}$. The results for $T_t$ and $T_b$ yielded the final values of $T_{m}=(T_b+T_t)/2$, and of the value of $\varDelta _1=T_b-T_{int}$ and $\varDelta _2=T_{int}-T_{t}$ used to compute $Nu_1$ and $Nu_2$.

Another source of system error comes from the temperature measurement. In figures 3(a) and 3(d), we show the horizontal temperature differences $T_{t,k}-T_t$ or $T_{b,k}- T_b(k=1,2,3)$ between thermistors 1–3 from left to right and the mean temperature of plate, normalised by the applied vertical temperature difference $\varDelta _i$. In this case, $(T_{t,k}-T_t)/\varDelta$ and $(T_{b,k}-T_b)/\varDelta$ are at most of the order of a few per cent. For the determination of the Nusselt numbers, we used the average of all the thermistors in a given plate. We would estimate that this horizontal inhomogeneity of the temperature at the fluid boundary could introduce a systematic error of the order of 1.5 % into the results for $Nu$. The temperature of the interface was determined by only one thermistor. In the experiment, the interface is subject to constant heat-flux condition instead of constant temperature condition as in traditional RBC. In general, the temperature $T_{int}$ shows a fluctuation $s_{int}$ around the time-averaged value in the steady state. The value $\sigma _{int}/\varDelta _{i}$ are plotted in figures 3(b) and 3(c), and the values are less than 1 %. In the present work, the effect of the finite conductivity of the conducting plate and the effect of non-OB (Oberbeck-Boussinesq) are negligible compared with the heat loss through the thermostat discussed previously.

Figure 3. (a) Horizontal temperature differences $(T_{b,k}-T_{b})/\varDelta _1$ for the bottom plate against $\varDelta _1$ for glycerol layer. (b) Normalised temperature standard deviation at interface $\sigma _{int}/\varDelta _1$ against $\varDelta _{1}$. (c) Plot of $\sigma _{int}/\varDelta _2$ against $\varDelta _{2}$. (d) Horizontal temperature differences $(T_{t,k}-T_{t})/\varDelta _2$ for the top plate against $\varDelta _2$ for the silicone oil layer. The subscripts $k=1, 2, 3$ label the thermistors from left to right when viewed from the side.

Visualisation was made after the heat transport measurement and the black thermal-insulating rubber was removed. Visualisation was made for $\varDelta =6$, 14 and $30\,^{\circ }{\rm C}$ in order. The $Ra$ and $Pr$ numbers for each layer of fluid were listed in table 2.

Table 2. Parameters for the visualization runs.

4. Results and discussion

In the present work, we first obtain the results of global heat transport. The global heat transport $Q_{f}\sim \varDelta$ showed three ranges with different behaviours. This was mainly caused by different flow structures in the glycerol layer, which was revealed by the shadowgraph method. To quantify the control parameters in each layer of fluid, the temperature and partial slip condition of the interface shall be determined and justified first. In the following we show the temperature profile along the centreline first. Then we show the results of temperature trace and typical flow structures in three ranges, and six videos for the shadowgraph results are provided as supplementary movies available at https://doi.org/10.1017/jfm.2023.982. In the end, we provide the results of global heat transport and $Nu$ in each layer of fluid.

4.1. The temperature of the interface

The interface was assumed as a flat and isothermal surface without breaking up. In figures 4 and 5, we first show the temperature profiles along the centreline and the time-averaged shadowgraph images to justify this assumption. The measurements were taken at run E3. In figure 4(a), the time-averaged temperatures $\langle T \rangle$ were plotted. Obviously, the temperature has two different gradients above and below the interface. For $z< h_{1}$, $\langle T \rangle$ decreases as $z$ increases. For $h_{1}< z< 14.0$ mm, the temperature $\langle T\rangle$ decreases from $22.9\,^{\circ }{\rm C}$ to $20.9\,^{\circ }{\rm C}$. The intersection of two fitted lines is located at the interface $z=12.5$ mm. It means that our measurement of position is accurate. Meanwhile the standard deviation of temperature $\sigma _{T}$ increases from $0.02\,^{\circ }{\rm C}$ near the bottom plate to $0.63\,^{\circ }{\rm C}$ at $z=14.0$ mm and then decreases to $0.24\,^{\circ }{\rm C}$ at $z=20.9$ mm. This is different from the traditional BL over the liquid–solid surface (Scheel, Kim & White Reference Scheel, Kim and White2012; Shishkina et al. Reference Shishkina, Horn, Wagner and Ching2015). As a comparison, the $\langle T \rangle$ and $\sigma _{T}$ beneath the top plate were also plotted in figures 4(c) and 4(d). However, the data cannot be fitted well by analytic expression in Ahlers, Bodenschatz & He (Reference Ahlers, Bodenschatz and He2014) and Huang et al. (Reference Huang, Xu, Wang, Wang, He and Tong2022) due to the scattering of data. It is well known that there exists a thermal BL beneath the top plate. As measurements are moving away from the top conducting plate, $\langle T \rangle$ increases greatly across the BL and then reaches a constant in the bulk. The $\sigma _{T}$ increases from $0\,^{\circ }{\rm C}$ to a maximum value of $0.96\,^{\circ }{\rm C}$ and then sharply decreases to $0.15\,^{\circ }{\rm C}$ in the bulk. Although the trends of $\langle T \rangle$ and $\sigma _{T}$ over the interface are similar to those beneath the top plate, they still show differences. The maximum value of $\sigma _{T}$ over the interface with slip BC is much smaller than that under the top plate with no-slip BC. In this part, the main focus is to examine the temperature at the liquid–liquid interface $z=h_1$. It is known that at $z=0$ mm the fluid is subject to no-slip condition over the solid surface. The $\sigma _{T}$ approaches $0\,^{\circ }{\rm C}$ as $z$ approaches to 0 mm. But $\sigma _{T}$ has a value of $0.12\,^{\circ }{\rm C}$ at $z=h_{1}$. This value is much larger than the accuracy of the thermometer. The non-zero $\sigma _{T}$ at $z=h_{1}$ is evident that the interface is subject to a slip condition.

Figure 4. (a,c) Vertical position $z$ against time-averaged temperature $\langle T\rangle$. In (a) the dot-dashed line is for $z=37.6 - 1.08\langle T\rangle$ and the dashed line is for $z=21 - 0.40\langle T\rangle$. (b,d) Plots of $z$ against the standard deviation of temperature $\sigma _{t}$. The measurements were taken at run E3.

Figure 5. (a) Shadowgraph image as the background without temperature drops across the cell. (b) Time-averaged image. (c) Result of the background image subtracting the time-averaged image. The measurements were taken at run E3.

The other assumption of the interface is that the temperature in the time-averaged sense is constant along the horizontal direction. To validate this assumption, we show the shadowgraph image without any temperature drops across the cell in figure 5(a). This figure is also chosen as the background image to be subtracted in a later section. The vertical probe projects a dark thick line in the centreline. The horizontal interface also appears as a dark thick line. In figure 5(b), we also show the time-averaged image of the flow field in the run E3. Here we only discuss the shape of the interface. The interface in figure 5(b) shows a thicker dark line. To study the spatial dependence of temperature at the interface, we use figure 5(b) to subtract the background in figure 5(a), and the result is shown in figure 5(c). The white stripe at the interface has a near-constant intensity in the horizontal direction, so we can assume that the interface is isothermal horizontally.

4.2. Flow field in two-layer RBC

4.2.1. Range I: two-layer RBC with conductive glycerol layer

A time series of the temperature of conducting plates and interface for E1 were shown in figures 6(a) and 6(b). Figure 6(c) also showed the times series of total heat flux. The total duration for this run is about $2\times 10^{5}$ s (2 days). We found that the temperatures at conducting plates and the heat flux reached constant values after 500 s. The temperature $T_{int}$ of the interface reached a mean value of ${25.35}\,^{\circ }{\rm C}$ with a standard deviation of ${0.03}\,^\circ {\rm C}$.

Figure 6. (a) Time series of mean temperature $T_t$ at the top plate (blue) and $T_b$ at the bottom plate (red). (b) Time series of mean temperature $T_{int}$ at the interface. (c) Time series of heat flux $Q_{tot}$ measured at the bottom plate. The measurements were taken for run E1.

In figure 7, we showed the instantaneous images, the time average and the standard deviation of images beneath the top plate and above the bottom plate. These two instantaneous images in figures 7(a) and 7(d) were taken at the same moment. There is no obvious cellular pattern or other structures in the glycerol layer. This indicates that the glycerol layer was mainly at rest in such a condition. We did not observe the deformation of the interface. The total heat flux across the interface is the same as that across the top plate. It is surprising that many cold plumes were emitting from the top plate but no hot plume appeared above the interface in the silicone oil layer in figures 7(a) and 7(d). The different flow structures under the top plate and above the interface are attributed to the different velocity conditions applied on the top/bottom of silicone oil. The silicone oil is subjected to no-slip BC beneath the top plate, but it is subjected to slip BC on the interface.

Figure 7. (a,d) Instantaneous background-divided snapshot. (b,e) Time-averaged and contrast-enhanced image. (c,f) Standard-deviation and contrast-enhanced image. Panels (ac) were taken below the top plate and panels (df) are taken above the bottom plate. The measurements were taken for run E1.

The cold plumes in figure 7(a) have greater brightness than the background. There are at least six bright vertical stems attaching the top plate at the instantaneous moment. After detachment, the bright streaks were distributed almost everywhere. It is difficult to distinguish individual cold plumes. The cold plumes emerged into larger structures. The average speed of cold plumes in figure 7(a) was about $3\ {\rm mm}\ {\rm s}^{-1}$. Most of the cold plumes do not disappear before they sink out of the illuminated area.

In addition to the plume in the silicone oil layer, the turbulent mixing also enhances heat transport. But we cannot evaluate the portion of heat flux due to the turbulent mixing with the shadowgraph method. In fact, even the heat flux carried by plumes cannot be evaluated in the present work for the temperature of plumes is hard to determine.

To evaluate the degree of mixing of plumes, we calculate the time-averaged and standard-deviation images for run E1 as shown in figures 7(b), 7(c), 7(e) and 7(f). Under the top plate, the time-averaged image is similar to the image without heating. The bright area under the top plate of the standard-deviation image in figure 7(c) indicated that cold plumes were evenly detached from the top plate. Above the bottom plate, there is no motion of fluid observed. The standard-deviation image in the figure 7(f) was mainly caused by the fluctuation of the light source and the background.

4.2.2. Range II: two-layer RBC with oscillatory glycerol layer

For most temperature drops, the heat transport and flow field reach a steady state after a certain interval. However, there are special cases. Figures 8(a), 8(b), 8(c), 8(d) and 8(e) plot the time series of the temperature and measured heat flux $Q_{tot}$. The temperature drops were set as $\varDelta =16\,^{\circ }{\rm C}$. One sees that the temperatures at conducting plates reach a steady state in 6000 s. The temperature difference in the bottom plate increases from $0.04\,^{\circ }{\rm C}$ to about $0.06\,^{\circ }{\rm C}$ at $t=5000$ s and decreases back to $0.04\,^{\circ }{\rm C}$ at $t=15\,000$ s. At $t=20\,000$ s this temperature difference in the bottom plate starts to slowly decrease, and then it increases from $0.01\,^{\circ }{\rm C}$ at $t=41\,000$ s and reaches a constant value $0.04\,^{\circ }{\rm C}$ at $t=55\,000$ s.

Figure 8. Temperature time series at the top plate (a), $10$ mm above the interface (b), at the interface (c) and at the bottom plate (d), and the total heat flux $Q_{tot}$ time series (e). The plots in (f) show the corresponding power spectra for the segments of $T_i$ in (c). These measurements were acquired at $\varDelta =16\,^{\circ }{\rm C}$. The corresponding $Ra_{1}=1529$ and $Ra_{2}=6.72\times 10^9$.

The temperatures at the interface $T_{int}$ and 10 mm above the interface $T_{c}$ reach a steady state in a long time of 10 000 s. Then the temperatures at the interface and conducting plates remain constant for an extended period of 10 000 s. The $T_c$ value in the silicone oil layer fluctuates slightly around a mean value, which indicates that the flow in the cell is in a steady state. Then $T_{c}$ slightly decreases at $t=20\,000$ s when the temperature difference of the bottom plate starts decreasing slowly. At this point, $T_{int}$ is equal to $23.6\,^{\circ }{\rm C}$. At $t=35\,000$ s, $T_{int}$ starts to oscillate, and the magnitude of this oscillation increases over time, as shown in figure 8(c). At $t=40\,700$ s, $T_{int}$ reaches $24.8\,^{\circ }{\rm C}$ and oscillates with a greater magnitude of $1.5\,^{\circ }{\rm C}$. At $t=50\,000$ s, $T_{int}$ still oscillates; however, the magnitude and period of the oscillation are not constant. The power spectra of $T_{int}$ for these three segments are plotted in figure 8(f). The individual power spectra peak at different frequencies.

The oscillation frequency decreases from $1.742\times 10^{-3}$ Hz to $9.955\times 10^{-4}$ Hz before decreasing further to $7.466\times 10^{-4}$ Hz. These frequencies are equivalent to periods of 574, 1004 and 1339 s. These are much greater than the typical lifetime of the thermal plume in the silicone oil layer. The envelope of $T_{int}$ gradually increases starting at $t=35\,000$ s. The temperature $T_{c}$ gradually increases from $21.5\,^{\circ }{\rm C}$ at $t=40\,000$ s to $22.0\,^{\circ }{\rm C}$ at $t=67\,500$ s. The temperature $T_{c}$ also oscillates at $t=40\,000$ s with the same frequency of $T_{int}$, but the amplitude of $T_{c}$ is much smaller than that of $T_{int}$.

Similar oscillations in $T_{int}$ are also observed for the case with $\varDelta =17\,^{\circ }{\rm C}$ in figure 9. In figures 9(a) and 9(d), the temperatures in conducting plates reach a steady state in 6000 s. The temperature $T_{int}$ remains oscillating with a decreasing amplitude and decreasing frequency. As shown in figure 9(f), the oscillating frequency of $T_{int}$ from $t=0$ s to $t=6500$ s is $2.490\times 10^{-4}$ Hz, while the oscillating frequency of $T_{int}$ from $t=6500$ s to $t=27\,000$ s is $1.244\times 10^{-4}$ Hz. The oscillation of temperature $T_{int}$ ceases at $t=27\,000$ s. These oscillation frequencies are corresponding to a period of 4016 and 8037 s. The temperatures in the bottom plate show large fluctuations from $t=10\,000$ s to 15 000 s in figure 9(d). The temperature difference in the bottom plate varies from $0.04\,^{\circ }{\rm C}$ to $0.08\,^{\circ }{\rm C}$. The heat flux $Q$ also varies at the same time because the temperature of the bottom plate is controlled by a proportional–integral–derivative (PID) electric loop. But the temperatures inside the cell and at the conducting plate and the heat flux reach a steady state after $t=30\,000$ s.

Figure 9. Temperature time series at the top plate (a), $10$ mm above the interface (b), at the interface (c) and at the bottom plate (d), and the total heat flux $Q_{tot}$ time series (e). The plots in (f) show the corresponding power spectra for the segments of $T_i$ in (c). These measurements were acquired at $\varDelta =17\,^{\circ }{\rm C}$. The corresponding $Ra_{1}=1621$ and $Ra_{2}=7.41\times 10^9$.

To reveal the flow structure causing this oscillatory temperature in the interface, we later removed the rubber around the sidewall to obtain the shadowgraph image. The temperature drop across the cell was set to zero to set the fluid into a motionless state. Then the temperature drop $\varDelta =14\,^{\circ }{\rm C}$ was set. The temperatures of conducting plates and the interface for run E2 were plotted in figures 10(a) and 10(b). The time series of measured heat flux provided by the electric heater was also plotted in figure 10(c). The temperatures of conducting plates and the heat flux reached constant values after 3000 s. But the temperature measured at the interface starts to oscillate from 8000 s. The amplitude of this oscillation is about $1.1\,^{\circ }{\rm C}$ but it is not a constant value. The period of oscillation is about 2200 s (36 min). After 57 700 s, the temperature at the interface remains the oscillation with the amplitude $1.4\,^{\circ }{\rm C}$ and a period of 2580 s (43 min).

Figure 10. (a) Time series of temperature $T_t$ (blue) and $T_b$ (red). (b) Time series of the interface temperature $T_{int}$ at the interface. (c) Time series of $Q_{tot}$ at the bottom plate. The measurements were taken for run E2.

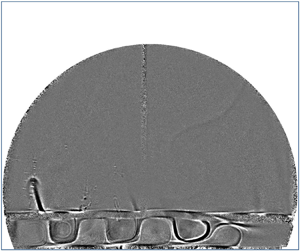
We chose five moments corresponding to three successive troughs and two successive crests of $T_{int}$. The corresponding images of the glycerol layer were shown in figure 11. We observed that square rolls keep moving to the right. The left side of each square roll has a larger temperature while the right side of the roll has a lower temperature. On the left corner of the glycerol layer, a small roll was formed. The size of the roll gradually increased as the roll moved to the right. Once the roll passes through the thermistor at the centre of the interface, the lower side of the roll gradually lifts upwards, and the shape of the roll gradually evolves to an elliptic shape. When the roll reached $L_{x}/4$ away from the right side of the cell, a secondary roll appeared in the lower right position next to the roll. In the end, the roll disappeared before it reached the right side of the cell. The size of the roll increased from 0.05$L_{x}$ at the left corner to 0.12$L_{x}$ at the centre of the bottom plate. The separation between successive rolls is 0.12$L_{x}$. The average speed of the roll is $0.012\ {\rm mm}\ {\rm s}^{-1}$. The visualisation in figure 11 confirmed that the oscillatory temperature in the interface was a result of the movement of the periodical cellular pattern in the glycerol.

Figure 11. (a,c,e,g,i) Instantaneous background-divided and contrast-enhanced images for five moments labelled in the previous figure. (b,d,f,h,j) Cartoon of the images on the left column. The red color indicates that the sides of the roll with greater temperature than the background, and the blue color represents a colder temperature. The measurements were taken for run E2.

We also observed the hot plumes emitted from the interface and cold plumes under the top plate in figure 12. In figures 12(a) and 12(d), the flow fields were taken at the same moment. The cold plumes in figure 12(a) are much more chaotic than the hot plumes in figure 12(d). There are at least six bright vertical stems attaching the top plate at the instantaneous moment. After detachment, the bright streaks were distributed almost everywhere. It is difficult to distinguish individual cold plumes. The cold plumes emerged into larger structures. The average speed of cold plumes in figure 12(a) was about $6\ {\rm mm}\ {\rm s}^{-1}$. Most of the cold plumes do not disappear before they sink out of the illuminated area.

Figure 12. (a,d) Instantaneous background-divided snapshot. (b,e) Time-averaged and contrast-enhanced image. (c,f) Standard-deviation and contrast-enhanced image. Panels (ac) are taken below the top plate and panels (df) are taken above the bottom plate. The measurements were taken for run E2.

In figure 12(d), several hot vertical thermals appear at the same time. The largest structure above the interface is a dark mushroom-shaped plume on the left side. Initially, the stem erupts from a position $0.4L_{x}$ away from the left sidewall on the interfacial surface. As time varies the stem grows upwards and moves to the left slowly. The width of the stem slowly increases from 0 to about 5 mm and then the plume disappears. The lifetime of a stem is about 23 s. Note that we do not observe the detachment of the stem. The height of the stem grows from 0 to 20 mm. The average speed of hot plumes is about $2\ {\rm mm}\ {\rm s}^{-1}$. The interface showed a sinusoidal shape. The wave number of the sinusoidal interface is $m=4$. It seems that the crest is dark and the trough is bright.

The time-averaged and standard deviation images for run E2 were shown in figures 12(b), 12(c), 12(e) and 12(f). Under the top plate, the time-averaged image is similar to the image without heating. The bright area of figure 12(c) showed the detachment of cold plumes beneath the top plate. The time-averaged image in figure 12(e) showed a thin bright streak over the interface with a thickness of 1 mm. The standard deviation image in figure 12(f) also showed a bright streak over the interface. Obviously, the thickness of the bright streak is greater at the position closer to the sidewall. This indicated that the hot plumes appeared at these positions more frequently. In the glycerol layer, the movement of cellular rolls causes bright areas. The brightest area appears in the right corner, where the cellular rolls mix and disappear.

4.2.3. Range III: two-layer RBC with convective glycerol layer

In figure 13, we show a time series of the temperatures and the heat flux for run E3. The temperature drop across the cell increases from zero to a constant value in 1000 s. There is no oscillation observed in $T_{int}$. In figure 14, we showed the instantaneous, time-averaged and standard-deviation images of the two-layer RBC under the top plate and over the bottom plate. In figure 14(a), we observed the cluster of cold plumes. The average width of cold plumes in present $\varDelta$ is thinner than cold plumes for smaller $\Delta T$ in run E2. In figure 14(d), more than four mushroom-shaped hot plumes are emitted from the interface. The width of the hot plume is about 12 mm. The average lifetime of hot plumes is 10 s, shorter than that of hot plumes for E2 with a smaller $\varDelta$. The average speed of hot plumes is about $5\ {\rm mm}\ {\rm s}^{-1}$, and it is much greater than that for E2. In the lower layer, three obvious dark wavelets were formed above the bottom plate. This is the wavy variation of the temperature with horizontal distance from the left side of the cell. There are four vertical dark pillars formed at the troughs of the wavelets above the bottom plate. The height of the pillars is 8 mm and the width is 5 mm. The pattern in the glycerol layer is time-independent so the standard deviation image showed no obvious pattern in the glycerol layer. The wave number of the pattern and the shape of the interface is $m=4$. Beneath the top plate, the cold plumes showed more complicated shapes. The cold plumes were inclined to elongate into larger structures or emerge into larger structures. We also observed that hot plumes rise toward the top plate. The average speed of the cold plumes is about $10\ {\rm mm}\ {\rm s}^{-1}$. This is much greater than that of the cold plume for E2 with a smaller $\varDelta$ and it is also much greater than hot plumes.

Figure 13. (a) Time series of $T_{t}$ (blue) and $T_b$ (red). (b) Time series of $T_{int}$. (c) Time series of $Q_{tot}$. The measurements were taken for the run E3.

Figure 14. (a,d) Instantaneous background-divided snapshot. (b,e) Time-averaged and contrast-enhanced image. (c,f) Standard-deviation and contrast-enhanced image. Panels (ac) are taken below the top plate and panels (df) are taken above the bottom plate. The measurements were taken for the run E3.

4.3. Heat transport in two-layer RBC

In two-layer RBC, the temperature drop $\varDelta$ across the whole cell can be set as constant values. The global heat flux $Q_{f}$ transferred through the fluid reaches a statistically steady value. With increasing $\varDelta$ (equivalent to thermal-driven force), the global effective heat transport quantity $Q_{f}/\varDelta$ grows as shown in figure 15. The data were plotted in both logarithmic scales. Power laws were fitted into data in different ranges to yield exponents of 0.8, 2.4, 4.2 and 1.68, respectively. Two vertical lines $\varDelta =7\,^{\circ }{\rm C}$ and $19\,^{\circ }{\rm C}$ divided the data into three ranges. It is noted that the temperature inside the fluid is not involved in the global quantity $Q_{f}/\varDelta$. The flow structures in the glycerol layer in different ranges were attributed to different heat transport.

Figure 15. Heat flux through the fluid $Q_{f}$ against $\varDelta$. The vertical lines represent $\varDelta ={7}\,^{\circ }{\rm C}$ and ${19}\,^{\circ }{\rm C}$. From left to right, the solid lines are $Q_f=0.0118 \varDelta ^{0.8\pm 0.1}$, $Q_f=5.6\times 10^{-4}\varDelta ^{2.4\pm 0.1}$, $Q_f=2.4 \times 10^{-6}\varDelta ^{4.2\pm 0.7}$ and $Q_f=4.2\times 10^{-4} \varDelta ^{1.68\pm 0.04}$.

To characterise global heat transport, the temperature of interface $T_{int}$ is required. With $T_{int}$, the temperature drops across each layer of fluid are obtained in figure 16(a). For a given $\varDelta$, the temperature drop $\varDelta _1$ across the glycerol layer is greater than that across the silicone oil layer. In figure 16(b), the ratio $\varDelta _{1}/\varDelta$ increases in the range I and II, but $\varDelta _{1}/\varDelta$ decreases from 0.58 to 0.53 in the range III.

Figure 16. (a) Temperature drops across each layer of fluid $\varDelta _{i}$ against temperature drops $\varDelta$ across the whole cell. (b) Ratio $\varDelta _{i}/\varDelta$ against $\varDelta$. Squares: $i = 1$. Circles: $i = 2$.

4.3.1. Heat transport in the glycerol layer

We now examine heat transport in the glycerol layer. For most cases of the heat flux $Q$, the temperature $T_{int}$ exhibits small fluctuations, resulting in an almost constant temperature difference across the glycerol layer. Plots of $Ra_{1}$ and $Nu_{1}$ in the glycerol layer are given in figure 17(a). Here $Nu_{1}$ has a value of 0.98 for $Ra_1<547$. For $547< Ra_{1}<800$, the value of $Nu_1$ is up to 1.11. For the glycerol layer, the error of measurement comes from the temperature accuracy and the heat flux. As we mentioned previously in § 3.5, in the empty cell measurement the cell is assumed to have no air, which is unpractical. Although the error of Nusselt measurement is quite large, one sees clearly that the heat transport increases sharply at about $Ra_{1,c}=1523$ in the glycerol layer in the two-layer RBC from the figure 17(a). Here the value of $Ra_{1,c}$ was corresponding to $\varDelta =15\,^{\circ }{\rm C}$. In the heat-transport measurement, the $Nu_1$ has increased by 50 % for $\varDelta =16\,^{\circ }{\rm C}$. Since the increment of $\varDelta$ in the present work is $1\,^{\circ }{\rm C}$, the percentage uncertainty of $Ra_{1,c}$ shall be 6 %. The sharp increase of $Nu_{1}$ occurs at $Ra_{1,c}$ because convection sets in inside the glycerol layer and the oscillation of the interface temperature is the result of the onset. This jump in $Nu_{1}\sim Ra_{1}$ suggests that the transition from conduction to convection is a subcritical bifurcation. For $Ra_{1}>Ra_{1,c}$, $Nu_{1}$ gradually increases with increasing $Ra_{1}$, and the data can be fitted by a logarithmic. The intersections of the fittings and the horizontal line $Nu_1=1$ yield a value of $Ra_{1}$=848. This value is much smaller than $Ra_{1,c}$ determined from $Nu_1$ above. Compared with $Ra_{1,c}$, this value of Rayleigh number is closer to the theoretical critical value 658 of the RBC with both-free surface (Chandrasekhar Reference Chandrasekhar1961). The theoretic value of the critical $Ra$ for the two-dimensional infinite RBC with both rigid bounding surfaces is 1708, and the wave number is 3.117. The theoretic value of $Ra_c$ for RBC with one rigid and one free surface is 1101, and the wave number is 2.682 (Chandrasekhar Reference Chandrasekhar1961). The value of $Ra_{1,c}$ with resolution of measurement in the present work is smaller than that with both rigid surfaces and is greater than that with one rigid and one free surface. The interfacial surface in the present work is not the free surface due to the presence of the upper liquid layer. The emission of hot plumes in the upper liquid layer and the surface tension provide temporal–spatial stress on the upper boundary of the glycerol layer. This makes the interfacial surface not satisfy the zero-stress requirement of the free surface. Thus, it is not a surprise that the present value of $Ra_{1,c}$ is different from the theoretical value of the critical Rayleigh number.

Figure 17. (a) Plot of $Nu_1$ vs $Ra_1$ in the glycerol layer in two-layer RBC. The dotted line is the fit function $Nu_{1}=0.826\ln Ra_{1}-4.57$. From left to right, vertical lines are $Ra_1=547$, 1523 and $1901$. (b) Ranges of $Pr_1$ and $Ra_1$ in the glycerol layer.

4.3.2. Heat transport in the silicone oil layer

The $Nu_2$ in the silicone oil layer is plotted as a function of $Ra_2$ in figure 18. For comparison, we also plot the results measured in an identical cell with only silicone oil as the working fluid. The Nusselt in the traditional RBC is well described as $Nu_{0}=0.0810Ra_{0}^{0.33\pm 0.02}$ for a constant $Pr_{0}=28$. The $Nu_{2}$ in the silicone oil layer in the two-layer RBC showed different trends. For $Ra_{2}<8 \times 10^{9}$, the $Nu_{2}$ increases as $Ra_2$ increases. But $Nu_2$ cannot be fitted by a power law. For $Ra_2$ values beyond $8 \times 10^{9}$, the value of $Nu_{2}$ increases significantly and then follows a power-law function $Nu_{2}=0.0267Ra_{2}^{0.37\pm 0.03}$. Although the exponent is slightly greater than the exponent of traditional RBC, the value of $Nu_{2}$ in the silicone oil layer in a two-layer RBC is smaller than that in traditional RBC. For $Ra_{2}<8 \times 10^{9}$, $Nu_2$ is about 50 % to 80 % of the $Nu_0$ in traditional RBC when the Glycerol layer is dominated by conduction. For $Ra_{2}>8 \times 10^{9}$, $Nu_2$ is about 85 % to 93 % of the $Nu_0$ in traditional RBC when the glycerol layer is dominated by the convection. Although the $Pr_2$ is slightly greater than the $Pr_0$ of traditional RBC, the effect of Prandtl on heat transport in such a Rayleigh number range is negligible (Xia, Lam & Zhou Reference Xia, Lam and Zhou2002). To further understand the different heat transport of the silicone oil in two-layer RBC, the measurement of the temperature profile inside the fluid might shed light on it.

Figure 18. (a) Plots of $Nu_2$ vs $Ra_2$ in the silicone layer in the two-layer RBC (solid squares) and $Nu_0$ vs $Ra_0$ for traditional RBC (open triangles). The dot-dashed line shows the function fitted to the data: $Nu_0=0.0810Ra_{0}^{0.33\pm 0.02}$. The solid line is the function $Nu_{2}=0.0267Ra_{2}^{0.37\pm 0.03}$. From left to right, vertical lines are $Ra_{2}=3.3\times 10^{9}$ and $8.0\times 10^{9}$. (b) Diagram of $Pr_2\sim Ra_{2}$ and $Pr_0\sim Ra_{0}$.

5. Discussion and summary

In the present work, the contribution of convection in heat transport defined as $\langle u_{z}T\rangle H/(\kappa \varDelta )$ was neglected, so the direct measurement of the contribution of convection over an interfacial surface would help us to quantify and understand the heat transport in two-layer RBCs. In the present work, the difference between cold plumes and hot plumes lies in the shape, velocity and number density. But it is difficult to study these differences only by the shadowgraph method, which can only provide a qualitative description of the temperature of the fluid. To better understand the heat transport carried by plumes, liquid crystals or simulations are more suitable for researchers to conduct the investigation.

Another interesting issue related to two-layer RBCs is the movement of the interfacial surface and its effect on the thermal BL. In the experiment by Huang et al. (Reference Huang, Xu, Wang, Wang, He and Tong2022), researchers conducted an experiment in a two-layer RBC where two layers of fluids are well-developed turbulence. They found that the interfacial surface has a statistically stationary flat surface. This is different from our observation. In the present work, although the glycerol layer is only dominated by conduction or convection, it also strongly affects the silicone oil layer. The interfacial surface moves towards the silicone oil layer and forms a group of wavelets. Thus, more measurements on two-layer RBC in a larger range of controlling parameters are needed to provide us with an opportunity to explore the effect of a liquid layer on the thermal BL.

In this study, we have experimentally investigated the flow field and heat transport in two-layer RBC with two immiscible liquids. When the thin glycerol layer is stably stratified, this layer provides a slip condition for the silicone oil layer. Under the slip condition, the heat transport in the silicone oil layer above the glycerol layer is reduced by the definition ignoring the convection. When the glycerol layer reaches an unstable state and forms time-independent cellular patterns, the interfacial surface moves toward the silicone oil and a group of wavelets is formed. The number of wavelets equals half of the cellular pattern's mode number in the glycerol layer. The temperature profile in such a condition is asymmetric. The thickness of thermal BL is smaller than the traditional RBC in the same Rayleigh number. The heat transport of the silicone oil layer is smaller than the traditional RBC, but its exponent equals that of traditional RBC. The effect of the glycerol layer on LSC and the viscous BL in silicone oil is not in the scope of the present work but may be of interest in future studies.

Supplementary movies

Supplementary movies are available at https://doi.org/10.1017/jfm.2023.982.

Funding

We thank S.-D. Huang, L. Zhang, S. Chen and B.-F. Wang for their helpful discussions. The authors wish to acknowledge the financial support from National Key R&D Program of China (grant no. 2022YFC3003404) and the National Natural Science Foundation of China (grant nos 11872281 and 12272271).

Declaration of interests

The authors report no conflict of interest.

Appendix A. Calculation of heat flux through fluids and error analysis

In this appendix, we show how the heat flux through fluids was calculated. The schematic of the RBC cell with air and with fluids were shown in figures 19(a) and 19(b), respectively. With a given temperature of bottom plate $T_{b}$ and top plate $T_{t}$, the total heat flux provided by the electric heater was $Q_{tot,j}$ ($\,j=0$ or 1). We used subscript ‘$j=0$’ here to represent the empty cell (with still air) and ‘$j=1$’ to represent the two-layer fluid system. The total heat flux was distributed into four parts. The first is $Q_{f,j}$, the heat flux passing through the air or fluid with temperature drop $T_{b}-T_{t}$. The second is $Q_{w,j}$, the heat flux passing through the sidewall from bottom to top. The third is $Q_{p,j}$, the heat flux passing through the sidewall from the fluid to the environment. The fourth is $Q_{b,j}$, the heat flux passing through the hot bottom plate to the environment. If the latter three parts were assumed to be dominated by conduction, the difference between values of $Q_{tot,0}$ and $Q_{tot,1}$ were mainly caused by different values of heat flux through air $Q_{f,0}$ and fluid $Q_{f,1}$. The value of $Q_{f,0}$ can be negligible because the thermal conductivity of air is very small. Thus, it is fair to use the value $Q_{tot,1} - Q_{tot,0}$ as the heat flux $Q_{f,1}$.

Figure 19. (a) Schematic of the RBC cell with air with a temperature drop $T_{b}-T_{t}$. (b) RBC cell with two layers of fluids with a temperature drop $T_{b}-T_{t}$.

The heat flux $Q_{tot,0}$ measured in the empty cell takes up a large portion of the total heat flux measured. By subtracting the empty cell heat flux, we aim to obtain more accurate results in heat flux through the fluid $Q_{f,1}=Q_{tot,1} - Q_{tot,0}$. We assume that

(A1)\begin{equation} Q_{tot,j}=Q_{tot,j}\pm \delta Q_{tot,j}. \end{equation}

The uncertainties $\delta Q_{tot,j}$ can be evaluated as the standard deviation of $Q_{tot,j}$. These two values are quite small. Thus, we obtain

(A2)\begin{equation} \delta Q_{f,1}=\delta Q_{tot,0}+\delta Q_{tot,1}. \end{equation}

The percentage uncertainty $\delta Q_{f,1}/Q_{f,1}$ has a value of 2 % since

(A3)\begin{gather} Ra_i=\frac{\alpha_{i} g\varDelta_{i} h_{i}^{3}}{\nu_{i}\kappa_{i}}, \end{gather}
(A4)\begin{gather}Nu_i=\frac{Q_{f,1}h_{i}}{A\lambda_{i}\varDelta_{i} }. \end{gather}

The uncertainties of the physical properties of the fluid are negligible. The uncertainty in height is also negligible. Then we obtain

(A5)\begin{gather} \frac{\delta Ra_i}{Ra_i} =\frac{\delta \varDelta_i}{\varDelta_i}, \end{gather}
(A6)\begin{gather}\frac{\delta Nu_i}{Nu_i} =\frac{\delta \varDelta_i}{\varDelta_i} +\frac{\delta Q_{f,1}}{Q_{f,1}}. \end{gather}

The absolute uncertainty of $\varDelta _{i}$ is mainly caused by the uncertainty of $T_{int}$. The percentage uncertainty of most $\varDelta _{i}$ is about 1 %. Then it is fair to say that the percentage uncertainties in $Ra_i$ and $Nu_i$ are about 1 % and 3 %.

References

Ahlers, G., Bodenschatz, E. & He, X. 2014 Logarithmic temperature profiles of turbulent Rayleigh–Bénard convection in the classical and ultimate state for a Prandtl number of 0.8. J. Fluid Mech. 758, 436467.CrossRefGoogle Scholar
Ahlers, G., Grossmann, S. & Lohse, D. 2009 Heat transfer and large scale dynamics in turbulent Rayleigh–Bénard convection. Rev. Mod. Phys. 81, 503538.CrossRefGoogle Scholar
Bodenschatz, E., Pesch, W. & Ahlers, G. 2000 Recent developments in Rayleigh–Bénard convection. Annu. Rev. Fluid Mech. 32, 709778.CrossRefGoogle Scholar
Busse, F.H. 1981 On the aspect ratios of two-layer mantle convection. Phys. Earth Planet. Inter. 24 (4), 320324.CrossRefGoogle Scholar
Busse, F.H. & Petry, M. 2009 Homologous onset of double layer convection. Phys. Rev. E 80, 046316.CrossRefGoogle ScholarPubMed
Casper, J.M. 1977 Physical chemistry of surfaces (3rd ed.), Arthur W. Adamson, Wiley-Interscience, New York, 1976. J. Polym. Sci., Polym. Lett. Ed. 15 (10), 632633.CrossRefGoogle Scholar
Chandrasekhar, S. 1961 Hydrodynamic and Hydromagnetic Stability. Oxford University Press.Google Scholar
Chillà, F. & Schumacher, J. 2012 New perspectives in turbulent Rayleigh–Bénard convection. Eur. Phys. J. E 35, 58.CrossRefGoogle ScholarPubMed
Clever, R.M. & Busse, F.H. 1974 Transition to time-dependent convection. J. Fluid Mech. 65, 625.CrossRefGoogle Scholar
Croquette, V. 1989 Convective pattern dynamics at low Prandtl number: part I. Contemp. Phys. 30 (2), 113133.CrossRefGoogle Scholar
Daubert, T.E. & Danner, R.P. 1989 Physical and Thermodynamic Properties of Pure Chemicals. Hemisphere Publishing Corporation.Google Scholar
Degen, M.M., Colovas, P.W. & Andereck, C.D. 1998 Time-dependent patterns in the two-layer Rayleigh–Bénard system. Phys. Rev. E 57, 66476659.CrossRefGoogle Scholar
Diwakar, S.V., Tiwari, S., Das, S.K. & Sundararajan, T. 2014 Stability and resonant wave interactions of confined two-layer Rayleigh–Bénard systems. J. Fluid Mech. 754, 415455.CrossRefGoogle Scholar
Hébert, F., Hufschmid, R., Scheel, J. & Ahlers, G. 2010 Onset of Rayleigh–Bénard convection in cylindrical containers. Phys. Rev. E 81, 046318.CrossRefGoogle ScholarPubMed
Huang, H.l., Xu, W., Wang, Y., Wang, X.-P., He, X.-Z. & Tong, P. 2022 Fluctuation-induced slip of thermal boundary layers at a stable liquid–liquid interface. J. Fluid Mech. 951, A10.CrossRefGoogle Scholar
Huang, S.-D. & Xia, K.-Q. 2016 Effects of geometric confinement in quasi-2D turbulent Rayleigh–Bénard convection. J. Fluid Mech. 794, 639654.CrossRefGoogle Scholar
Johnson, D. & Narayanan, R. 1997 Geometric effects on convective coupling and interfacial structures in bilayer convection. Phys. Rev. E 56, 54625472.CrossRefGoogle Scholar
Johnson, D. & Narayanan, R. 1999 A tutorial on the Rayleigh–Marangoni–Bénard problem with multiple layers and side wall effects. Chaos 9 (1), 124140.CrossRefGoogle ScholarPubMed
Juel, A., Burgess, J.M., McCormick, W.D, Swift, J.B. & Swinney, H.L. 2000 Surface tension-driven convection patterns in two liquid layers. Physica D 143 (1), 169186.CrossRefGoogle Scholar
Li, X.-M., He, J.-D., Tian, Y., Hao, P. & Huang, S.-D. 2021 Effects of Prandtl number in quasi-two-dimensional Rayleigh–Bénard convection. J. Fluid Mech. 915, A60.CrossRefGoogle Scholar
Liu, H.-R., Chong, K.L., Wang, Q., Ng, C.S., Verzicco, R. & Lohse, D. 2021 Two-layer thermally driven turbulence: mechanisms for interface breakup. J. Fluid Mech. 913, A9.CrossRefGoogle Scholar
Liu, H.-R., Chong, K.L., Yang, R., Verzicco, R. & Lohse, D. 2022 Heat transfer in turbulent Rayleigh–Bénard convection through two immiscible fluid layers. J. Fluid Mech. 938, A31.CrossRefGoogle Scholar
Lohse, D. & Xia, K.-Q. 2010 Small-scale properties of turbulent Rayleigh–Bénard convection. Annu. Rev. Fluid Mech. 42, 335364.CrossRefGoogle Scholar
Lyubimov, D.V., Lyubimova, T.P., Alexander, J.I.D. & Lobov, N.I. 1998 On the Boussinesq approximation for fluid systems with deformable interfaces. Adv. Space Res. 22 (8), 11591168, proceedings of the G0.1 Symposium of COSPAR Scientific Commission G.CrossRefGoogle Scholar
Lyubimov, D.V., Lyubimova, T.P., Lobov, N.I. & Alexander, J.I.D. 2018 Rayleigh–Bénard–Marangoni convection in a weakly non-Boussinesq fluid layer with a deformable surface. Phys. Fluids 30 (2), 024103.CrossRefGoogle Scholar
Nataf, H.C., Moreno, S. & Cardin, Ph. 1988 What is responsible for thermal coupling in layered convection? J. Phys. (Paris) 49, 17071714.CrossRefGoogle Scholar
Neelin, J.D., Latif, M & Jin, F 1994 Dynamics of coupled ocean-atmosphere models: the tropical problem. Annu. Rev. Fluid Mech. 26 (1), 617659.CrossRefGoogle Scholar
Olson, P., Silver, P.G. & Carlson, R.W. 1990 The large-scale structure of convection in the Earth's mantle. Nature 344 (6263), 209215.CrossRefGoogle Scholar
Prakash, A. & Koster, J.N. 1994 Convection in multiple layers of immiscible liquids in a shallow cavity - I. Steady natural convection. Intl J. Multiphase Flow 20, 383396.CrossRefGoogle Scholar
Rasenat, S., Busse, F.H. & Rehberg, I. 1989 A theoretical and experimental study of double-layer convection. J. Fluid Mech. 199, 519540.CrossRefGoogle Scholar
Regnier, V.C., Dauby, P.C. & Lebon, G. 2000 Linear and nonlinear Rayleigh–Bénard–Marangoni instability with surface deformations. Phys. Fluids 12 (11), 27872799.CrossRefGoogle Scholar
Renardy, Y. & Renardy, M. 1985 Perturbation analysis of steady and oscillatory onset in a Bénard problem with two similar liquids. Phys. Fluids 28 (9), 26992708.CrossRefGoogle Scholar
Richter, F.M. & Johnson, C.E. 1974 Stability of a chemically layered mantle. J. Geophys. Res. 79 (11), 16351639.CrossRefGoogle Scholar
Scanlon, J.W. & Segel, L.A. 1967 Finite amplitude cellular convection induced by surface tension. J. Fluid Mech. 30 (1), 149162.CrossRefGoogle Scholar
Schatz, M.F., VanHook, S.J., McCormick, W.D., Swift, J.B. & Swinney, H.L. 1995 Onset of surface-tension-driven Bénard convection. Phys. Rev. Lett. 75, 19381941.CrossRefGoogle ScholarPubMed
Schatz, M.F., VanHook, S.J., McCormick, W.D., Swift, J.B. & Swinney, H.L. 1999 Time-independent square patterns in surface-tension-driven Bénard convection. Phys. Fluids 11 (9), 25772582.CrossRefGoogle Scholar
Scheel, J.D., Kim, E. & White, K.R. 2012 Thermal and viscous boundary layers in turbulent Rayleigh–Bénard convection. J. Fluid Mech. 711, 281305.CrossRefGoogle Scholar
Shishkina, O., Horn, S., Wagner, S. & Ching, E.S.C. 2015 Thermal boundary layer equation for turbulent Rayleigh–Bénard convection. Phys. Rev. Lett. 114, 114302.CrossRefGoogle ScholarPubMed
Tackley, P.J. 2000 Mantle convection and plate tectonics: toward an integrated physical and chemical theory. Science 288 (5473), 20022007.CrossRefGoogle ScholarPubMed
Xi, H.D., Lam, S. & Xia, K.-Q. 2004 From laminar plumes to organized flows: the onset of large-scale circulation in turbulent thermal convection. J. Fluid Mech. 503, 4756.CrossRefGoogle Scholar
Xia, K.-Q., Lam, S. & Zhou, S.Q. 2002 Heat-flux measurement in high-Prandtl-number turbulent Rayleigh–Bénard convection. Phys. Rev. Lett. 88, 064501.CrossRefGoogle ScholarPubMed
Xie, Y.-C. & Xia, K.-Q. 2013 Dynamics and flow coupling in two-layer turbulent thermal convection. J. Fluid Mech. 728, R1.CrossRefGoogle Scholar
Yoshida, M. & Hamano, Y. 2016 Numerical studies on the dynamics of two-layer Rayleigh–Bénard convection with an infinite Prandtl number and large viscosity contrasts. Phys. Fluids 28 (11), 116601.CrossRefGoogle Scholar
Figure 0

Figure 1. (a) A diagram of the RBC cell. The various parts of the cell are explained in the text. (b) Photograph of the apparatus. (c) Photograph of the lower part of the cell. The red boxes indicate the thermistors, which are located at the interface and 10 mm above the interface.

Figure 1

Table 1. Physical properties of the silicone oil and glycerol at $25\,^{\circ }{\rm C}$. The physical properties of glycerol are adopted from the reference physical and thermodynamic properties of pure chemicals, Data Compilation (Daubert & Danner 1989). The temperature coefficient $\gamma _T$ of Glycerol is adopted from http://www.surface-tension.de/. All the physical properties of 2cS silicone oil were provided by Shin-Etsu. The physical properties except the surface tension were verified by independent measurements from a commercial company (Netzsch Inc.) (Li et al.2021). The surface tension of 2cS silicone oil was measured by a commercial company.

Figure 2

Figure 2. Schematic diagram of the shadowgraph method used in the present work: 1, light source; 2, optical fibre; 3, collimator; 4, thermostat; 5, motor; 6, stainless-steel rod with thermistors attached; 7, RBC cell; 8, oil paper; 9, cameras.

Figure 3

Figure 3. (a) Horizontal temperature differences $(T_{b,k}-T_{b})/\varDelta _1$ for the bottom plate against $\varDelta _1$ for glycerol layer. (b) Normalised temperature standard deviation at interface $\sigma _{int}/\varDelta _1$ against $\varDelta _{1}$. (c) Plot of $\sigma _{int}/\varDelta _2$ against $\varDelta _{2}$. (d) Horizontal temperature differences $(T_{t,k}-T_{t})/\varDelta _2$ for the top plate against $\varDelta _2$ for the silicone oil layer. The subscripts $k=1, 2, 3$ label the thermistors from left to right when viewed from the side.

Figure 4

Table 2. Parameters for the visualization runs.

Figure 5

Figure 4. (a,c) Vertical position $z$ against time-averaged temperature $\langle T\rangle$. In (a) the dot-dashed line is for $z=37.6 - 1.08\langle T\rangle$ and the dashed line is for $z=21 - 0.40\langle T\rangle$. (b,d) Plots of $z$ against the standard deviation of temperature $\sigma _{t}$. The measurements were taken at run E3.

Figure 6

Figure 5. (a) Shadowgraph image as the background without temperature drops across the cell. (b) Time-averaged image. (c) Result of the background image subtracting the time-averaged image. The measurements were taken at run E3.

Figure 7

Figure 6. (a) Time series of mean temperature $T_t$ at the top plate (blue) and $T_b$ at the bottom plate (red). (b) Time series of mean temperature $T_{int}$ at the interface. (c) Time series of heat flux $Q_{tot}$ measured at the bottom plate. The measurements were taken for run E1.

Figure 8

Figure 7. (a,d) Instantaneous background-divided snapshot. (b,e) Time-averaged and contrast-enhanced image. (c,f) Standard-deviation and contrast-enhanced image. Panels (ac) were taken below the top plate and panels (df) are taken above the bottom plate. The measurements were taken for run E1.

Figure 9

Figure 8. Temperature time series at the top plate (a), $10$ mm above the interface (b), at the interface (c) and at the bottom plate (d), and the total heat flux $Q_{tot}$ time series (e). The plots in (f) show the corresponding power spectra for the segments of $T_i$ in (c). These measurements were acquired at $\varDelta =16\,^{\circ }{\rm C}$. The corresponding $Ra_{1}=1529$ and $Ra_{2}=6.72\times 10^9$.

Figure 10

Figure 9. Temperature time series at the top plate (a), $10$ mm above the interface (b), at the interface (c) and at the bottom plate (d), and the total heat flux $Q_{tot}$ time series (e). The plots in (f) show the corresponding power spectra for the segments of $T_i$ in (c). These measurements were acquired at $\varDelta =17\,^{\circ }{\rm C}$. The corresponding $Ra_{1}=1621$ and $Ra_{2}=7.41\times 10^9$.

Figure 11

Figure 10. (a) Time series of temperature $T_t$ (blue) and $T_b$ (red). (b) Time series of the interface temperature $T_{int}$ at the interface. (c) Time series of $Q_{tot}$ at the bottom plate. The measurements were taken for run E2.

Figure 12

Figure 11. (a,c,e,g,i) Instantaneous background-divided and contrast-enhanced images for five moments labelled in the previous figure. (b,d,f,h,j) Cartoon of the images on the left column. The red color indicates that the sides of the roll with greater temperature than the background, and the blue color represents a colder temperature. The measurements were taken for run E2.

Figure 13

Figure 12. (a,d) Instantaneous background-divided snapshot. (b,e) Time-averaged and contrast-enhanced image. (c,f) Standard-deviation and contrast-enhanced image. Panels (ac) are taken below the top plate and panels (df) are taken above the bottom plate. The measurements were taken for run E2.

Figure 14

Figure 13. (a) Time series of $T_{t}$ (blue) and $T_b$ (red). (b) Time series of $T_{int}$. (c) Time series of $Q_{tot}$. The measurements were taken for the run E3.

Figure 15

Figure 14. (a,d) Instantaneous background-divided snapshot. (b,e) Time-averaged and contrast-enhanced image. (c,f) Standard-deviation and contrast-enhanced image. Panels (ac) are taken below the top plate and panels (df) are taken above the bottom plate. The measurements were taken for the run E3.

Figure 16

Figure 15. Heat flux through the fluid $Q_{f}$ against $\varDelta$. The vertical lines represent $\varDelta ={7}\,^{\circ }{\rm C}$ and ${19}\,^{\circ }{\rm C}$. From left to right, the solid lines are $Q_f=0.0118 \varDelta ^{0.8\pm 0.1}$, $Q_f=5.6\times 10^{-4}\varDelta ^{2.4\pm 0.1}$, $Q_f=2.4 \times 10^{-6}\varDelta ^{4.2\pm 0.7}$ and $Q_f=4.2\times 10^{-4} \varDelta ^{1.68\pm 0.04}$.

Figure 17

Figure 16. (a) Temperature drops across each layer of fluid $\varDelta _{i}$ against temperature drops $\varDelta$ across the whole cell. (b) Ratio $\varDelta _{i}/\varDelta$ against $\varDelta$. Squares: $i = 1$. Circles: $i = 2$.

Figure 18

Figure 17. (a) Plot of $Nu_1$ vs $Ra_1$ in the glycerol layer in two-layer RBC. The dotted line is the fit function $Nu_{1}=0.826\ln Ra_{1}-4.57$. From left to right, vertical lines are $Ra_1=547$, 1523 and $1901$. (b) Ranges of $Pr_1$ and $Ra_1$ in the glycerol layer.

Figure 19

Figure 18. (a) Plots of $Nu_2$ vs $Ra_2$ in the silicone layer in the two-layer RBC (solid squares) and $Nu_0$ vs $Ra_0$ for traditional RBC (open triangles). The dot-dashed line shows the function fitted to the data: $Nu_0=0.0810Ra_{0}^{0.33\pm 0.02}$. The solid line is the function $Nu_{2}=0.0267Ra_{2}^{0.37\pm 0.03}$. From left to right, vertical lines are $Ra_{2}=3.3\times 10^{9}$ and $8.0\times 10^{9}$. (b) Diagram of $Pr_2\sim Ra_{2}$ and $Pr_0\sim Ra_{0}$.

Figure 20

Figure 19. (a) Schematic of the RBC cell with air with a temperature drop $T_{b}-T_{t}$. (b) RBC cell with two layers of fluids with a temperature drop $T_{b}-T_{t}$.

Supplementary material: File

Wang et al. supplementary movie 1

The shadowgraph result above the bottom plate for run E1
Download Wang et al. supplementary movie 1(File)
File 8.3 MB
Supplementary material: File

Wang et al. supplementary movie 2

The shadowgraph result below the top plate for run E1
Download Wang et al. supplementary movie 2(File)
File 9.3 MB
Supplementary material: File

Wang et al. supplementary movie 3

The shadowgraph result above the bottom plate for run E2
Download Wang et al. supplementary movie 3(File)
File 8.1 MB
Supplementary material: File

Wang et al. supplementary movie 4

The shadowgraph result below the top plate for run E2
Download Wang et al. supplementary movie 4(File)
File 10 MB
Supplementary material: File

Wang et al. supplementary movie 5

The shadowgraph result above the bottom plate for run E3
Download Wang et al. supplementary movie 5(File)
File 7.6 MB
Supplementary material: File

Wang et al. supplementary movie 6

The shadowgraph result below the top plate for run E3
Download Wang et al. supplementary movie 6(File)
File 5.8 MB