INTRODUCTION
Mathematical models of infectious diseases have an important role to play in informing disease control strategies and in helping to understand the epidemiology of infectious diseases [Reference Anderson and May1, Reference Hethcote2]. The modelling of sexually transmitted infections (STIs) began in the 1970s, in response to concern over the dramatic increases in the number of reported gonorrhoea cases in the USA [Reference Cooke and Yorke3, Reference Hethcote and Yorke4]. These early models of gonorrhoea were simple ‘SIS’ (susceptible-infected-susceptible) models, in which it was assumed that individuals were susceptible to re-infection immediately after recovery. Infected individuals were also classified as symptomatic or asymptomatic, and symptomatic individuals were assumed to remain symptomatic until their infections resolved [Reference Hethcote and Yorke4]. This early work proved particularly influential, with many subsequent models of gonorrhoea [Reference Garnett5–Reference White7], chlamydial infection [Reference Turner8, Reference Kretzschmar9] and trichomoniasis [Reference Bowden and Garnett10, Reference White11] making the same assumptions about the absence of immunity following the resolution of infection, and the absence of movements between the symptomatic and asymptomatic states.
The assumption that there is no immunity following STI resolution is supported by the observation that individuals frequently become re-infected after having been treated for gonorrhoea [Reference Moodley12, Reference Schmidt13], chlamydial infection [Reference Burstein14] and trichomoniasis [Reference Lyng and Christensen15]. However, this does not exclude the possibility that some individuals may be temporarily or partially immune following successful treatment, nor does it exclude the possibility of immunity following the spontaneous resolution of infection. In the case of gonorrhoea, there is some evidence of strain-specific immunity following resolution [Reference Moodley12, Reference Plummer16], although the extent of immunity following cure appears to be negligible if treatment is initiated early in infection [Reference Schmidt13]. There is more substantial evidence of immunity in the case of chlamydial infection [Reference Brunham17–Reference Golden19], although evidence again suggests that immunity is likely to be less significant if treatment is initiated early in infection [Reference Su20]. In the case of trichomoniasis, there is some evidence suggestive of immunity [Reference Weston and Nicol21], and it is possible to induce strong immune responses in untreated mice [Reference Abraham22].
There is also little evidence to support the assumption that symptomatic infections remain symptomatic until resolution. Symptomatic gonorrhoea cases can become asymptomatic, with partially effective treatment possibly playing a role [Reference Handsfield23]. It is also believed that symptomatic chlamydial infection will tend to become asymptomatic [Reference Schachter24], although there is little published data to demonstrate this [Reference Prentice, Taylor-Robinson and Csonka25]. In the case of trichomoniasis, it is not clear to what extent symptomatic infections become asymptomatic.
Mathematical models of infectious diseases are often sensitive to assumptions about immunity and development of symptoms, and it is therefore important to examine critically the generally accepted assumptions in STI modelling. This paper extends the standard SIS model for curable STIs to incorporate temporary immunity and to allow for symptomatic infections that become asymptomatic. The objective of this paper is to assess whether these extensions lead to closer agreement between model estimates of STI prevalence and observed patterns of STI prevalence, and to evaluate whether these extensions materially influence the model estimates of the effect of STI control programmes.
METHODS
This analysis is based on a deterministic model of HIV and other STIs. The model has been applied to South Africa, and is described in detail elsewhere [Reference Johnson26–Reference Johnson28]. Briefly, the model divides the sexually active population by age and sex, and further divides the population into several risk groups that are defined in terms of marital status, propensity for concurrent partnerships, and number of current partners. A separate state is defined for women who are commercial sex workers (CSWs), and men who have a propensity for concurrent partnerships are assumed to visit CSWs at a rate that depends on their current number of partners. There are thus three types of partnership modelled: non-spousal short-term relationships, spousal relationships, and once-off contacts between CSWs and their clients. Individuals are assumed to acquire new partners and marry at a rate that depends on their age, sex, marital status and propensity for multiple partnerships. Relationships are assumed to be terminated at rates that depend on age and sex (in the case of marital relationships) as well as the type of relationship and partner mortality rate. Assumptions about the frequency of sex and levels of condom use are set for each type of relationship, and levels of condom use are assumed to increase over time in response to information, education and communication (IEC) campaigns, based on South African sexual behaviour data [Reference Johnson26].
The model simulates the transmission of HIV and a number of other STIs, including gonorrhoea, chlamydial infection and trichomoniasis. For each of these three STIs, the same approach to modelling the course of infection is adopted, and this model is illustrated in Figure 1. Susceptible individuals become infected at rate λ, and a proportion (ϕ1) develop symptoms. In the absence of treatment, symptomatic and asymptomatic infections resolve spontaneously at rates σ1 and σ2, respectively. Symptomatic individuals seek treatment at rate υ and this is effective with probability ψ. Health-seeking behaviour and practices of healthcare providers are assumed to follow patterns observed in South African surveys, with a trend towards increasing use of syndromic management protocols since 1994 [Reference Johnson28]. Asymptomatic infections can also resolve through treatment, at rate η.
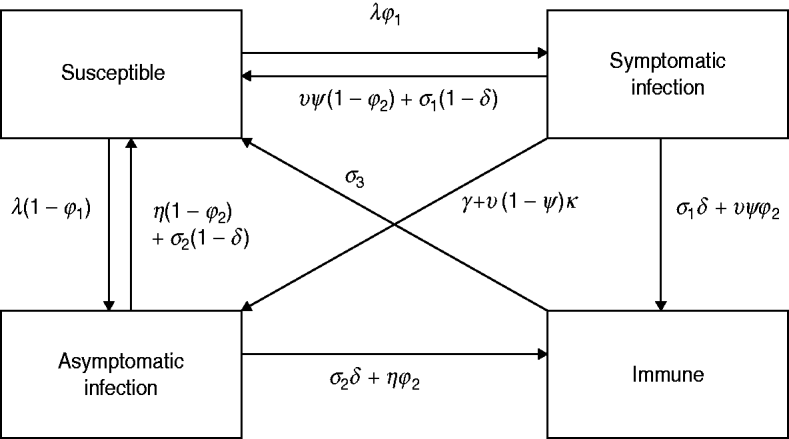
Fig. 1. Multi-state model of the course of infection. The same model structure is assumed for gonorrhoea, chlamydial infection and trichomoniasis. Parameters vary with respect to age, sex, sexual activity group, HIV status and time, and the numbers of individuals in the above states are calculated separately for each combination of age, sex, sexual activity group and HIV status variables. Births, deaths and movements between age groups, sexual activity groups and HIV states are not shown in the figure.
To reflect the uncertainty regarding the extent of immunity and the degree of symptomatic-to-asymptomatic movement, we consider five different models (Table 1). Model 1 is the standard SIS model in which there is no immunity following recovery, and no symptomatic infections become asymptomatic. Models 2 and 3 allow for immunity following the spontaneous resolution of infection, but only model 3 allows for immunity in a proportion (ϕ2) of successfully treated individuals. Models 4 and 5 allow for symptomatic infections to become asymptomatic in the absence of treatment, and model 5 also allows for a proportion (κ) of symptomatic individuals to become asymptomatic if they receive ineffective treatment.
Table 1. Prior distribution means and standard deviations (in parentheses), for models 1–5
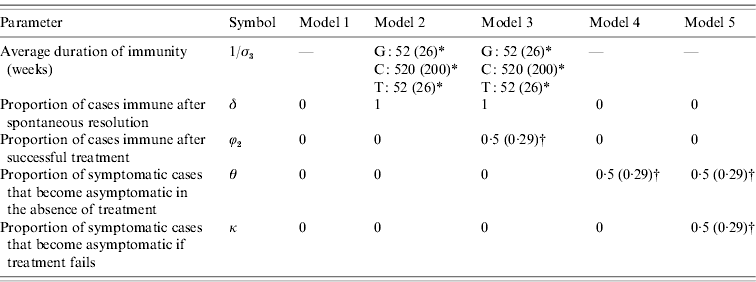
Means and standard deviations (in parentheses) are specified for parameters that are assigned prior distributions. For parameters that are not assigned prior distributions, a single parameter value is specified.
* A gamma prior distribution is used. For gonorrhoea (G) and trichomoniasis (T), evidence of immunity is limited, and the gamma prior distribution assigned to the average duration of immunity therefore has a lower mean and standard deviation than is assumed for chlamydial infection (C).
† A uniform (0, 1) prior distribution is used.
A Bayesian approach is adopted in fitting the model to South African STI prevalence data, and in performing uncertainty analysis [Reference Johnson, Alkema and Dorrington27]. Prior distributions are specified to represent the ranges of uncertainty around the rates of progression between the states shown in Figure 1. The prior distributions for the immunity and symptomatic-to-asymptomatic transition rates are specified in Table 1; priors representing uncertainty regarding transmission probabilities, proportions of infections that become symptomatic and average durations of infection are specified elsewhere [Reference Johnson, Alkema and Dorrington27]. In the case of models 4 and 5, a uniform (0, 1) prior is specified for the proportion of symptomatic cases that would become asymptomatic in the absence of treatment, θ, and the rate at which symptomatic infections become asymptomatic in the absence of treatment, γ, is calculated by noting that
A likelihood function is specified to represent the ‘goodness of fit’ when comparing observed STI prevalence levels and the model estimates of STI prevalence, for a given combination of model parameters [Reference Johnson, Alkema and Dorrington27]. A random-effects approach is adopted in defining the likelihood function, since STI prevalence data are collected from different sentinel surveillance sites in independently conducted studies [Reference Johnson, Coetzee and Dorrington29]. Although the samples cannot be considered nationally representative, the random-effects approach has been shown to produce estimates of STI prevalence close to the prevalence levels measured in nationally representative surveys in the case of syphilis [Reference Johnson, Alkema and Dorrington27]. The standard deviation of the random effects, σb, represents the extent of the variability in STI prevalence measurements that cannot be explained by the model, after controlling for binomial variation and variation in diagnostic accuracy. Models that provide a good fit to the data will therefore tend to have low σb values.
For each model, posterior estimates of STI prevalence and model parameters are obtained using incremental mixture importance sampling [Reference Raftery and Bao30]. This involves randomly sampling from the prior distributions and adapting the sampling based on the likelihood values calculated for the previously sampled parameter combinations. To assess which models provide the best fit to the data, each of models 2–5 is compared to model 1 using Bayes factors, which represent the ratio of the weighted average likelihood of the model to the weighted average likelihood of model 1, where the weights are defined by the prior distributions. Bayes factors are interpreted according to the significance thresholds recommended by Kass & Raftery [Reference Kass and Raftery31]. As Bayes factors are to some extent influenced by the choice of prior distributions, which is subjective, the models are also compared in terms of the standard deviation of the random effects, which is a more objective measure of the goodness of fit to the STI prevalence data.
Finally, models 1–5 are compared in terms of their estimates of the impact of changes in STI treatment practices and changes in sexual behaviour. The former is estimated by comparing the default modelled STI prevalence trends with the trends that would have occurred in the absence of syndromic management, and calculating the percentage difference between the two in 2005. The impact of increased condom usage is estimated by comparing the STI prevalence trends that the model estimates using the default sexual behaviour assumptions, and the STI prevalence trends that would have occurred in the absence of increased condom use; the percentage difference between the two in 2005 is the estimated impact of increased condom use.
RESULTS
Figure 2 compares the observed levels of STI prevalence in South African women with the posterior mean estimates of STI prevalence from models 1 and 3 (results for the other models are not shown, as model 2 results are similar to those of model 3, and the results of models 4 and 5 are similar to those of model 1). For all three STIs, model 3 appears to provide a better fit to the data than model 1, particularly in the case of CSWs. Model 3 also appears to estimate a more gradual decline in STI prevalence following the changes in STI treatment and sexual behaviour in the mid-1990s. In the case of chlamydial infection, model 1 tends to underestimate prevalence in women aged 15–49 years in order to compensate for the overestimation of prevalence in CSWs, since model 1 is not capable of estimating similar levels of chlamydial prevalence in CSWs and women in the general population.
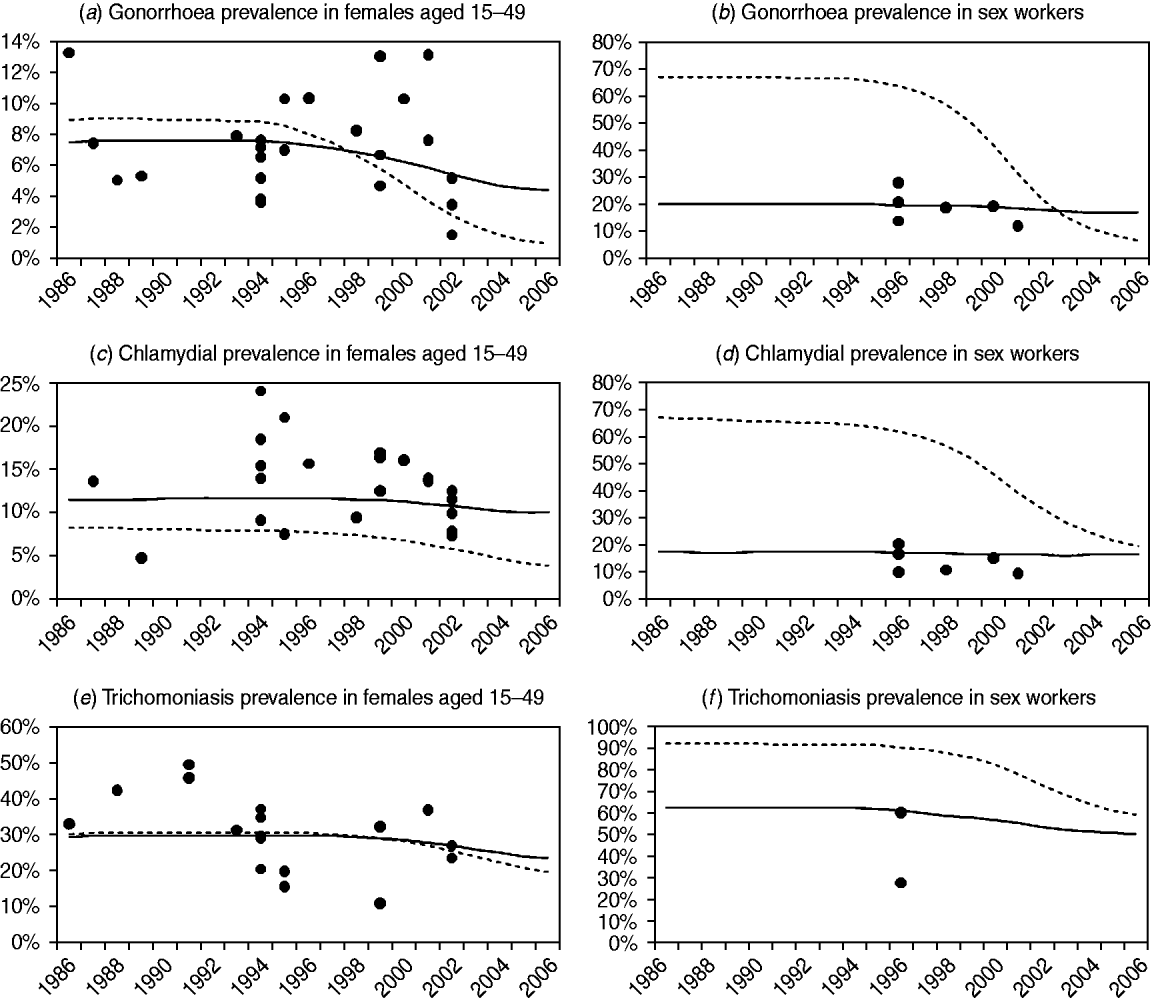
Fig. 2. Comparison of observed sexually transmitted infection (STI) prevalence levels and STI prevalence levels estimated by models 1 and 3. Posterior mean estimates of STI prevalence are represented by dashed lines for model 1 and by solid lines for model 3 (the results of model 2 are virtually indistinguishable from the results of model 3, and the results of models 4 and 5 are both virtually indistinguishable from the results of model 1). Observed STI prevalence levels, after adjusting for test sensitivity and specificity, are represented by solid circles. In panels (a), (c) and (e), observations are from studies of STI prevalence in antenatal clinics, family planning clinics and households. In panels (b), (d) and (f), observations are from studies of STI prevalence in commercial sex workers.
The differences in the goodness of fit are quantified more formally in Table 2. In the case of gonorrhoea and chlamydial infection, the Bayes factors for models 2 and 3 are extremely high, indicating very strong evidence that the models that allow for immunity are more consistent with the observed STI prevalence data than model 1. In addition, the standard deviations of the random effects are substantially lower for models 2 and 3 than for model 1, suggesting that more of the variation in observed STI prevalence levels can be explained by models that allow for immunity. In the case of trichomoniasis, the Bayes factors for models 2 and 3 provide strong evidence that modelling immunity improves the fit of the model, but the standard deviations of the random effects in models 2 and 3 are not lower than those in model 1.
Table 2. Comparison of Bayes factors and posterior parameter estimates (with 95% confidence intervals)
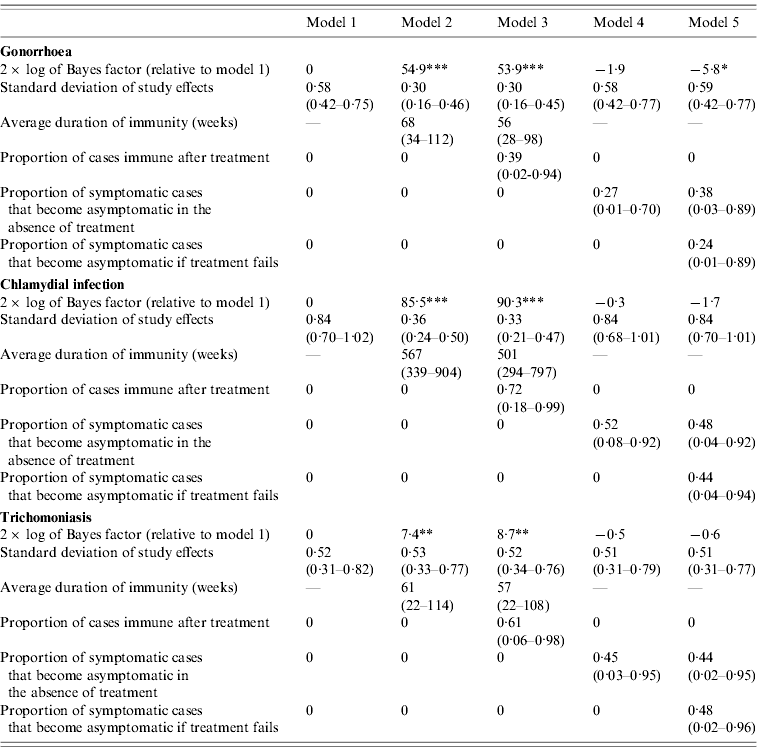
* Positive evidence that model 1 is superior; **, strong evidence that the model is superior to model 1; ***, very strong evidence that the model is superior to model 1.
For all three STIs, the Bayes factors for models 4 and 5 do not suggest any improvement over model 1, and allowing for symptomatic infections to become asymptomatic therefore does not improve the model fit to the observed STI prevalence data. In the case of gonorrhoea, the Bayes factor indicates positive evidence against model 5, but for all three STIs, the estimated standard deviations of the random effects in models 4 and 5 are similar to those in model 1.
The estimated impacts of improvements in STI treatment and increases in condom usage are compared in Figure 3, for each of the three STIs. In the case of gonorrhoea, models 1, 4 and 5 estimate significant reductions in prevalence as a result of syndromic management, while the models that allow for immunity estimate a more modest reduction. For both chlamydial infection and trichomoniasis, the models that do not allow for immunity estimate a small but positive reduction in prevalence due to syndromic management. However, model 2 estimates a small increase in prevalence due to syndromic management, since immunity is assumed to develop only following the spontaneous resolution of infection, and treatment therefore arrests the natural immune response. In model 3, which allows for immunity in a proportion of successfully treated individuals, the impact of syndromic management is not significantly different from zero.
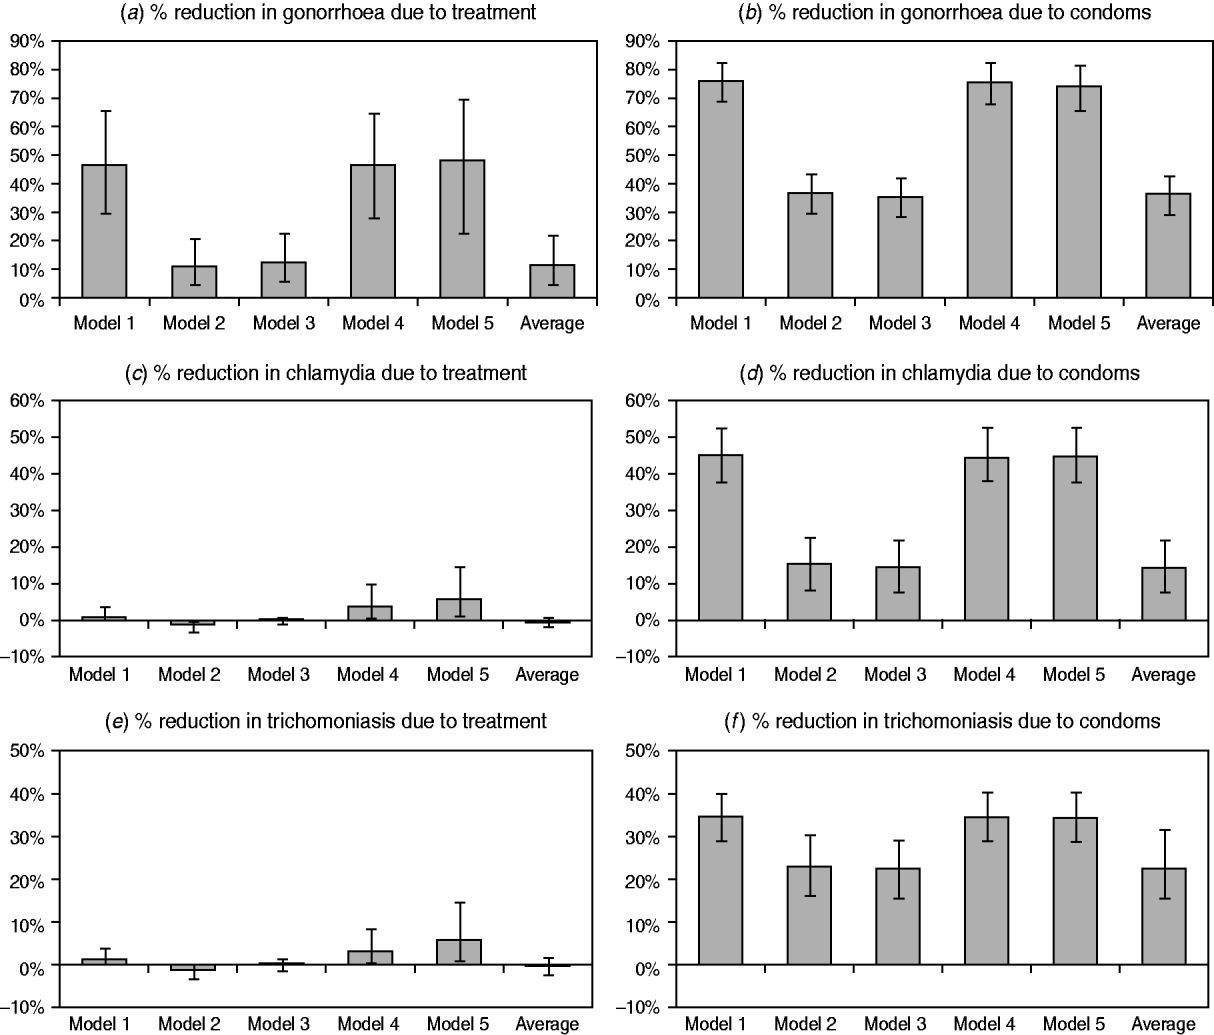
Fig. 3. Changes in sexually transmitted infection (STI) prevalence by 2005 attributable to improvements in STI treatment and increases in condom usage. STI prevalence is calculated in the population aged 15–49 years. Panels (a), (c) and (e) represent the difference between the scenarios with and without the introduction of syndromic management protocols. Panels (b), (d) and (f) represent the difference between the scenarios with and without increases in condom usage. The model average is calculated by weighting the results from the different models by the weighted average likelihood estimated for each model.
For all three STIs, the impact of increased condom usage is a significant reduction in STI prevalence, and this reduction is more substantial in the models that do not allow for immunity than in models 2 and 3. The weighted average reductions in the prevalence due to increased condom usage are similar to those estimated in the models that allow for immunity, as it is these models that have the highest average likelihood values and hence the greatest weights.
DISCUSSION
This analysis suggests that models that allow for immunity to gonorrhoea and chlamydial infection are more consistent with patterns of STI prevalence in South Africa than models that do not allow for immunity. In particular, models that allow for immunity are more consistent with the modest differences in observed STI prevalence between CSWs and women in the general population, and also are more in line with the observation that South African data do not demonstrate any clear trend in gonorrhoea and chlamydial prevalence over the last decade [Reference White32]. These results support the arrested immunity hypothesis presented by Brunham and colleagues, who have argued that immune responses to chlamydial infection are less likely to develop when treatment is initiated in the early stages of infection, and that efforts to intensify the treatment of chlamydial infection may therefore achieve only transient decreases in chlamydial prevalence [Reference Brunham33–Reference Rekart and Brunham35]. In the case of trichomoniasis, our results are less clear; although the Bayes factors suggest strong evidence of immunity, the standard deviations of the random effects do not reduce when allowing for immunity, which implies that the high Bayes factors for models 2 and 3 could simply be due to the way in which the prior distributions have been chosen.
The finding that immunity significantly affects the fitting of the model is perhaps unexpected, especially considering that the average duration of immunity to gonorrhoea and trichomoniasis is estimated to be fairly short (<2 years). However, in groups that are highly exposed to STIs, such as CSWs, even immunity of short duration can significantly reduce the prevalence of the STI. In addition, immunity tends to lessen the impact of changes in sexual behaviour and improvements in STI treatment, since the direct effect of such interventions, in terms of reduced transmission risk or reduced duration of infection, is partially offset by the effect of reduced prevalence of immunity. Similar dynamics affect other infections such as syphilis [Reference Garnett36] and malaria [Reference Anderson and May1]; mathematical models suggest that even when there is only partial immunity to these infections, interventions may fail to have a significant impact in the long term because of reducing levels of acquired immunity following the introduction of the intervention [Reference Anderson and May1].
Although a few recent models of chlamydial infection have made allowance for immunity [Reference White11, Reference Brunham33, Reference Regan, Wilson and Hocking37], most mathematical models of curable STIs assume that individuals are susceptible to re-infection immediately after recovery. Garnett and colleagues observe that in the case of gonorrhoea, the standard SIS model produces estimates of prevalence that are unrealistically sensitive to changes in parameters [Reference Garnett5]. Our results suggest that allowing for immunity renders gonorrhoea models significantly less sensitive to assumed changes in treatment and sexual behaviour, and the same is true for chlamydial infection and trichomoniasis. It is therefore important that mathematical modellers consider the potential role of immunity when advising policy-makers on STI control programmes, as failure to allow for this dynamic may lead to model forecasts that exaggerate the likely impact of STI interventions.
A limitation of this analysis is that it does not consider the potential role of strain-specific immunity, which has been shown to be significant in the case of gonorrhoea [Reference Plummer16]. If there is little cross-reactivity in immune responses and if there is substantial diversity in the strains of a STI circulating in a population, immune responses to the STI may have little influence on the overall prevalence of the STI. Further modelling is required, allowing for the evolution of different strains and incorporating strain-specific prevalence data. Another limitation of this analysis is that it does not consider potential transitions from asymptomatic infection to symptomatic infection. Although the incubation period from STI acquisition to the appearance of symptoms is usually a matter of days – and thus of limited importance when infections persist for several weeks on average – it is possible that a subset of individuals may develop symptoms over longer periods. Further research is required to assess whether this could be epidemiologically significant.
A possible criticism of this analysis is that most of the evidence against the SIS models derives from the implausibly high SIS model estimates of STI prevalence levels in CSWs, which may in fact be due to unrealistic assumptions about (a) sexual activity in CSWs or (b) health-seeking behaviour in CSWs, rather than unrealistic assumptions about immunity. The first possibility seems unlikely, since the assumptions about the sexual behaviour of CSWs are based mostly on the same studies from which CSW STI prevalence levels are obtained, and the assumed levels of risk behaviour would thus only be inconsistent with the observed STI prevalence levels if CSWs were exaggerating their risk behaviours. The second possibility also seems unlikely, since the model allows for a higher rate of health-seeking in CSWs than in women in the general population, for both symptomatic and asymptomatic STIs (at rates of 0·90/week and 0·025/week, respectively [Reference Abdool Karim38–Reference Morison40]). Antibiotic access is tightly controlled in South Africa, and there is little evidence to suggest that South African CSWs self-treat with antibiotics [Reference Abdool Karim38].
A more general concern is that factors other than immunity might explain the failure of the standard SIS model to match the observed STI prevalence patterns in South Africa. To the extent that all STI models make simplifying assumptions about sexual behaviour and STI transmission dynamics, it is difficult to rule out the possibility of other explanations. This analysis is therefore suggestive rather than conclusive regarding the role of immunity in the epidemiology of gonorrhoea, chlamydial infection and trichomoniasis. We have considered the possibility that alternative models, which allow for symptomatic infections to become asymptomatic, might give a better fit to the South African STI prevalence data, but have shown that this is not the case. There is a need for further analyses to assess whether allowing for immunity significantly improves model fits to data collected in other settings. There is also a need for further clinical research to evaluate the significance of immune responses in treated and untreated STI patients.
DECLARATION OF INTEREST
None.


