INTRODUCTION
Pertussis, or whooping cough, is a highly infectious respiratory disease mainly caused by Bordetella pertussis and more rarely by Bordetella parapertussis. Unvaccinated infants are at greatest risk for severe complications or death due to pertussis. At the beginning of the twentieth century, before vaccines were widely used, epidemics of pertussis were observed to recur at intervals of 2–3 years [Reference Young1]. Since the introduction of vaccination in the 1950s, the incidence of pertussis has strongly decreased. However, even in countries with high vaccination coverage, pertussis shows epidemic peaks every 3–4 years [Reference Broutin2–Reference Gomes4]. Moreover, some studies report pertussis has seasonality which is not consistent in time and place [Reference Fine and Clarkson3, Reference Skowronski5, Reference Tanaka6], although others studies have shown seasonality to be absent during periods of high vaccine uptake [Reference Anderson7].
Seasonal increases are a common phenomenon in infectious diseases, but underlying mechanisms are not completely clear [Reference Altizer8]. For respiratory pathogens seasonal increases are thought to be driven by seasonal variations in survival of the pathogen outside the host, host behaviour and the level of host immunity [Reference Grassly and Fraser9]. Opening of schools with subsequent crowding of susceptible persons has been described as one of the major contributors to the annual rise in measles [Reference Fine and Clarkson10] and may also play a role in seasonal increases in the incidence of pertussis [Reference Fine and Clarkson3, Reference Brennan11, Reference Guris12].
In the last decades an upsurge in incidence has been observed in many industrialized countries with a continuously high vaccination coverage, especially in adolescents and adults [Reference Celentano13–Reference Dworkin15]. Consequently, new vaccination strategies for pertussis are currently under discussion in many countries [Reference Forsyth16]. Studying seasonal trends for pertussis may reveal important routes of transmission and help to eventually give insight into the possible impact of future vaccination strategies. We analysed long-term trends and age-specific differences in seasonality for pertussis in The Netherlands during the years 1996–2006, and scrutinized the effect of school opening on the incidence of pertussis.
METHODS
Disease surveillance
Pertussis is a statutory notifiable disease in The Netherlands. Since 1988 the case definition for notification includes a clinical presentation compatible with pertussis (i.e. serious cough with a duration of >2 weeks and/or coughing attacks and/or cough followed by vomiting) in combination with: isolation of B. pertussis or B. parapertussis – detection of B. pertussis or B. parapertussis DNA by PCR, or a significant rise in IgG antibodies against pertussis toxin or IgA antibodies against whole-cell sonicate of B. pertussis in paired serum samples, or a single serum sample with IgA/IgG titres above a defined age-specific cut-off value [Reference de Melker17], or contact in the last 3 weeks with a laboratory-confirmed patient with B. pertussis or B. parapertussis infection. Notifications for pertussis during the years 1989–2006 were collected by week and month of onset and stratified by age groups: 0–4 years (children at home); 5–12 years (children attending primary school); 13–18 years (adolescents attending secondary school); and 19–99 years (adults).
Statistical analysis
We aimed to model the expected monthly incidence for each age group, corrected for long-term trends, autocorrelation and monthly trends. We allowed Y t (t=1, 2, …, 126) to denote the reported pertussis incidences for month t from January 1996 until June 2006. Since the time series Y t are expected to show autocorrelation, Poisson models with autocorrelated errors are required to correctly describe the time series of pertussis incidences [Reference Heisterkamp18–Reference Zeger20]. We used hierarchical time-series models using a procedure called Non-Parametric empirical Bayesian Time Series Analysis (NPBats) [Reference Heisterkamp18, Reference Dekkers and Heisterkamp21]. The basic idea is to assume simple prior models for modelling the difference between two or more consecutive observations in a time series. In contrast to ARIMA models for time series – where all observations are used to calculate the expected value at time t and the relationship between two consecutive observations is fixed – the autocorrelation between observations in this method is modelled locally with a moving window of variable width.
We allowed μt=E(Y t) to denote the expected incidence of reported pertussis cases in month t. We defined a generalized linear model [Reference McCullagh and Nelder22] with log link function. The expected incidence for month t is then given by
and
Equation (1) relates the expected pertussis incidences, μt for month t to the unknown parameters ηt which are of interest since they can be expressed as
where Xt (t=1, 2, …, 126) (10·5 years of months) denote the covariables and βt=(β0t, β1, …, βp)T the unknown regression coefficients, with p the number of covariates, e.g. p=12 when time is included as a continuous covariate and 11 dummy variables are used to model the specific contribution of each month compared to January. Note that all covariates are assumed constant over time and that β0t depends on the time of sampling, thus accounting for the autocorrelation in the time series Y t.
As in Heisterkamp et al. [Reference Heisterkamp18] we propose four nested models for the intercept β0t ranging from no autocorrelation to autocorrelation comparable with a second-order autoregressive model. The four models for the time-dependent, random intercept of equation (3) are
Model (4) is designated the mean prior model: a stationary intercept β0 and a normally distributed noise with variance λ−1. Model (5) is designated a neighbour model: the expectation at time t is assumed equal to its value at time t – 1. In other words, the difference of two consecutive β0t's is normally distributed with mean zero and variance λ−1. Model (6) is designated linear since the expectation of the difference of two consecutive differences is zero and finally model (7) is designated quadratic since it consists of the second-order difference of three consecutive differences.
All four models are applied to the time series and the one with the lowest Akaike Bayesian Information criterion (ABIC) was selected as the best one [Reference Heisterkamp18, Reference Dekkers and Heisterkamp21]. The estimated month effects are reported as rate ratios in respect of January. Pearson correlation coefficients were calculated to compare month effects between age groups. Furthermore, the best-fit model per age-group was used to predict monthly incidences for July 2006 to June 2007, which were compared with observed data for the same period.
To assess the possible relationship between seasonality of pertussis and the crowding of children at schools after holiday periods, the week effects in the incidence of notified cases in the 5–12 and 13–18 years age groups during 2000–2004 were assessed using the same models as described above, but now with week as covariate. Modelled peak incidences were set against date of school opening after summer holidays. Because of the staggering of summer holidays regimens in The Netherlands, opening of schools is in weeks 32, 33 or 34.
Data analyses were performed with SAS 9.1, Excel and S-PLUS 6.2. A P value <0·05 was considered statistically significant.
RESULTS
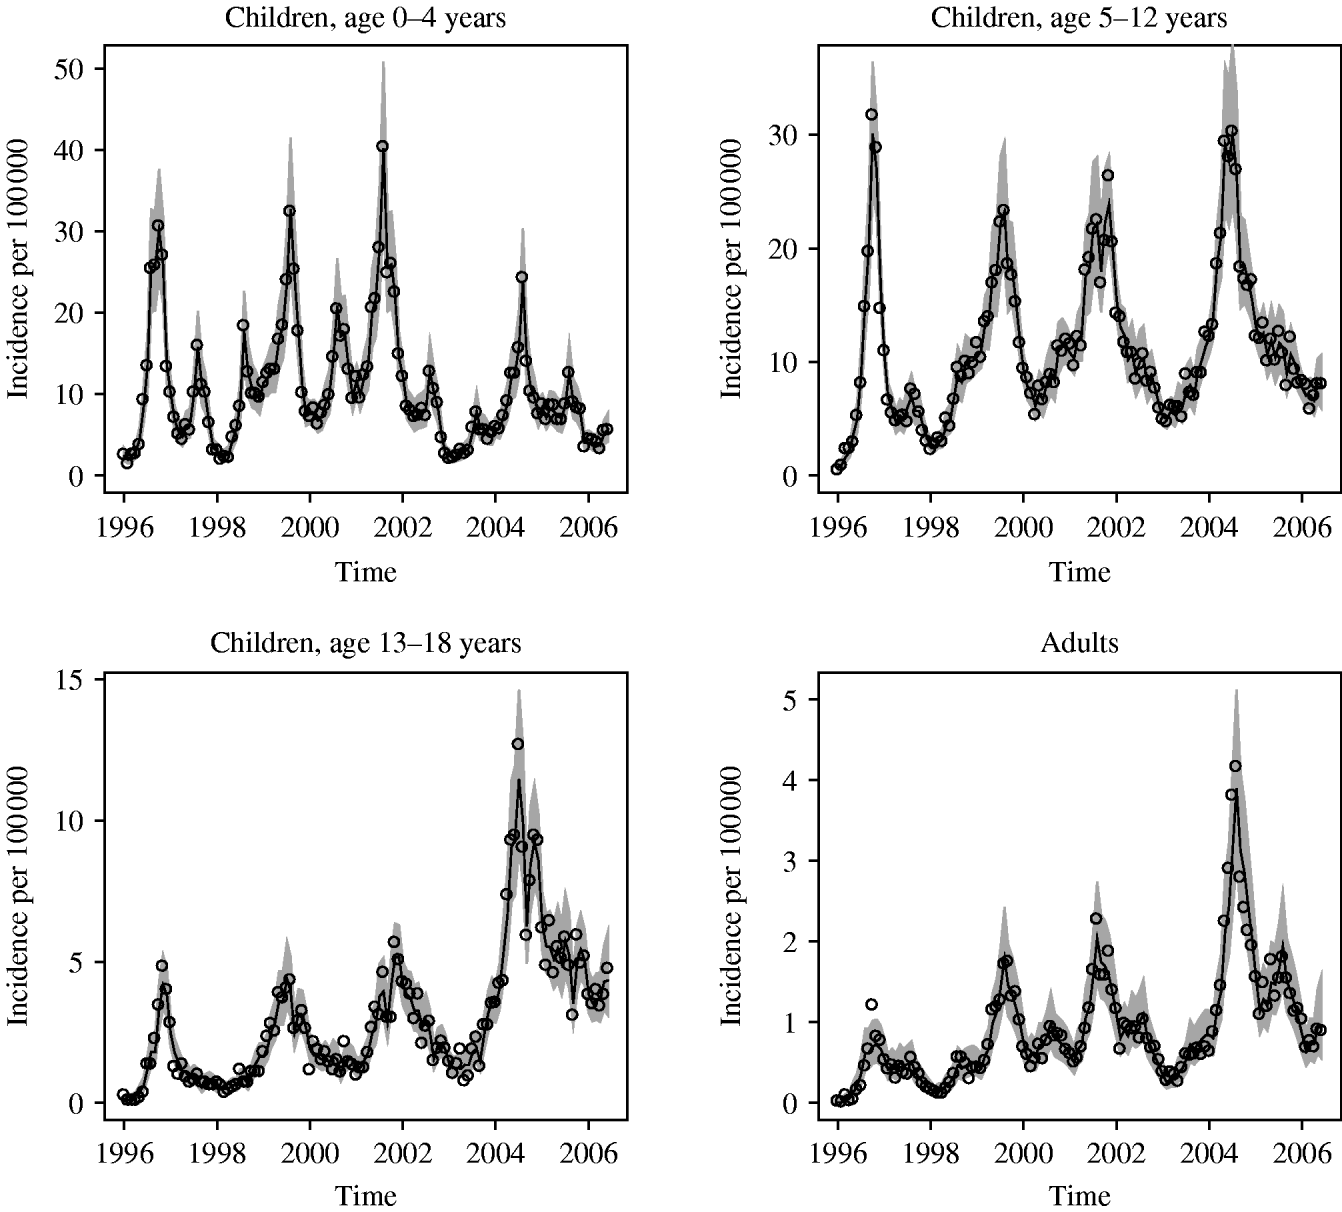
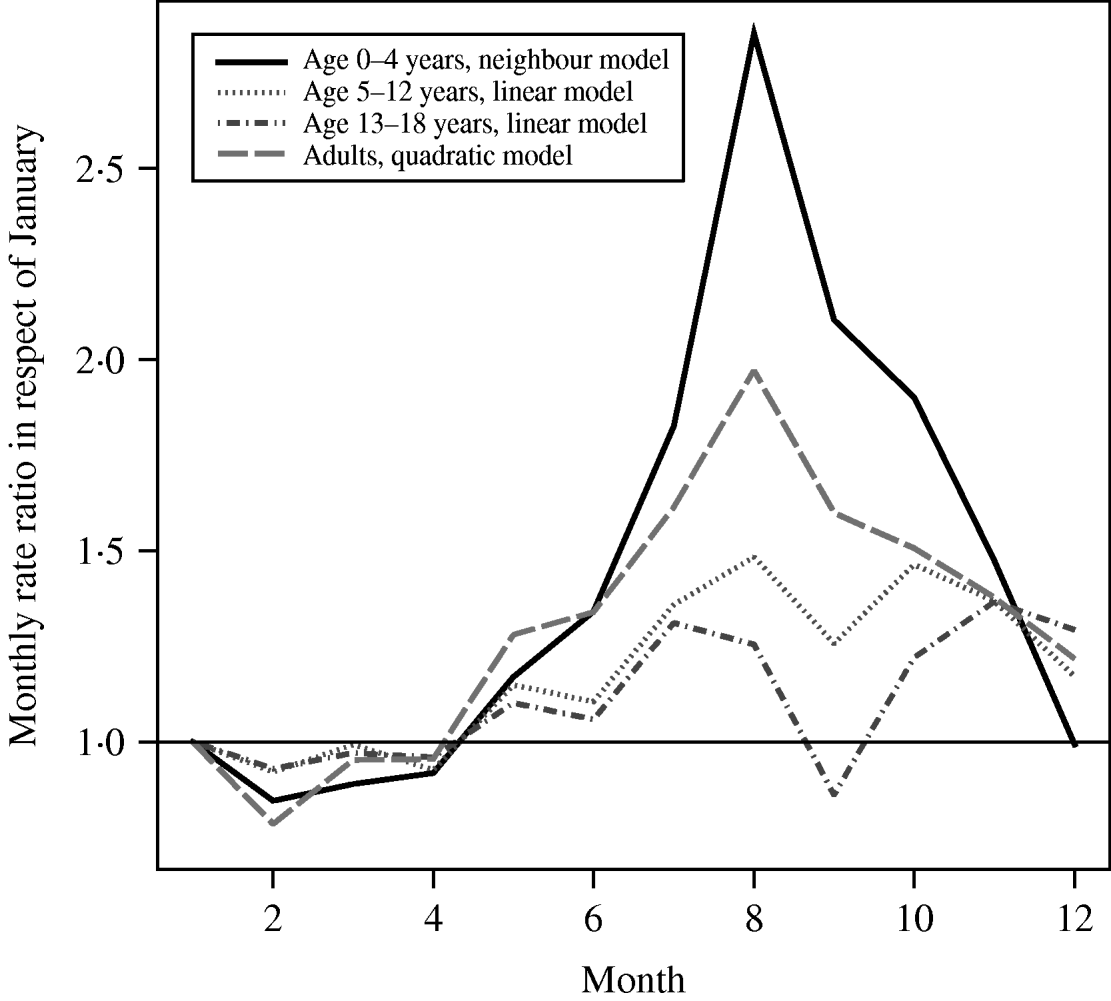
The highest incidence of notified pertussis cases per 100 000 were seen in 1996, 1999, 2001 and 2004 for all groups. This suggests a periodic behaviour, but not with a fixed period. The annual mean of the incidence varied from 4·1 to 20·5/100 000 for the 0–4 years age group and from 0·3 to 2·2/100 000 for adults (Fig. 1). The figures suggest an increasing linear long-term trend in incidence over the years for the 13–18 years group and adults. Including time as a covariable into the models showed that these increasing trends were not statistically significant. The estimated coefficients of the model with the lowest ABIC per age group are given in Figure 2. The neighbour model was the best-fit model for age group 0–4 years, the linear model for age groups 5–12 and 13–18 years, and the quadratic model for the adult group. Month effect was significant in all models. Figure 2 shows that August is the month with the highest month effect for age groups 0–4, 5–12 years and adults, i.e. the predicted incidence in these groups increases compared to January with a factor 2·86 [95% confidence interval (CI) 2·30–3·55], 1·48 (95% CI 1·19–1·83) and 1·97 (95% CI 1·47–2·65), respectively. For the 13–18 years age group the peak is in November, when the predicted incidence increases with a factor of 1·36 (95% CI 1·12–1·66) compared to January.

Fig. 1. Monthly reported incidence rates per 100 000 (open circles) and best-fit model for the period January 1996–June 2006 in each age group. The lines represent the predicted incidence per 100 000. The shaded areas represent the 95% confidence bounds for the predicted incidence.

Fig. 2. Modelled monthly incidence rate ratios in respect of January per age group (January 1996 to June 2007).
In Table 1 the correlations of monthly effects between age groups are given. Trends in adults show a high correlation with trends in 0–4 years (0·94) and 5–12 years (0·92) age groups.
Table 1. Correlation coefficients between the month effects (corrected for autocorrelation) on reported pertussis incidence per 100 000 by age group in the period January 1996–June 2006

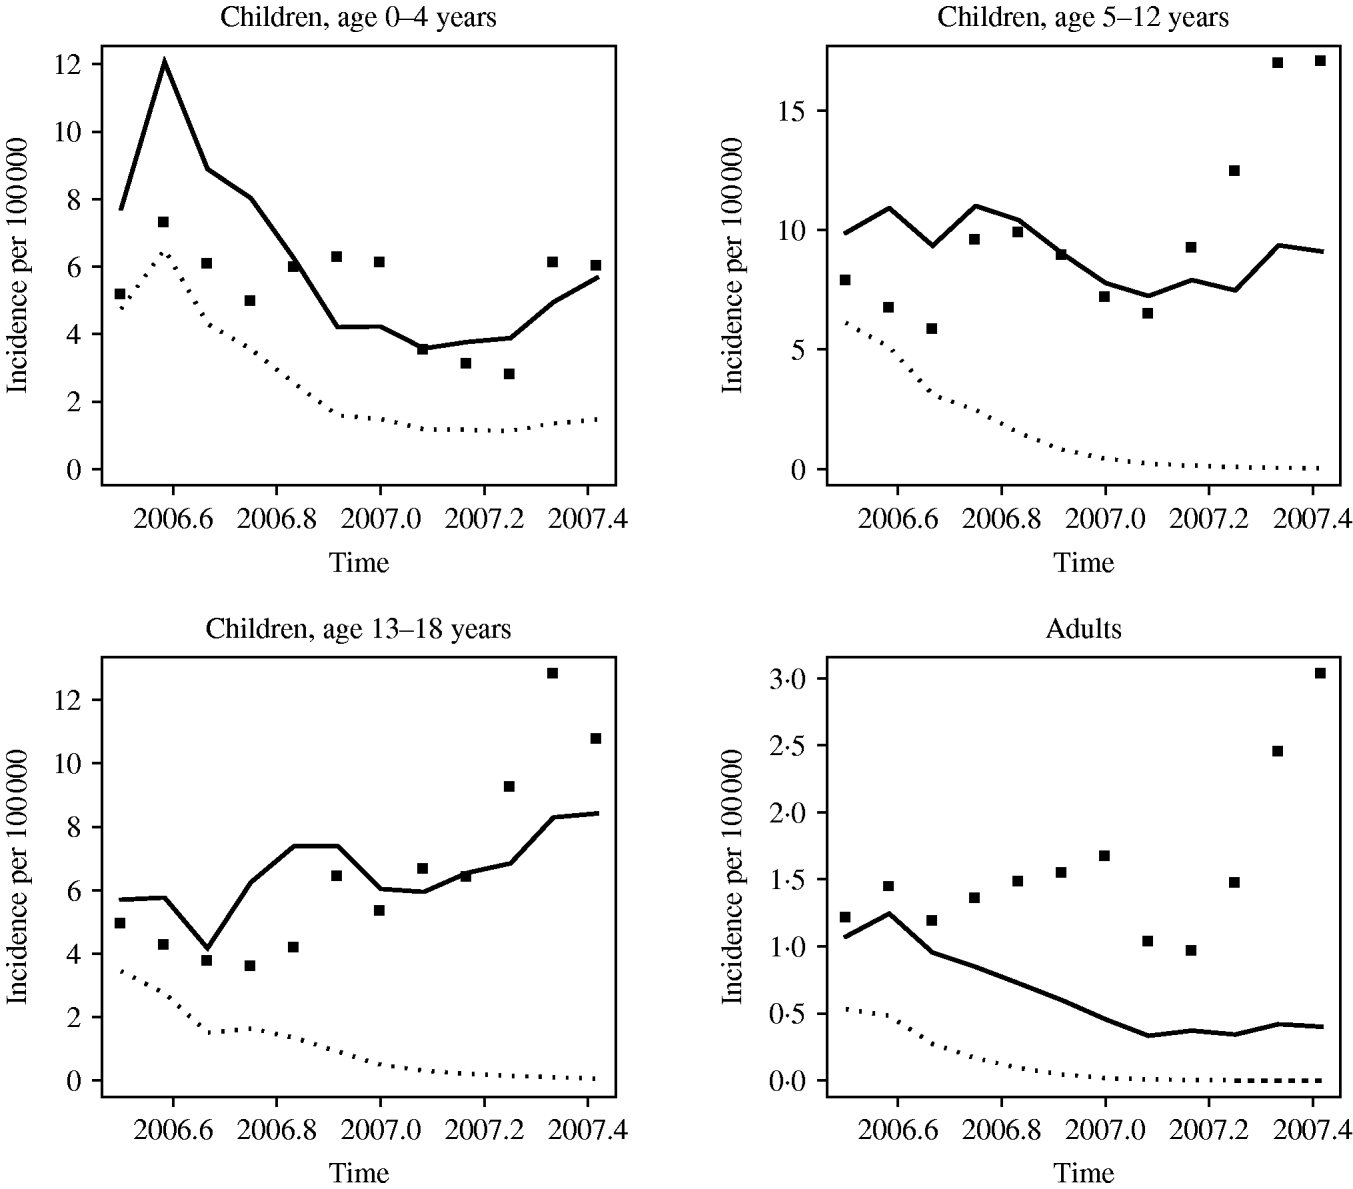
Figure 3 shows the forecasted monthly incidence (solid curve) and the observed incidence of notifications (black symbols) for July 2006–June 2007. Forecasts are given with a corresponding 97·5% lower bound. For the 0–4 years age group the forecasted incidence largely corresponds to the observed incidence. In the older age groups the observed incidence exceeds the estimated incidence in the first half of 2007, confirming our observations from routine surveillance data that 2007 is again an epidemic year.

Fig. 3. Monthly observed incidence of reported cases (▪) and forecasted incidence (——) per 100 000 based on the best-fit model per age group for January 1996 to June 2006. The dotted lines (· · · · ·) represent the 97·5% lower bound for the forecasted predicted incidence. The upper bound is not shown since it varies from 0·06 to ~3500 cases/100 000.
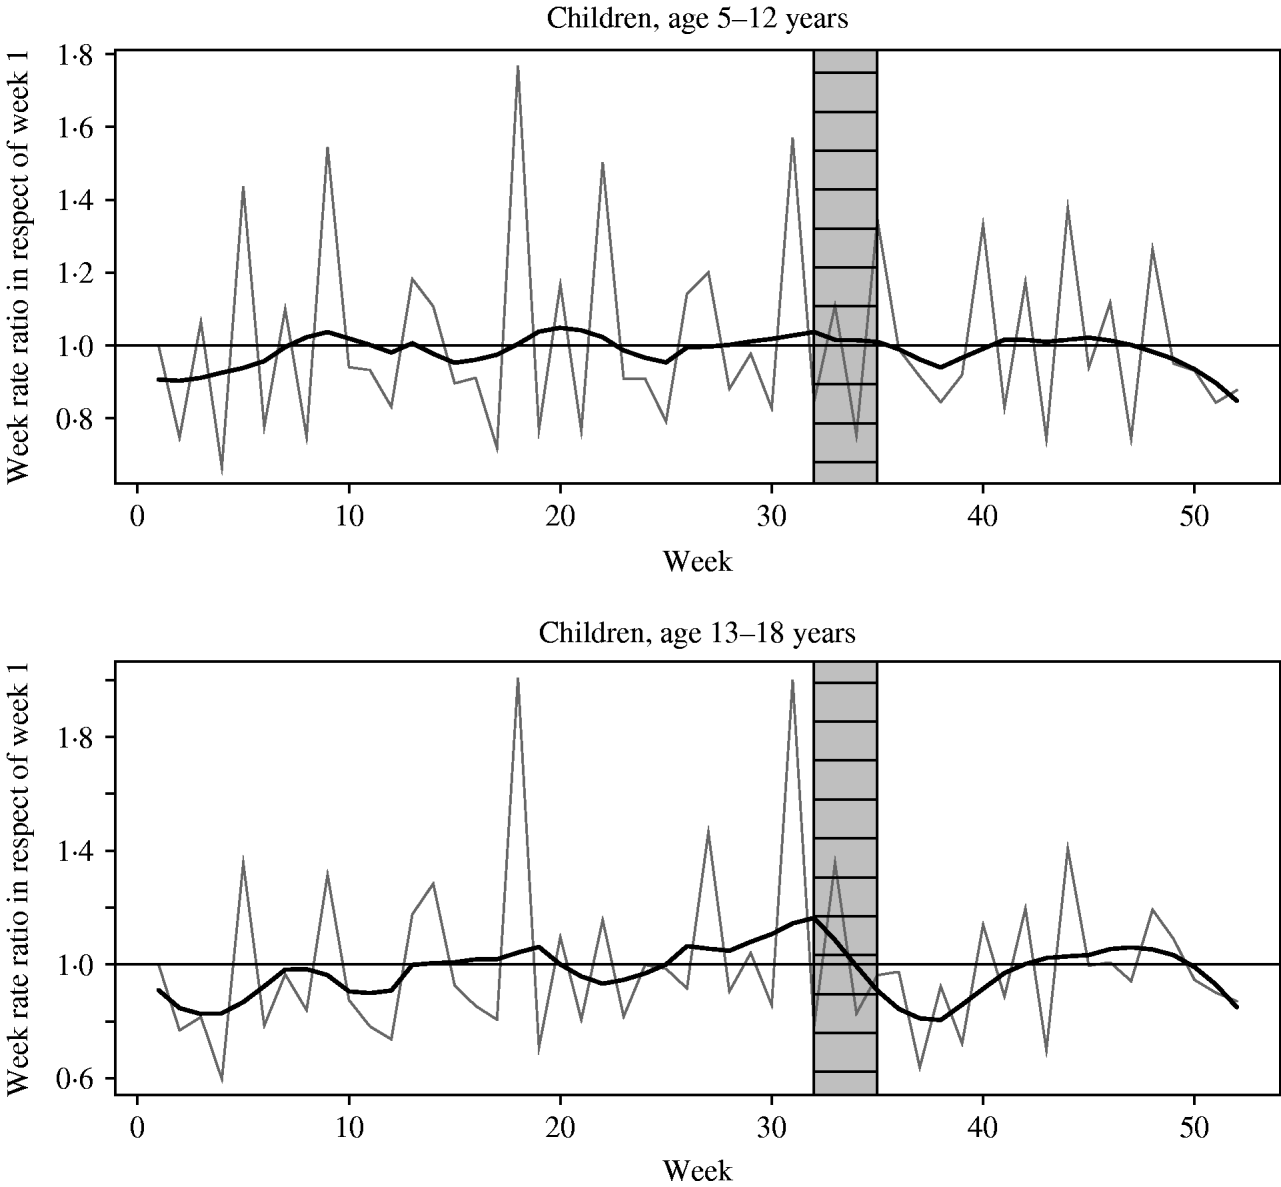
Figure 4 shows the estimated week effects by age group for the period 2000–2004 in relation to the opening of schools. For primary schoolchildren, aged 5–12 years, the incidence peaks in weeks 5, 18 and 31, while in children attending secondary school peaks are observed in weeks 18, 27 and 31.

Fig. 4. Modelled weekly incidence rate ratios in respect of week 1 for the period 2000–2004 by age group. The seasonality in the week effects is visualized by smoothed curves from a loess smoother with span 0·1 (grey lines, less smoothing, weekly effects visible) and span 0·4 (bold lines, more smoothing, large-scale effect visible). The shaded blocks in the figures indicate the period (weeks 32–34) containing the opening of schools for school-aged children.
DISCUSSION
Despite a nationwide vaccination programme with high coverage, every 2–3 years a peak in the incidence of pertussis has been observed in The Netherlands in the last decade. Moreover, a clear seasonal pattern in the incidence of reported cases is seen, with most cases occurring in the third quarter of the year. For all age groups pertussis is most frequent in August, except for the 13–18 years group where the peak occurs in November. We found no evidence for a relationship between the annual increase in pertussis and the opening of schools. However, high correlations between the monthly trends in children aged 0–4 and 5–12 years and adults suggest frequent transmission of pertussis within families.
Periodic epidemics of pertussis have also been reported for other countries [Reference Broutin2]. Such oscillations in the occurrence of a disease in highly vaccinated populations are poorly understood. In case of pertussis, the epidemiology and transmission dynamics are driven by the interplay between waning immunity and boosting by infection or vaccination [Reference Gomes4, Reference Preziosi23, Reference de Greeff24]. In addition, changes in the B. pertussis population may contribute to trends in the epidemiology of pertussis [Reference Mooi25, Reference van Boven26]. Although previous results have been conflicting, some studies have suggested that high levels of immunization increase the inter-epidemic period for pertussis by reducing the effective reproduction number [Reference Fine and Clarkson3, Reference Anderson7, Reference Rohani27]. Grenfell & Anderson [Reference Grenfell and Anderson28] demonstrated that the expected effect of vaccination on the increase of the inter-epidemic period fails to occur when vaccine efficacy is suboptimal or when there is rapid waning of immunity. Thus, the relative short inter-epidemic period we found in the highly vaccinated population of The Netherlands in the last decade may be explained by a low effective immunization coverage due to reduced quality and duration of vaccine-induced immunity of the Dutch vaccine in the mid-1990s [Reference de Melker29]. In addition, the increase in the number of infections in adolescents and adults does indeed indicate a transient increase in the number of susceptible individuals, probably as result of waning of vaccine-induced immunity in combination with the emergence of new strains [Reference Mooi30]. We acknowledge that the introduction of PCR as diagnostic method may have contributed also to the observed increase of pertussis in adults, since a larger proportion of infections can now be diagnosed. However, as only about 5% of reported cases are confirmed by PCR in The Netherlands, this effect will only be marginal [Reference de Greeff24].
Besides epidemic peaks, we found a clear seasonal pattern in the occurrence of pertussis cases. It may be argued that seasonality in pertussis notification data is caused by variations in reporting rate, i.e. a lower reporting rate in winter as other respiratory pathogens are considered in the differential diagnosis. However, the fact that the proportion of positive serological tests for pertussis increases in the same months (data not shown), indicates that there is a true increase of pertussis patients in these months. We acknowledge that notification data considerably underestimate the true incidence of infections as there will be many more ‘subclinical’ cases [Reference de Melker31]. Apparently, variation in host- or pathogen-related factors are important in accounting for seasonal changes in pertussis. Climate or environmental factors may indeed affect host susceptibility or survival of the pathogen outside the host [Reference Grassly and Fraser9].
Regarding measles [Reference Fine and Clarkson10], some authors have suggested there might be an association between opening of schools and an annual increase in pertussis incidence [Reference Fine and Clarkson3, Reference Anderson7, Reference Grenfell and Anderson28]. School outbreaks of pertussis demonstrate that schoolmates play an important role in the transmission of pertussis [Reference Brennan11, Reference De Serres32]. Our data do not support a strong relationship between opening of schools after summer holiday and the start of the annual rise in incidence of pertussis. First, if crowding of individuals after school openings was the driving force for the annual rise, one would expect a peak shortly after opening of schools in weeks 32–34. Here, we see peaks occurring almost every 4 weeks. The latter may reflect that the exact date of onset is often set at the first day of the month if only the month of disease onset is known. Second, in August, the seasonal increase in pre-schoolchildren and adults is much more pronounced than in schoolchildren. Interestingly, in a Canadian study a seasonal increase of pertussis in schoolchildren was found in June during the academic year, while in infants and pre-schoolchildren the typical peak months August and September were maintained [Reference Skowronski5]. These findings might suggest schoolchildren become infected after an exhaustive school year and spread the infection to their family members during summer holidays.
We can think of two reasons why the effect of school opening is not observed for pertussis as for measles. First, because of waning immunity for pertussis not all infected persons have typical symptoms and are diagnosed as pertussis cases [Reference de Melker31]. However, subclinical infections can still contribute to transmission. In relation to this, the transmission of pertussis appears to be very efficient within households, resulting in high attack rates even in vaccinated persons [Reference De Greeff33]. Second, the incubation period for pertussis is highly variable and the infectious period is longer than for measles. Subclinical infections and heterogeneity in infectious period may impede any observable effect of school opening on pertussis incidence.
Following the persistently high incidence of pertussis in 1996–2001 an acellular pre-school booster has been introduced in the Dutch vaccination schedule. After introduction of this pre-school booster the incidence in the targeted age groups declined and some herd immunity effect in infants was observed [Reference de Greeff24]. Correspondingly, the high correlation between the seasonal distribution of reported cases in children aged <4 and 5–12 years probably reflects frequent transmission of pertussis between those groups. Like Tanaka [Reference Tanaka6], we found a high correlation between annual trends in reported cases in young children and adults, while there was a low correlation between teenagers and other groups. Interestingly, these findings are in line with results from totally different types of epidemiological studies. Several household studies have pointed at the prominent role of parents in the transmission of pertussis to children [Reference Bisgard34, Reference Wendelboe35]. In a population-based prospective survey (POLYMOD), Mossong et al. [Reference Mossong36] showed that adolescents mixed preferentially with people of the same age, while young children also mixed with middle-aged adults.
Although annual trends were quite similar in age groups, the selected (best-fit) models to describe these trends differed, indicating different degrees of autocorrelation within each age group: the neighbour model for children, the linear model for the 5–18 years group and the quadratic model for adults. From an epidemiological viewpoint one might speculate that this indicates that there are differences in infectious periods between these groups. The quadratic model for adults may suggest that adults have a relatively long infectious period compared to the younger age groups, corresponding to the fact that in adults transmission might continue during a longer period as the disease is often not immediately recognized.
Even though the mechanisms responsible for seasonal changes are poorly understood, studying the variation in seasonal trends provides insight in transmission dynamics of pertussis. Paralleling annual trends in incidence in adults and young children, suggests frequent transmission within families. As long as vaccines do not offer lifelong protection, this finding supports the introduction of vaccination strategies such as cocooning, that aim to discontinue the most frequent paths of transmission to those that are at highest risk for severe infection, i.e. infants.
ACKNOWLEDGEMENTS
We thank the staff of the municipal public health services concerned with infectious diseases in The Netherlands for collecting and documenting the data requested in the notification system.
DECLARATION OF INTEREST
None.


